VLBI, MERLIN and HST observations of the giant radio galaxy 3C236
Abstract
We present VLBI and MERLIN data at 1.66 and 4.99 GHz on the central component coincident with the nucleus of the giant radio galaxy, 3C236. The nuclear radio structure is composed of two complexes of emission which are resolved on scales from 1 milli-arcsec (mas) to 1 arcsec. Oscillations with an amplitude of 5 can be seen in the compact radio structure. Spectral index distributions are plotted at angular resolutions of 10 and 25 mas and allow us to identify the core component in the south-east emission complex. Re-examination of the HST WFPC-2 image of 3C236 by de Koff et al. dekoff (2000), shows that the normal to the dust disk in the nucleus is 30 from the plane of the sky and within 12 of parallel to the overall orientation of the radio source. We suggest that the radio axis is also at an angle of 30 to the plane of the sky and that the north-west jet is on the approaching side. This orientation implies an overall size of 4.5 Mpc ( km s-1 Mpc-1, ) for 3C236. The coincidence of a dust feature and the south-east compact jet, within the astrometric errors, leads us to suggest that the dust may be in the form of a cloud encountered by the jet in the first 400 pc of its journey out from the nucleus. One-sided emission at 5 GHz on 1 mas scales would suggest that the jets are ejected initially at 35 to the line of sight, but this is difficult to reconcile with the obvious orientation stability of the jet system as a whole. Free-free absorption of the counter-jet may be an alternative explanation for the one-sideness. At the resolution of WSRT data at 327 MHz, the jet to the south-east is apparently continuous over a distance of 2.5 Mpc, making this the largest jet known in the universe. It is likely, however, that activity in the nucleus of 3C236 is episodic but with a shorter duty cycle than in the double-double sources studied by Schoenmakers et al. (schoenmakers (2000)) and Kaiser et al. (kaiser (2000)).
Key Words.:
Galaxies: nuclei – galaxies: jets – galaxies: individual: 3C2361 Introduction
Extragalactic radio sources have been studied for many years, but it is still unclear how they are formed and how they evolve. A crucial element in the study of their evolution is to identify the young counterparts of ‘old’ Fanaroff-Riley (FR) class 1 and 2 extended objects. Recent analyses by Fanti et al. (fanti (1995)), Readhead et al (readhead (1996)), and Snellen et al. (snellen (2000)) suggest that good candidates for young radio sources are the Gigahertz Peaked Spectrum (GPS) and Compact Steep Spectrum (CSS) sources with symmetric morphologies. They are small in angular size as expected for young sources, and could plausibly expand to larger sizes while decreasing in luminosity as required to match the statistics of the numbers of compact and extended objects. The propagation velocities of hot-spots in some small size symmetric sources have been measured at a few tenths of the speed of light by Owsianik & Conway (owsianik (1998)) and Tschager et al. (tschager (2000)); these velocities indicate dynamic ages of a few hundred to a few thousand years. In a few objects we see both a GPS or CSS component associated with the nucleus of the galaxy and extended FR1 or FR2 lobes either side of the nucleus. These sources with recurrent activity provide us with case studies of the evolution of individual objects which constrain models for the evolution of radio sources in general. One such object is 3C236.
3C236 is the largest radio source known in the universe and this in itself makes the source a powerful laboratory for the study of radio source evolution. The remarkable agreement between the orientation of the inner and outer radio structure was one of the original arguments that a massive black hole was the source of the AGN energy. Its angular extent of 39 arcmin corresponds to a projected size of 3.9 Mpc at the redshift of its associated 17m galaxy (, Hill et al. hill (1996), km s-1 Mpc-1, ). Its total radio luminosity of erg s-1 (Mack et al. mack2 (1998)) puts it in the transition zone between FR1 and FR2 systems. Its morphology is also intermediate between FR1 and FR2 on large scales (Strom et al. strom (1981), Barthel et al. barthel (1985)) with a component coincident with the nucleus of the galaxy and two lobes of quite different morphology, one (SE) narrow and edge-brightened (FR2-like) and clearly connected to the nucleus by a low surface brightness jet visible in WSRT 92 cm data (Mack et al. mack1 (1997)), and the other (NW) more diffuse and centre-brightened (FR1-like) and extended towards the nucleus but not obviously by a narrow jet. Spectral index studies at wavelengths from 92 to 2.8 cm by Mack et al. (mack2 (1998)) show that the spectral index in the NW and SE lobes gradually steepens from the edge of each lobe back towards the nucleus; in addition, the spectral index in the NW lobe is generally steeper than in the SE lobe.
About two-thirds of the total luminosity originates in the steep spectrum (, ) nuclear component. Earlier high resolution studies (Fomalont & Miley fomalont (1975); Schilizzi et al. schilizzi1 (1979)) have shown its overall size to be 1.3 arcsec corresponding to 2.2 kpc, with an asymmetric morphology (Barthel et al. barthel (1985)) which is similar in some respects to that on the larger scale.
An HI absorption line has also been detected towards the nucleus of 3C236 by van Gorkom et al. (vgorkum (1989)) with the VLA and mapped in detail with the VLBA by Conway & Schilizzi (conway (2000)). The high angular resolution results show that most of the absorption takes place about 400 pc from the nucleus at the tip of the SE jet, and is possibly due to a jet-cloud interaction.
HST/WFPC-2 observations of 3C236 by de Koff et al. (dekoff (2000)) revealed the presence of a dust ring in the nucleus kpc in diameter and oriented perpendicular to the overall radio axis. In addition, a dust lane was observed on scales of 1 kpc seemingly connected to the dust disk by a strand of dust going from one to the other. 3C236 is unusually bright at FIR wavelengths (Hes et al. hes (1995), Willott et al. willott (2000)) which implies that there is warm dust in the interstellar medium, presumably the dust seen at optical wavelengths. Recent paper by O’Dea et al. (o'dea (2001)) presents HST STIS/MAMA near-UV observations of the nucleus of 3C236. Four star-forming regions are found in an arc along the edge of the dust lane.
The age of 3C236 is quite uncertain. An analysis of the energy and magnetic field content of the large scale lobes by Mack et al. (mack2 (1998)) led to a maximum age for particles in the source of years (for the hotspot at the end of the SE lobe). On the other hand, assuming an average propagation speed for the hotspot in the SE lobe of (Lacey & Cole lacey (1993), Scheuer scheuer (1995)), the age of 3C236 is years. Reacceleration at the hotspot or resupply of electrons to the hotspot via a jet is therefore necessary unless the speed of propagation is an order of magnitude greater than . The age of the CSS nuclear component is equally uncertain, from a few 103 years to a few years old, depending on the speed of propagation. The estimated ages of the star-forming regions found by O’Dea et al. (o'dea (2001)) range from to years.
In this paper we report on an extensive study of the nuclear component in 3C236 using combinations of VLBI and MERLIN data at 18 and 6 cm. Spectral index distributions of the various components on angular scales of 10 mas are presented and the physical characteristics of the nuclear emission are discussed. We re-examine the HST data by de Koff et al. (dekoff (2000)) and its relation to the radio structure on both the large and small scales.
2 Observations and data reduction
2.1 VLBI data
Global VLBI observations of 3C236 were carried out at 1.663 GHz in September 1984 using telescopes at 16 locations: Jodrell Bank (25 m Mk2 telescope), Cambridge (15 m), Defford (25 m), Westerbork-1 (one 25 m telescope from the array), Effelsberg (100 m), Onsala (25 m), Simeiz (22 m), Iowa (18 m), Haystack (36 m), Maryland Point (25 m), Green Bank (43 m), Penticton (26 m), VLA-27 (twenty seven 25 m telescopes), Fort Davis (25 m), Owens Valley (40 m), and Hat Creek (25 m).
Additional global observations at 4.987 GHz were carried out in September 1989 using telescopes at 9 locations: Onsala (25 m), Westerbork-14 (fourteen 25 m telescopes), Jodrell Bank (25 m Mk2 telescope), Effelsberg (100 m), Haystack (36 m), Green Bank (43 m), VLA-27, Pie Town (25 m), and Owens Valley (40 m). Data for the 1.663 GHz observations were recorded with Mk2 equipment (1.8 MHz bandwidth) and correlated on the CIT/JPL data processor at the California Institute of Technology. The 4.987 GHz data were recorded with Mk3 equipment in mode B (28 MHz bandwidth) and correlated at the Max-Planck-Institut für Radioastronomie in Bonn.
2.2 MERLIN data
An important addition to the aperture plane coverage for 3C236 was made by adding MERLIN data obtained at the same frequency but at a different epoch to the VLBI data. Observations at 1.658 GHz were made with seven MERLIN telescopes in September 1993, and at 4.996 GHz with six telescopes in September 1991. In combining the VLBI and MERLIN datasets, we assume that the structure does not vary between the epochs of observation, and that the small scaling errors caused by combination of data at slightly different frequencies is acceptable. In particular, we assume that the 1-2% variations in the flux density of the central compact component seen at 5 GHz over a period of 8 years (see sect. 3.2) have a negligible effect on the matching of the MERLIN and VLBI data taken 2 years apart. The phase centres of the VLBI and MERLIN dataset were originally matched (Schilizzi et al. schilizzi2 (1988)) by assuming that the peak emission in the MERLIN image coincided with component B2 in the VLBI data (see sect. 3). There were no common baselines to verify this assumption. However, the VLBA image at 1292 MHz of Conway & Schilizzi (conway (2000)) showed that this assumption is incorrect and that the phase centre of the MERLIN data should coincide with the centre of component C in the VLBI data. This has been rectified in the data reduction reported here.
The data were reduced using standard procedures in the AIPS package. Images of varying resolution were made by applying tapers to the data in the -plane.
3 Results
3.1 The structure of 3C236 at 1.663 GHz
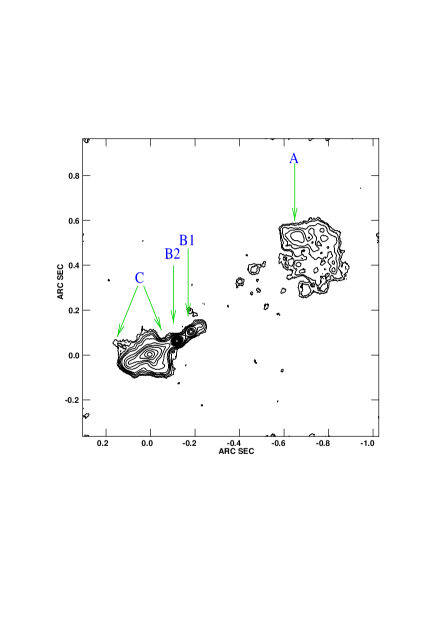
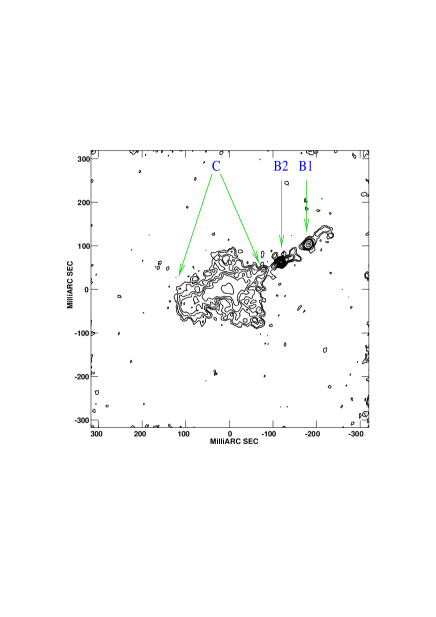
Fig. 1 shows the 2 kpc radio structure in the nucleus of the galaxy with an angular resolution of 25 mas, and Fig. 2 the structure in the central 650 pc with an angular resolution of 10 mas. The visibility data derived from the images shown are a good fit, within the errors, to the observed data on all baselines.
Fig. 1 shows two main emission areas, the central strong emission region (B1–B2–C) and the extended radio lobe in the northwest (A) which appears to be a diffuse plateau structure with low surface brightness. Components B1, B2, and C are more clearly defined in Fig. 2. The brightest and most compact component, B2, was earlier identified as the location of the nucleus of 3C236 on the basis of its spectral index and compactness (Schilizzi et al. schilizzi2 (1988)). Component B1 is a slightly resolved knot in the jet to the NW, and component C appears to be a lobe with a bright spine which defines the radio jet to the SE. The overall radio axis defining the long term orientation of the source is given by the line joining the prominent features in the large scale extended lobes and passing through the nuclear component; this has a position angle (P.A.) of (Schoenmakers et al. schoenmakers (2000), see also Fig. 9). Not all the individual components in the 2 kpc radio structure lie on this line. One that does is the slightly resolved component B1 which lies 77 mas north-west of B2 in P.A. . In contrast, the main ridge line of the lobe-like component C on the other side of B2, lies in P.A. . The most prominent feature in component A is about 720 mas from B2 and located north of the overall source axis. Weak emission features are seen between this feature and the B1–B2–C complex which probably delineate the path of the jet to the north-west. Closer to the nucleus, B2, the jets appear to oscillate in direction; the initial direction of the jets emanating from B2 to the northwest and south-east is in P.A. before changing smoothly to a P.A. of about 50 mas from B2 and back again to mid-way through component C. These observations suggest that the jets emanating from B2 oscillate in direction within a cone of half angle . Note that the brightness of the jets close to B2 are very similar (Fig. 3). The transverse structure in component C which lies 137 mas south east of B2 may be evidence of a shock propagating back through the lobe emission (Barthel et al. barthel (1985), Schilizzi et al. schilizzi2 (1988), Conway and Schilizzi conway (2000)).


| Freq | Stot | Component | S | Sep | P.A. | w1w2 | P.A. |
|---|---|---|---|---|---|---|---|
| (GHz) | (Jy) | (mJy) | (mas) | (deg) | (mas) | (deg) | |
| 1.663 | 2.8 | B2 | 252 | – | – | 129 | 106 |
| B1 | 64 | 77 | 58 | 1714 | 142 | ||
| C | 1560 | 135 | 119 | – | – | ||
| A | 524 | 700 | -58 | 280280 | – | ||
| 4.987 | 1.4 | B2 | 267 | – | – | 129 | 108 |
| B1 | 35 | 75 | 58 | 1612 | 156 | ||
| C | 500 | 134 | 118 | – | – | ||
| A | 220 | 720 | -58 | 280210 | 20 |
3.2 The structure of 3C236 at 4.987 GHz
Fig. 4 shows the central radio structure of 3C236 at 4.987 GHz at an angular resolution of 25 mas, and Fig. 5 the central 650 pc at a resolution of 10 mas. The main features at 4.987 GHz match those at 1.663 GHz including the weak feature in the north of component A. The surface brightness sensitivity at 4.987 GHz is not sufficient to recover the low level emission in the outer regions of component C seen in Fig.s 1 and 2, or to reliably recover the details of the low level emission in component A. The double-sided jet structure associated with B2 at 1.663 GHz is apparently one-sided at 4.987 GHz pointing northwest in the same direction as Fig 2. The oscillating behaviour of the jet in component C is clearly visible within a cone of half angle 5 centred on B2.
When the full angular resolution of the VLBI data is used (1.5 mas, uniform weighting), a different picture emerges (Fig. 6). The centre of component B2 is revealed as a multi-component structure in position angle , with the brightest component at the eastern end. The presence of component B1 is also visible in the data although it is well resolved. This is the highest angular resolution data on the nucleus itself, and it is remarkable that at this resolution, the structure appears to be a one-sided jet whereas, on larger scales, the structure is two-sided.
Comparison of visibility amplitudes of these 5 GHz data with the corresponding data on 5 baselines from April 1981 (Barthel et al. barthel (1985)), shows evidence for brightening of the most compact component in the structure by a few tens of mJy over the 8 year period. Comparison of the apparent positions of the minima in the visibility data shows no consistent evidence for change in the positions of individual components at a level of 0.065 mas/year which corresponds to an upper limit on the speed of separation of .
3.3 Source component parameters
Table 1 gives information on the source parameters measured at 1.663 and 4.987 GHz. 1) observing frequency; 2) total flux density; 3) component name; 4) flux density of the component; 5) distance from B2; 6) P.A. of the component with respect to B2; 7) mean deconvolved component sizes at half power, w1 and w2, determined from two-dimensional Gaussian fits for the components that could be approximated well by a Gaussian; 8) P.A. of the component in degrees. The flux densities in columns 2 and 4 were measured from the images using the AIPS task TVSTAT, and have typical errors of 5%. The separations and position angles in columns 5 and 6 were measured from the images by hand and have typical errors of 5% and respectively. The sizes and P.A.s of individual components in columns 7 and 8 were determined by 2-dimensional gaussian fits where possible and have typical errors of 10% and respectively.
3.4 The spectral index distribution between 1.663 and 4.987 GHz
We have constructed spectral index distributions for 3C236 at angular resolutions of 10 and 25 mas on the assumption that the source structure did not vary during the time spanned by the observations reported here. There is no evidence for flux density variations greater than a few tens of mJy (see sect. 3.2) at either frequency. The images at 1.663 and 4.987 GHz were convolved to the same resolution, then super-imposed assuming the position of the peak brightness in component B2 is the same at each frequency. Spectral indices were computed for each pixel for which the intensities in the two images were both greater than 8.
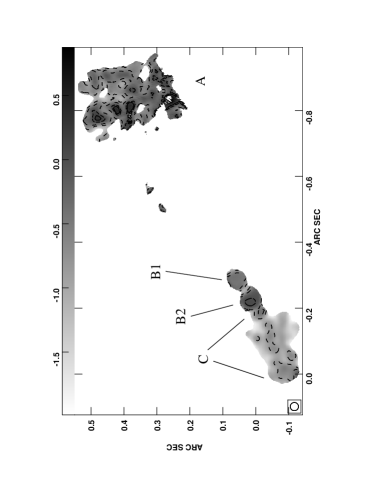
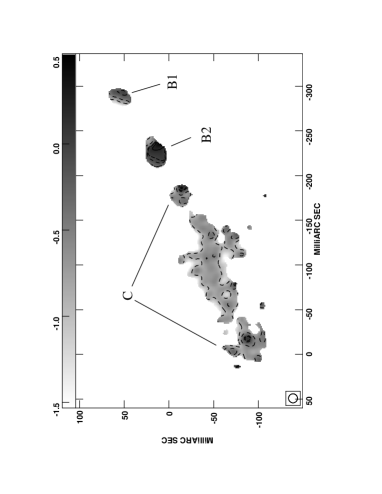
Fig. 7 shows the overall spectral index distribution across the source at an angular resolution of 25 mas. The spectrum is steep () over most of the structure in the central 2 kpc with the exception of component B2 which has a flat spectral index () and the warmspot in the north of component A which appears to have an inverted spectrum (). The other regions of apparent inverted spectrum in component A may not be reliable in view of the substantial difference in -coverage at the two frequencies; these differences are capable of causing ambiguities in the reconstruction of the total intensity of this very extended component. It is interesting to note that the oscillating jet to the SE appears to have a flatter spectral index where it passes through the centre of component C.
A more detailed picture of the distribution of spectral index in the central 500 pc is shown in Fig. 8. The spectral index in B2 varies from in the east to 0.4 at the base of jet to the northwest; further out along the jet it steepens again reaching . There is also a gradation of spectral index in component B1 from east to west, changing from to 0. As remarked earlier, the ridge in component C has a spectral index of about in the centre, which falls off to towards the edges. At the location of the transverse feature in component C, the spectral index appears to flatten from to . At the eastern end of C, the spectral index of the peak seen in the total intensity maps has a flat spectral index of about zero. From this point to the leading edge of the jet is the region in which Conway & Schilizzi (conway (2000)) detect maximum HI opacity.
4 Discussion
4.1 A re-examination of the HST data
The HST snapshot of 3C236 made with the WFPC-2 using a red broad-band filter centred near 7000 Å, shows clear evidence of a substantial dust ring (de Koff et al. dekoff (2000)). Fig. 9 (middle) reproduces the absorption model for the galaxy derived by de Koff et al., in which the main component of dust is in the form of a ring of radius 5 kpc whose apparent symmetry axis differs in position angle by 15 - 20 from the overall radio axis defined by the outer edges of the large scale structure (Fig. 9, bottom). The symmetry axis of the ring is aligned with the apparent minor axis of the galaxy itself, within the errors. A dust feature 1.5 kpc long lies internal to the ring and approximately parallel to it; this may be the remnant of another ring. A further faint dust feature can also be seen emanating from the nuclear region towards the SE.
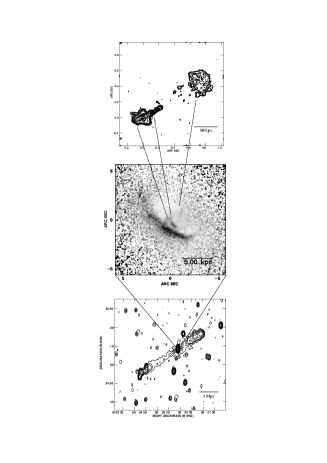
From the ellipticity of the disk, we derive an apparent inclination angle of the radio source to the line of sight of considering that the radio jets are approximately perpendicular to the dust ring. Kotanyi & Ekers (kotanyi (1979)) first pointed out that large scale radio jets are roughly perpendicular to dust disks and lanes, and this has been amply confirmed and extended to the nuclear regions by de Koff et al. (dekoff (2000)), in particular for well defined disks and lanes. It is interesting to note that in NGC 4261, Jaffe et al. (jaffe (1996)) found a very similar offset in P.A. between the radio jet and the symmetry axis of the dust disk in that galaxy. These authors refer to Rees (rees (1984)) in pointing out that Lense-Thirring precession will force the part of the accretion disk nearest to the black hole to be axi-symmetric about the rotation axis of the hole, whatever its spin axis at large radius. At small distances from the black hole the jet and disk axes should coincide. In the case of 3C236 the linearity of the large scale radio jet to the south-east implies that the black hole axis has been oriented at 122 for the lifetime of the source, and that the dust ring axis is offset from this on kpc scales. This offset could arise if the dust has been captured from a smaller galaxy which has been cannibalised by 3C236. The oscillation in direction of the compact and large scale jets (see next section), if due to oscillation in the black hole axis, may well be related to a merger event. The mass of dust in the ring estimated by de Koff et al. (dekoff (2000)) of seems unlikely by itself to cause the oscillations through torque on the accretion disk.
The inclination of the radio axis in 3C236 implies that the northwest jet is approaching and the SE jet receding. It also implies that the true size of 3C236 is 4.5 Mpc rather than 3.9 Mpc calculated for an inclination angle of .
The nominal centre of the galaxy in the optical absorption image lies about 0.2 arcsec south of the northwest end of the small dust feature which extends pc in P.A. before apparently connecting into another dust strand at P.A. 145 . Since the astrometric accuracy of the HST images is arcsec, it is possible that the position of the nucleus coincides with the northwest end of this dust feature. Assuming this to be the case, the fact that the compact radio jet/lobe to the SE (Fig. 9 top; see also Fig. 1, component C) has the same orientation (P.A. ) and almost the same extent ( pc) as the feature, suggests that the radio emission and dust may be related.
We can make some qualitative remarks on this apparent connection. It seems unlikely that the jet has entrained dust on its way out for the simple reason that the jet itself is not in contact with the neutral interstellar medium. It propagates through the relativistic plasma in the centre of the radio ‘lobe’ which is the shocked plasma from the jet that has passed through the hotspot. Indeed De Young (deyoung (1998)) has pointed out that the passage of a strong high-speed shock associated with a radio jet will destroy dust grains by sputtering processes on timescales of years, comparable with the age of component C. The most the radio jet can do is concentrate the dust and hence increase the column density and obscuration along certain lines of sight. This could take place via the expansion of the radio lobe that generates a bow-shock propagating out into the neutral interstellar medium. Of course the speed of the bowshock should not be so high that the dust is destroyed.
Perhaps the simplest explanation of the apparent radio-dust connection is that the dust feature represents a dense cloud that has happened to wander into the path of the jet as shown by the HI absorption data. In this case, the optical dust feature traces the mass which shapes the radio structure, rather than the radio structure generating the optical structure via entrainment.
4.2 Radio morphology
The radio morphology of 3C236 shows structure from less than a few milli-arcseconds to 39 arcmin, a range of 106. At first sight, the small and large scale structures are similar in some respects but not in others. The components to the NW on the small and large scale have approximately the same opening angle, 20 seen from the nucleus, and they are both much more resolved in the transverse direction than the components to the south-east. The structure to the SE is clearly very well collimated on the large scale, but on the small scale the SE component flares about 45 mas (74 pc) from the nuclear component. The higher resolution VLBI data on this component shows that there is still collimated flow through the centre of the flaring component. The flaring is most likely related to a backflow/transverse shock resulting from the putative collision between the jet and a cloud mas (370 pc) from the nucleus (Conway & Schilizzi conway (2000)).
The arm-length ratios (the ratio of the distances from the nucleus to the extremities of the components) of the inner and outer structure are quite different. The end of the NW component on the small scales is considerably further from the nucleus than the end of the SE component, whereas on the large angular scales, the reverse is true. The arm-length ratio for the large scale structure is , defined as the distance of the SE hotspot from the nucleus divided by the distance of the end of the NW structure from the nucleus. This is an average arm-length ratio for giant radio galaxies (Schoenmakers et al. schoenmakers (2000)). Defined in the same way, the arm-length ratio for the compact structure is . The difference may reflect the fact that the large scale structure is shaped by the interaction of the jet with the inter-galactic medium and the small scale structure by the interaction of the jet with the ISM. It is also intriguing that the Mpc SE counter-jet is considerably longer and better collimated than the NW jet. This suggests that the jet to the NW has encountered a denser galactic or intergalactic medium which has reduced its outward motion. The large scale arm-length asymmetry cannot be due to light travel time effects (Longair & Riley longair (1979)), in particular since we conclude that the NW side is approaching.
The fact that 3C236 is so large and has remained so stable in overall orientation argues that it resides in a relatively empty environment. AGN in more dense environments (eg. Cygnus A) radiate more of their energy and/or become Wide Angle Tail sources, whereas more of the energy in objects like 3C236 goes into outward expansion (eg. Barthel & Arnoud barthel2 (1996)).
The 92 cm image of 3C236 (Fig. 9 bottom) provides strong evidence that the jet to the SE has been on for most of the life of the radio source. At the resolution of the measurements (45 arcsec), the jet appears to originate in the nucleus and continue for Mpc before terminating in a double hotspot (Barthel et al. barthel (1985)). The jet appears to broaden in the transverse direction as it moves further away from the nucleus, eventually subtending an angle of which is considerably larger than the angle subtended by the separation of the hotspot at the nucleus, 3. Barthel et al. (barthel (1985)) show that the ridge line of the SE structure wiggles over the final 600 kpc of its trajectory, so that the cone of opening angle 10 may well be the envelope of the jet’s transverse motion. The jet ridge line in the 92 cm image is located along the southern edge of the cone but curves slightly northward before reaching the double hotspot. On average, the jet and counterjet directions have remained very stable over the lifetime of the source.
Close to the nucleus, the SE jet is apparently blocked due to a collision with a cloud (Conway & Schilizzi conway (2000)) which has caused what looks like a transverse reverse shock back towards the nucleus. This is presumably of recent origin since the jet must re-start further out, as we see in the 92 cm data. The highest resolution data on the large scale jet was published by Barthel et al. (barthel (1985)) at 21 cm but does not have sufficient sensitivity to trace the jet in close to the nucleus.
Superficially, the evidence from the large-scale jet to the SE is that activity in 3C236 is rather than . However, the 92 cm image in Fig. 9 has a resolution of 45 arcsec or 74 kpc projected on the plane of the sky. Gaps in the emission of this size would not be detected. Taking a jet speed of (a typical speed for compact symmetric objects on similar scales - Owsianik & Conway owsianik (1998); Tschager et al. tschager (2000)), and assuming that we actually see the jet and not the backflow in a thin lobe, we would not detect ’off’ periods in jet activity lasting less than years. This period is longer than the probable length of the present ‘on’ period represented by the kpc central component, years. The evidence from the structure to the NW points more towards episodic rather than continuous activity. In the central kiloparsec, the jet is traceable via a number of knots on its way from the nucleus via component B1 out to the warmspot in component A at a distance of kpc. Insufficient sensitivity may limit our ability to detect more of the jet on these sub-galactic scales. On larger scales, the emission extends Mpc in what appears to be a more relaxed jet than its well-collimated counterpart to the SE. In the 21 cm image made by Barthel et al. (1985) there is a prominent feature in the NW structure which suggests that the energy supply may have been variable. At 92 cm (Fig. 9 bottom) and at 49 cm (Mack et al. 1997), there is emission south and west of the main radio axis to the NW. The origin of this emission is unclear.
Double-double radio galaxies (Kaiser et al. kaiser (2000)) appear to provide good evidence that activity in AGNs can be recurrent. Presumably these are objects in which the ‘on-off’ cycles are comparable. There may be a wide range of duty cycles amongst AGNs; 3C236 may be an example of a source which is occasionally ‘off’, perhaps due to the jet channel collapsing or the flow being blocked by interaction with a cloud or a drop in supply of fuel to the central black hole. The central structure in 3C236 may reflect the normal level of activity in the nucleus.
Mack et al. (mack2 (1998)) and Schoenmakers et al. (schoenmakers (2000)) have estimated the age of 3C236 from synchrotron loss models and spectral aging as years. The latter authors also estimate the speed of advance of the western jet into the intergalactic medium as 0.1 c. This speed is at the lower limit of what can be measured with VLBI for compact jets in the nucleus (eg. Owsianik & Conway owsianik (1998), Tschager et al. tschager (2000)).
Table 2 lists physical parameters for the core components of radio source 3C236 calculated assuming equipartition, ellipsoidal geometry for components B1, B2 and the NW lobe, cylindrical geometry for the component C, and unity filling factor. The radio window has been taken from Hz. Component sizes have been measured from the 5 GHz images. The volumes derived for components A and C may be in error by a factor of 2-3; for B1 and B2 the errors are of the order of 10%. The spectral indices in the Table are mean values for the components, with typical errors of 10%. The radio luminosity and energy in particles and fields have been calculated following Pacholczyk (pacholczyk (1970)), assuming the proton-electron energy ratio . The estimated errors in these quantities vary with the component in question: for components A and B1 the values listed may be in error by a factor of 2 to 3, while for components B2 and C the error estimates are more like 10 to 30 %. The parameter values found are comparable with those deduced by Barthel et al. (barthel (1985)) taking into account differences in the initial assumptions and measured component parameters.
| Components | Volume (cm3) | Sp index | Lradio (erg s-1) | Ee (erg) | EH (erg) |
|---|---|---|---|---|---|
| A | 1062 | ||||
| B2 | |||||
| B1 | |||||
| C |
The jet power measured on large scales by Schoenmakers et al. (schoenmakers (2000)) is erg s-1 assuming an upper limit of 100 GHz to the radio window. In contrast, on the smaller linear scales, the jet power is erg s-1 with the same upper limit to the radio emission. This may indicate that the nucleus was more active in the past when the outer lobes were created.
Can we reconcile the symmetric structure seen on mas scales at 1.663 GHz with the one-sided structure seen at 5 GHz on 1 mas scales? The HST image (Fig. 9 middle) shows convincingly that 3C236 is from the plane of the sky with the NW jet approaching. For radio emitting plasma moving along the jets with a bulk motion less than a few tens of percent of the speed of light, no beaming effects should be detectable. This is consistent with the symmetric morphology seen in the nucleus of the galaxy on 10 – 20 mas scales (see Fig. 3). The direction of the one-sided structure on milli-arcsecond scales is consistent with the NW jet being the approaching one, but the brightness of the first component in the jet is times stronger than the noise in the receding jet direction. This is not consistent with the angle to the line of sight being 60, independent of the magnitude of the bulk velocity (Baum et al. baum (1997)). A boost in intensity of a factor of 50 can be achieved if the compact jet is oriented at 35 to the line of sight rather than 60, and the bulk velocity is 0.8c. This implies a substantial change in the orientation of the small scale jet which is perhaps unlikely in view of the long term stability of the large scale jet system. However, the P.A. of the compact jet on the plane of the sky is different to the large scale P.A., indicating that the jet orientation does change. A more thorough search for superluminal motion in this structure may be illuminating.
An alternative possibility is that the lack of a counterjet on parsec scales is caused by free-free absorption by ionised gas in the inner region of the gas-dust disk surrounding the black hole. This is seen on VLBI scales in NGC 4261 (Jones et al. jones2 (2000)), Cen A (Jones et al jones1 (1996)), and 3C84 (Walker et al. walker (1994); Vermeulen et al vermeulen (1994)). In NGC 4261, the 1.6 GHz image is symmetric about the nucleus as is the case for 3C236, but at 8.4 GHz NGC 4261 shows the effects of free-free absorption. Higher frequency observations are required to test this possibility in 3C236.
5 Conclusions
The radio structure in the nucleus of the giant radio galaxy, 3C236, has been investigated using combinations of VLBI and MERLIN data at 1.663 and 4.987 GHz. The nuclear structure is dominated by two main complexes of emission whose orientation and separation are in general well aligned with the large scale structure, although differences in the projected P.A. reach within a few tens of milli-arcseconds either side of the nuclear component indicating that the jets oscillate about the mean direction set by the Mpc scale structure. The nuclear component has been identified by its flatter spectrum and compact size in spectral index distributions made at angular resolutions of 10 and 25 mas. The emission is one-sided to the north-west on scales of a few milli-arcsconds, but symmetric on scales of a few tens of milli-arcseconds.
Re-examination of HST data on 3C236 taken by de Koff et al. (dekoff (2000)) reveals that the normal to the plane of the dust ring in the centre of the galaxy is at to the line of sight and parallel, within 15 to 20, to the projected elongation of the radio structure. Assuming that the radio axis is parallel to the normal to the dust disk, we identify the shorter north-west jet as being on the approaching side, and the longer south-east jet as receding. The true size of 3C236 is therefore 4.5 Mpc rather than the 3.9 Mpc determined assuming the source is in the plane of the sky. Coincidence, within the astrometric errors, of a dust feature with the compact south-east jet (component C) is unlikely to be evidence that the south-east radio jet entrains dust in the first 400 pc after leaving the nucleus, rather that the jet has encountered a cloud of gas and dust which actually shapes the radio component.
The one-sided nuclear radio structure to the north-west can be explained on the basis of relativistic beaming effects, if the angle to the line of sight is and the bulk motion of the radio emitting plasma is highly relativistic. However, it is not clear that such a large deviation in angle to the line of sight compared to the large scale structure can be reconciled with the relatively small deviations in projected orientation of the jet system from small to large scales. If the structure is due to beaming, then we must conclude that the change from one-sided to two-sided emission implies that the angle to the line of sight has reached 60 at a separation of mas from the nucleus. The alternative possibility of free-free absorption of the counter jet needs investigation.
At the resolution of WSRT data at 327 MHz by Schoenmakers et al. (schoenmakers (2000)), the south-east jet appears essentially continuous over a distance of 2.5 Mpc from the nucleus to the hotspots, making this the largest jet known in the universe. It is likely, however, that the central activity is episodic but with a shorter duty cycle than for the double-double galaxies studied by Schoenmakers et al. The current central radio emission in 3C236 is evidence of a recent major burst of radio emission superimposed on a more uniform level of activity, perhaps as a result of subsuming a companion galaxy.
Acknowledgements.
We thank A.G. de Bruyn for re-mapping the 327 MHz WSRT data by Schoenmakers et al. (schoenmakers (2000)) in Fig. 9, T.W.M. Muxlow for assistance in combining the VLBI and MERLIN data, and P. Elósegui, H. Liang and H. Sanghera for assistance in reducing the data. We also thank P. Best for helpful discussions of the HST data, and M.A. Garrett for comments on the manuscript. Thanks are also due to the staff at the EVN and US observatories for carrying out the VLBI observations, and to the staff at the CIT/JPL and MPIfR correlators for processing the data. The National Radio Astronomy Observatory is a facility of the National Science Foundation operated under cooperative agreement by Associated Universities, Inc.References
- (1) Barthel P. D., Schilizzi R. T., Miley G. K., Jagers M. J., Strom R. G., 1985, A&A 148, 243
- (2) Barthel P. D., Arnoud K., 1996, MNRAS 283, L45
- (3) Baum S.A., O’Dea C.P., Giovannini G. et al., 1997, ApJ 483, 178
- (4) Conway J. E., Schilizzi R. T., 2000, A&A in preparation
- (5) De Young D., 1998, ApJ 507, 161
- (6) Fanti C., Fanti R., Dallacasa D. et al., 1995, A&A 302, 317
- (7) Fomalont E. B., Miley G. K. 1975, Nat 257, 99
- (8) van Gorkom J. H., Knapp G. P., Ekers R. D., Laing R. A., Polk K. S., 1989, AJ 97, 708
- (9) Hes R., Barthel P. D. Hoekstra H., 1995, A&A 303, 8
- (10) Hill G. J., Goodrich R. W., Depoy D. L., 1996, ApJ 462, 163
- (11) Jaffe W., Ford H., Ferrarese L., van den Bosch F., O’Connell R. W., 1996, ApJ 460, 214
- (12) Jones D. L., Tingay S. J., Murphy D. W. et al. 1996, ApJ 446, L63
- (13) Jones D. L., Wehrle A. E., Meier D. L., Piner P. G., 2000, ApJ 534, 165
- (14) Kaiser C. R., Schoenmakers A. P., Röttgering H. J. A., 2000, MNRAS 315, 381
- (15) de Koff S., Best P., Baum S. A. et al., 2000, ApJ in press
- (16) Kotanyi C. G., Ekers R. D., 1979, A&A 73, L1
- (17) Lacey C. and Cole S., 1993, MNRAS 262, 627
- (18) Longair M. S., Riley J. M., 1979, MNRAS 188, 625
- (19) Mack K. -H., Klein U., O’Dea C. P., Willis A. G., 1997, A&AS 123, 423
- (20) Mack K. -H., Klein U., O’Dea C. P., Willis A. G. and Saripalli L., 1998, A&A 329, 431
- (21) O’Dea C. P., Koekemoer A. M., Baum S. A. et al. 2001, AJ, submitted
- (22) Owsianik I., Conway J. E., 1998, A&A 337, 69
- (23) Pacholczyk A. G., 1970, Radio Astrophysics, Freeman, San Francisco
- (24) Readhead A. C. S., Taylor G. B., Xu W., Pearson T. J., 1996, ApJ 460, 612
- (25) Rees M. J., 1984 ARA&A 22, 471
- (26) Scheuer P. A. G., 1995, MNRAS 277, 331
- (27) Schilizzi R. T., Miley G. K., van Ardenne A., et al., 1979, A&A 77, 1
- (28) Schilizzi R. T., Skillman E. D., Miley G. K., et al., 1988, IAU Symp. 129, 127
- (29) Schoenmakers A. P., de Bruyn A. G., Röttgering H. J. A., van der Laan H., Kaiser C. R., 2000, MNRAS 315, 395
- (30) Snellen I. A. G., Schilizzi R. T., Miley G. K., et al., 2000, MNRAS, in press
- (31) Strom R. G., Baker J. R., Willis A. G., 1981, A&A 100, 220
- (32) Tschager W., Schilizzi R. T., Röttgering H. J. A., Snellen I. A. G., Miley G. K., 2000, A&A in press
- (33) Vermeulen R. C., Readhead A. C. S., Backer D. C., 1994, ApJ 430, L41
- (34) Walker R. C., Romney J. D., Benson J. M., 1994, ApJ 430, L45
- (35) Willott C. J., Rawlings S., Jarvis M. J., 2000, MNRAS 313, 237