Confusion of Diffuse Objects in the X-ray Sky
Abstract
Most of the baryons in the present-day universe are thought to reside in intergalactic space at temperatures of K. X-ray emission from these baryons contributes a modest (10%) fraction of the keV background whose prominence within the large-scale cosmic web depends on the amount of non-gravitational energy injected into intergalactic space by supernovae and AGNs. Here we show that the virialized regions of groups and clusters cover over a third of the sky, creating a source-confusion problem that may hinder X-ray searches for individual intercluster filaments and contaminate observations of distant groups.
Subject headings:
cosmology: diffuse radiation — intergalactic medium — X-rays: general1. Introduction
Most of the baryons in the universe remain undetected. We believe they exist because primordial nucleosynthesis predicts a baryonic matter density amounting to a few percent of the critical density (), while the baryons associated with stars and gas in galaxies make up less than half a percent of (e.g., Fukugita, Hogan, & Peebles 1998). Within clusters of galaxies the intergalactic baryons are obvious because gravitational compression causes them to glow prominently in X-ray light. Elsewhere they are much more difficult to see.
Simulations indicate that a large proportion of the universe’s baryons currently reside outside of clusters in the form of diffuse K gas associated with groups and filaments of galaxies (e.g., Cen & Ostriker 1999; Davé et al. 2000). The low surface brightness of this warm gas has so far made it very challenging to study. Apart from some tantalizing regions of enhanced X-ray surface brightness (Wang, Connolly, & Brunner 1997; Kull & Bohringer 1999; Scharf et al. 2000) and a few O VI absorption features (Tripp, Savage, & Jenkins 2000) we have no positive detections of it.
Taken together, the intergalactic baryons lying inside and outside of clusters ought to contribute a non-negligible fraction of the keV X-ray background. If these intergalactic gases were heated by purely gravitational processes, they would contribute at least 30% of the observed keV X-ray background (Pen 1999; Wu, Fabian, & Nulsen 1999). However, the point-source contribution at these energies is now estimated to be at least 80% (Miyaji, Hasinger, & Schmidt 2000; Mushotzky et al. 2000), implying that less than 20% of this background can be truly diffuse. Non-gravitational energy input by supernovae and perhaps active galactic nuclei can alleviate this discrepancy because these energy sources raise the entropy of the intergalactic gas, making it harder to compress and thereby decreasing its contribution to the X-ray background.
Analyses of the temperature-luminosity relation of clusters and groups likewise suggest that a significant amount of non-gravitational heating has occurred (Evrard & Henry 1991, Kaiser 1991). The energy injected per particle appears to be comparable to the potential depth of a typical group, which would severely affect the properties of groups (e.g., Ponman, Cannon, & Navarro 1999). Models in which early energy injection by supernovae preheats the intergalactic medium can plausibly account for this non-gravitational heating. The motivation for detecting intergalactic baryons outside of clusters is therefore twofold: Detecting this matter would reveal where the baryons implied by primordial nucleosynthesis have gone, and measuring the entropy level of these baryons would provide a key constraint on supernova energy injection into intergalactic space.
This paper shows that detecting X-ray emission from intercluster structures may prove quite challenging because the virial radii of groups and clusters out to high redshift cover a significant fraction of the sky. Much of the cosmic X-ray surface brightness, once point sources are removed, will come from this confused patchwork of groups and clusters, making it difficult to identify true intercluster gas and to separate group emission from other virialized sources along a common line of sight.
2. Intercluster Mean Free Path
Among the major sources of uncertainty that could complicate observations of the low surface-brightness structures in which intergalactic baryons reside are other collapsed structures along the same line of sight. The probability that any given sight line will encounter a virialized structure with turns out to be of order unity. Here we will estimate that probability using a Press-Schechter approach.
For simplicity, let us assume that the distribution of primoridal perturbations is Gaussian with a dispersion on mass scale . The comoving differential number density of virialized objects in the universe can then be approximated by (Press & Schechter 1974). In this expression, is the critical threshold for virialization of a perturbation at mass scale in units of standard deviations, is the value of at some fiducial mass scale , and , where is the current value of the Hubble constant and is the matter density of the universe in units of the critical density.
An appropriate cross-section for a virialized object is , where is the radius within which the mean overdensity is 200 times the critical density. If we define the mass of a virialized object to be the mass within , then , where is the Hubble constant at the redshift of interest. Thus, a mean free path between virialized objects more massive than can be defined by
| (1) | |||||
where is an incomplete gamma function, , and .
In order to relate this equation to observations, we choose keV to be our fiducial temperature and apply the low- mass-temperature relation: (Evrard, Metzler, & Navarro 1996; Horner, Mushotzky, & Scharf 1999). The fiducial mass and cross-section then become and . To find , we fit the integral temperature function to the number density of keV clusters, yielding (Donahue & Voit 1999). Thus, for , which corresponds to a perturbation slope in wavenumber space of , we arrive at
| (2) |
In other words, the probability that a line of sight through the low-redshift universe will intercept a keV cluster is .
Groups with temperatures of - keV are much more common than rich clusters and correspondingly cover a much higher percentage of the sky. To estimate that covering factor, we extrapolate down to temperatures assuming ( to ). For these cooler objects, we find . Because this quantity is of order unity, the projected virial radii of objects with potential depths keV ought to significantly overlap one another.
This calculation is, of course, quite simplistic in that it fails to account for factors like clustering of virialized objects, evolution in their comoving number density, the geometry of the universe, and the known tendency for the Press-Schechter formula to overestimate the abundance of group-size halos. Nevertheless, it illustrates two important points: (1) observations of distant groups will be corrupted at some level by superpositions with other virialized objects, and (2) distinguishing true intercluster baryons from those within virialized structures may prove to be quite difficult, even under ideal observational conditions.
3. Covering Factor of Simulated Groups and Clusters
Large-scale cosmological simulations offer a way to assess the confusion of projected groups more rigorously. The largest such simulations performed to date are the Hubble Volume simulations of the Virgo Consortium, which model comoving cubes Gpc on a side, sufficient to reproduce lines of sight stretching most of the way through the observable universe (Evrard 1999; MacFarland et al. 1999; Frenk et al. 2000). Because of the magnitude of the computational task, the simulations are baryon-free, tracking only the gravitationally-driven behavior of dark-matter particles. Here we will show that total solid angle covered by the virial radii of groups and clusters resolved in these simulations can approach half of the entire sky.
Hubble Volume simulations have been performed for two cosmologies: CDM (, ) and CDM (, ). Several “light-cone” catalogs, which list the mass and position of each object within the past light-cone of a virtual observer located within the simulation volume, have been compiled from each simulation, and the catalogued objects correspond to spherical regions whose mean mass density is 200 times the critical density. Because the masses of individual particles in these simulations are , a typical group contains particles. The catalogs list objects down to a lower limit of 12 particles, too few to model the internal properties of a group but enough to qualify as a significant density concentration. An angular size for each simulated cluster or group can be computed from its catalogued mass and redshift. The coordinate distance of such an object is , where in a flat universe, and its physical diameter is . These quantities combine to give an angular diameter of .
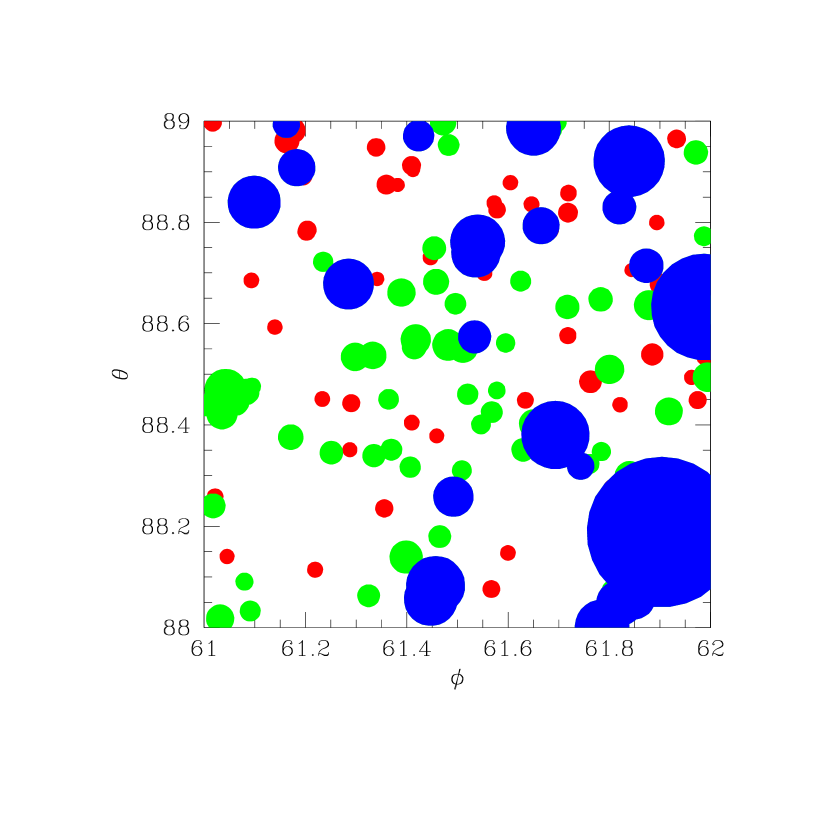
The most convenient type of Hubble Volume catalog for the purpose of studying projection effects is the octant catalog which records cluster properties along a light cone viewed from a corner of the simulation cube. For CDM and CDM the limiting redshifts of the octant catalogs are and , respectively. Summing the projected solid angles of clusters out to the limiting redshift and mass of each catalog, we find that the total area covered by virialized objects is 46% of the sky in the CDM case and 52% of the sky in the CDM case. Figure 1 shows the projected virial radii of clusters and groups more massive than (12 particles) within a typical square degree of the CDM simulation. Objects with are shown in blue, those with are in green, and those with are in red. Significant overlap is evident in many cases, and accounting for that overlap lowers the net sky coverage to 33% for CDM and 35% for CDM. These figures should be considered lower limits for two reasons: Clusters and groups more distant than the simulations’ redshift limits will provide additional coverage, and comparisions of the Hubble Volume simulations with smaller-scale ones indicate that the Hubble Volume catalogs are 10-20% incomplete at the low-mass end (Jenkins et al. 2000).
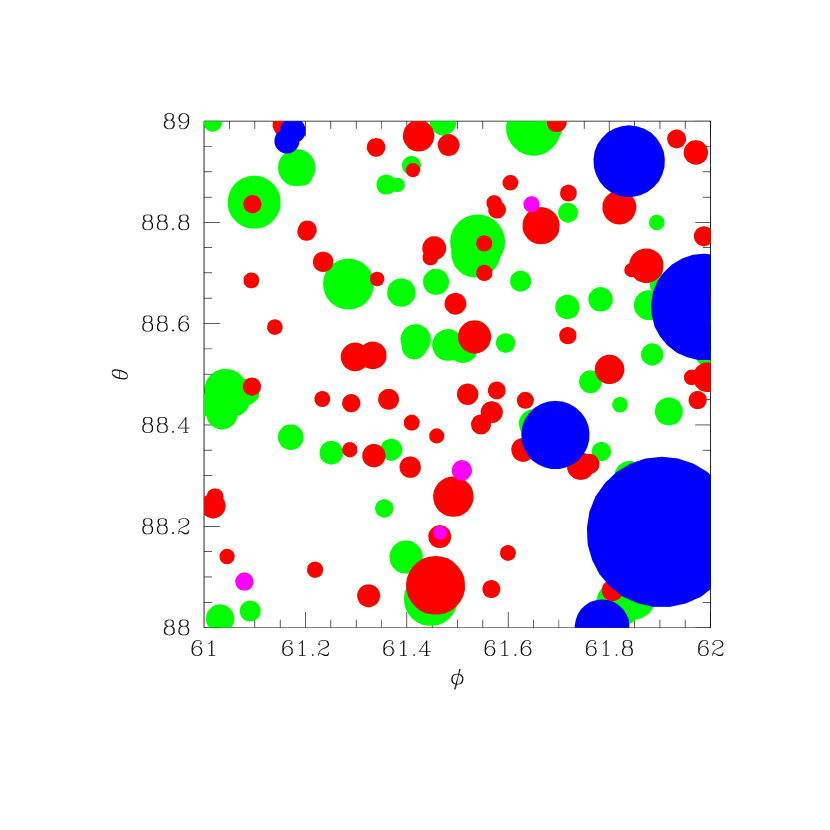
Because highly redshifted groups do not contribute much flux to the keV background, the apparent temperatures of projected virialized objects are also worth investigating. Using an evolving mass-temperature relation to convert from mass to temperature (Voit 2000) and dividing each temperature by , we can assign an apparent temperature to each cluster and group in the Hubble Volume catalogs. Figure 2 shows the same field as Figure 1, color-coded by apparent temperature. Objects with are shown in blue, those with in green, in red, and in magenta. The majority of the sky coverage in this catalog evidently comes from objects with .
4. Surface Brightness of Virialized Objects
Even though virialized objects cover a large percentage of the sky, much of that solid angle corresponds to low surface-brightness emission. Current estimates of the mean keV surface brightness attributable to intergalactic baryons are in the range (Wang & Ye 1996; Wu et al. 1999; Pen 1999; Davé et al. 2000). In this section we crudely estimate the surface brightness of a virialized object at its virial radius and show that it is probably within an order of magnitude of the mean diffuse surface brightness, implying that these objects blend into the background in the neighborhood of their virial radii.
X-ray luminous clusters generally have surface brightness profiles that are adequately represented by the relation , where is the projected angular radius from the center of the cluster, is the angular equivalent of the physical core radius , and the parameter reflects the behavior of at large radii (Cavaliere & Fusco-Femiano 1978). Integrating this expression for a typical value of gives the cluster’s X-ray flux: . For , we then obtain
| (3) |
where is the X-ray luminosity of the cluster.
To derive a numerical value for , we adopt the core radius-luminosity relation of Jones et al. (1998), , and assume . We also construct a ROSAT-band luminosity-temperature relation from the relations of Markevitch (1998): , where for and for . For the fiducial temperature of 5 keV, we obtain , very challenging for ROSAT but well within the capabilities of and . Note also that the factor owing to the increased high- density scale tends to offset the surface-brightness dimming.
On group scales, drops by an order of magnitude to below the presumptive mean surface brightness of the intergalactic medium. However, this scaling presumes that the luminosity-temperature and core radius-luminosity relations we have adopted can be extrapolated to keV. Observations of the - relation for groups show that this relation in fact steepens at low temperatures and its scatter widens (e.g., Helsdon & Ponman 2000). The scaling of is even less secure, given the degeneracy between and in fits to flattened surface-brightness profiles.
Combining these surface brightness estimates with the Hubble Volume catalogs, we can also assess the distribution of X-ray surface brightness owing to virialized objects. Figure 3 illustrates the fractional area covered by diffuse, virialized gas with a ROSAT-band surface-brightness greater than . Splitting the sample into objects with masses less than and those greater than that value shows that the low-mass objects dominate the diffuse surface-brightness distribution below , raising the possibility that the properties of these lower-mass systems might profitably be studied through statistical analyses of the diffuse X-ray background, circumventing the difficulties of selecting and modelling X-ray groups in an unbiased way. In practice, however, such studies will have to contend with background counts generated by charged particles, which can be comparable to the astrophysical background in Chandra and XMM/Newton observations.
These crude estimates show that while the surface-brightness profiles of rich clusters should dominate the mean background emission from other diffuse structures to at least , the same is not necessarily true for groups. Emission from near the virial radii of groups could be seriously diluted by other emission from unassociated gas along the same line of sight, particularly that from other groups seen in projection. Numerical simulations accounting for these projection effects will be needed to establish the level of this contamination.111While this paper was being refereed, Croft et al. (2000) released a preprint describing numerical simulations of the diffuse X-ray background that support our conclusions regarding the difficulty of isolating individual X-ray filaments among the many groups that tile the X-ray sky.
5. Summary
This paper has shown that the projected virial radii of groups and clusters cover much of the sky. Estimates of this covering factor based on Press-Schechter analysis place the covering factor of objects near unity. Calculations of the group-cluster covering factor based on the Hubble Volume simulations corroborate this estimate. The virial regions of simulated objects with cover at least a third of the sky in both CDM and CDM cosmologies, meaning that projection effects could potentially contaminate X-ray observations of distant groups. These same projection effects will also complicate the search for emission from warm baryons associated with intercluster filaments. Untangling the large-scale structures seen in deep X-ray images may therefore require additional information from optical redshift surveys that trace the skeleton of dark matter upon which intergalactic baryons are draped.
References
- (1)
- (2) Cavaliere, A., & Fusco-Femiano, R. 1978, A&A, 70, 677
- (3)
- (4) Cen, R., & Ostriker, J. P. 1999, ApJ, 514, 1
- (5)
- (6) Croft, R. et al. 2000, astro-ph/0010345
- (7)
- (8) Davé, R. et al. 2000, astro-ph/0007217
- (9)
- (10) Donahue, M. E., & Voit, G. M. 1999, ApJ, 523, 137L
- (11)
- (12) Evrard, A. E. 1999, in Evolution of large scale structure: from recombination to Garching, eds. A. J. Banday, R. K. Sheth, L.N. da Costa (Garching: ESO), p.249
- (13)
- (14) Evrard, A. E., & Henry, J. P. 1991, 383, 95
- (15)
- (16) Evrard, A. E., Metzler, C. A. & Navarro, J. F. 1996, ApJ, 469, 494
- (17)
- (18) Frenk, C. S. et al. 2000, astro-ph/0007362
- (19)
- (20) Fukugita, M., Hogan, C. J., & Peebles, P. J. E. 1998, ApJ, 503, 518
- (21)
- (22) Helsdon, S. F., & Ponman, T. J. 2000, MNRAS, 315, 356
- (23)
- (24) Horner, D. J., Mushotsky, R. F., & Scharf, C. A. 1999, ApJ, 520, 78
- (25)
- (26) Jenkins, A. 2000, MNRAS, in press, astro-ph/0005260
- (27)
- (28) Jones, L. R., Scharf, C., Ebeling, H., Perlman, E., Wegner, G., Malkan, M., & Horner, D. 1998, ApJ, 495, 100
- (29)
- (30) Kaiser, N. 1991, ApJ, 383, 104
- (31)
- (32) Kull, A., & Bohringer, H. 1999, A&A, 341, 23
- (33)
- (34) Lacey, C., & Cole, S. 1993, MNRAS, 262, 627
- (35)
- (36) MacFarland, T., Couchman, H. M. P., Pearce, F. R., Pilchmeier, J. 1999, New Astronomy, 3, 687
- (37)
- (38) Miyaji, T., Hasinger, G., & Schmidt, M. 2000, A&A, 353, 25
- (39)
- (40) Mushotzky, R. F., Cowie, L. L., Barger, A. J., Arnaud, K. A. 2000, Nature, 404, 459
- (41)
- (42) Pen, U. 1999, ApJ, 510, L1
- (43)
- (44) Ponman, T. J., Cannon, D. B., & Navarro, J. F. 1999, Nature, 397, 135
- (45)
- (46) Press, W., & Schechter, P. 1974, ApJ, 187, 425
- (47)
- (48) Rauch, M., et al. 1997, ApJ, 489, 7
- (49)
- (50) Scharf, C., Donahue, M., Voit, G. M., Rosati, P., & Postman, M. 2000, ApJ, 528, L73
- (51)
- (52) Tripp, T., Savage, B. D., & Jenkins, E. B. 2000, ApJ, 534, L1
- (53)
- (54) Wang, Q. D., Connolly, A., & Brunner, R. 1997, ApJ, 487, L13
- (55)
- (56) Wang, Q. D., & Ye, T. 1996, New Astronomy, 1, 245
- (57)
- (58) Weinberg, D., Miralda-Escude, J., Hernquist, L., & Katz, N. 1997, ApJ, 490, 564
- (59)
- (60) Wu, K. K. S., Fabian, A. C., & Nulsen, P. E. J. 1999, astro-ph/9910122
- (61)