A Far-Ultraviolet Spectroscopic Survey of the Globular Cluster 47 Tuc
Abstract
We present preliminary results from a FUV spectroscopic and photometric survey of the globular cluster 47 Tuc. Our main goal is to either confirm or rule out the existence of a large population of CVs in the core of this cluster.
We have so far identified approximately 425 FUV sources, most of which are probably hot, young WDs. However, we have also found approximately 30 FUV sources whose position in a FUV-optical color-magnitude diagram makes them strong CV candidates. If most or all of these objects are eventually confirmed as CVs, the large CV population predicted by tidal capture theory has finally been found.
Our data has also allowed us to resolve the long-standing puzzle surrounding AKO 9, a UV-bright and highly variable 1.1 day binary system in 47 Tuc. AKO 9 is the brightest FUV source in our data and presents a blue FUV spectrum with strong C iv and He ii emission lines. Its spectrum is similar to that of the long-period, DN-type field CV GK Per. Based on this similarity and other evidence, we suggest that AKO 9 is a long-period CV in which mass-transfer is driven by the nuclear evolution of a sub-giant donor star.
University of Southampton, Department of Physics and Astronomy, Highfield, Southampton, SO17 1BJ, UK
American Museum of Natural History, Department of Astrophysics, Central Park West, New York, NY 10024, USA
Space Telescope Science Institute, 3700 San Martin Drive, Baltimore, MD 21218, USA
1. Introduction
Globular clusters (GCs) are fantastic stellar crash test laboratories. Because of the huge number of stars that are crammed into the relatively small core of a GC, close encounters between cluster members are almost ubiquitous. It has been estimated that up to 40% of the stars in the cores of some GCs have suffered a physical collision during their lifetime (Hills & Day 1976). Near misses are even more common and are thought to produce the close binary systems (CBs) that in turn can drive the dynamical evolution of entire GCs (Hut et al. 1992).
The dominant mechanism for CB production in GCs is thought to be “tidal capture” (Fabian, Pringle & Rees 1975). This term describes the outcome of a close encounter between a degenerate object (neutron star [NS] or white dwarf [WD]) and a main-sequence (MS) star. In the course of such an encounter, strong tides are raised on the surface of the MS star. These distortions dissipate orbital energy and can therefore result in capture of the MS star and CB formation.
Tidal capture theory was developed to account for the overabundance of x-ray sources (thought to be NS/MS binaries) in the cores of GCs (e.g. Katz 1975). However, tidal capture theory also predicts that even more cataclysmic variables (CVs) – interacting WD/MS binary systems – should exist in GC cores. In fact, detailed simulations predict the presence of well over 100 CVs in each of 47 Tuc and Cen (Di Stefano & Rappaport 1994). Despite several HST-based searches for these systems in several clusters, only a handful of candidates have so far been found (Table 1). If this apparent dearth of CVs is real, it raises serious questions about tidal capture theory and perhaps even about our binary-driven view of GC evolution.
| Globular Cluster | Known CV | |
| NGC Number | Other Name | candidates |
| NGC 6397 | 3 | |
| NGC 6681 | 0 | |
| NGC 7078 | M 15 | 0 |
| NGC 6441 | 1 | |
| NGC 6624 | 1 | |
| NGC 6293 | 0 | |
| NGC 1851 | 0 | |
| NGC 7099 | M 30 | 0 |
| NGC 6752 | 2-4 | |
| NGC 104 | 47 Tuc | 3 |
| NGC 6093 | M 80 | 3 |
| NGC 5904 | M 5 | 1 |
| NGC 5927 | 0 | |
| NGC 6637 | M 69 | 0 |
| NGC 6402 | M 14 | 1 |
| NGC 6171 | M 107 | 0 |
| NGC 6352 | 0 | |
Unfortunately, none of the previous searches for CV in GCs has been definitive. The candidates found so far typically have absolute magnitudes , which is close to the effective detection limit for CVs in these surveys. The majority of CVs in the field are at least 1-2 mags fainter than this (Figure 1). Most of these objects could simply not have been detected in GCs to date. Moreover, all previous searches identified CV candidates on the basis of just one or two characteristics (e.g. variability due to orbital motion, dwarf nova [DN] eruptions, H emission, UV excess). But not all field CVs exhibit all of these characteristics: low inclination systems display little or no orbital variability; most magnetic CVs do not undergo DN outbursts; and some disk-accreting CVs exhibit very weak H lines. Sensitivity to many distinguishing characteristics is therefore vital if a CV census is to be reliable. Previous searches have not been “broad” enough in this sense. It is therefore unclear whether the large number of CVs predicted by tidal capture theory exist in the cores of GCs.

2. Observations
In order to obtain a definitive, empirical answer to this question, we are currently carrying out a new HST-based search for GC CVs. However, our search is based on a completely novel observational strategy. Its two key components are: (i) a strong emphasis on the far-ultraviolet (FUV) waveband (1450Å-1750Å); (ii) the combination of FUV and optical photometry with slitless, multi-object FUV spectroscopy. We can therefore achieve immediate spectroscopic confirmation of most photometric CV candidates. Our program also provides information on stellar variability a wide range of time-scales, from 10 mins (individual exposures), to hours (single HST visits), to weeks and months (spacing between HST visits).
Our survey is targetted on the well-known cluster 47 Tuc, whose proximity (), low reddening () and high metallicity ([Fe/H=-0.76]) makes it ideal for our purposes. (The high metallicity is important because it means there are no blue horizontal branch stars that may swamp the FUV light of candidate CVs.) We have observed 47 Tuc with the Space Telescope Imaging Spectrograph (STIS) for a total of 30 HST orbits, spread over 6 visits of 5 orbits each. One pilot visit occurred in September 1999; the remainder took place during a two week window in August 2000. The majority of time in each visit was spent on slitless FUV spectroscopy with the G140L grating, implemented as a series of successive 10 min exposures. A quartz filter was used to block all light shortward of about 1450 Å in order to suppress the strong geocoronal backgrounds due to Ly and O i. The remaining time in each visit was spent on a sequence of 10 min FUV images and 1 min optical images. The FUV images are important for several reasons: (i) they allow us to search for short time-scale variability essentially all the way down to the spectroscopic detection limit; (ii) their sum actually goes deeper than our FUV spectroscopy; (iii) they allow us to assess and correct for any remaining crowding in the slitless FUV spectral images. The main purpose of the optical images is to tie our data to existing HST observations of 47 Tuc, including the extremely deep WFPC2 data set that has been obtained as part of a recent search for planets in this cluster (Gilliland et al. 2000).
Our CV search is both deeper and broader (in the sense defined above) than any previous surveys. More specifically, the crucial characteristics of our program are:
(i) Depth: We expect to detect faint CVs down to spectroscopically and photometrically (in our FUV images). Thus our census of CV candidates for the observed part of this cluster will be essentially complete (c.f. Figure 1). Taking all observational limiting factors into account, we find that Di Stefano & Rappaport’s (1994) simulations provide a firm target: we should discover and confirm at least 25 CVs spectroscopically and detect an additional 15 in our FUV images.
(ii) Breadth: Our FUV search is sensitive to all of the following CV characteristics: UV brightness, blue FUV spectral shape, strong C iv 1550 Åand He ii 1640 Å lines, flickering variability (on time-scales of minutes), orbital variability (on time-scales of hours), DN eruptions and high/low state variability (on time-scales of weeks to months).
3. Results
The analysis of the observations is still ongoing. The results presented below are therefore preliminary and based only on the data obtained during the September 1999 pilot visit.
3.1. White Dwarfs, Blue Stragglers and Cataclysmic Variables
Figure 2 shows a comparison of the FUV and optical images of the cluster core. Note the dramatic difference in crowding between the two exposures. The positions and error circles of x-ray sources, blue stragglers (BSs) and other unusual objects known previously are marked in the FUV image. There are several clear coincidences, but most of our FUV sources do not have a well-known optical or x-ray counterpart.
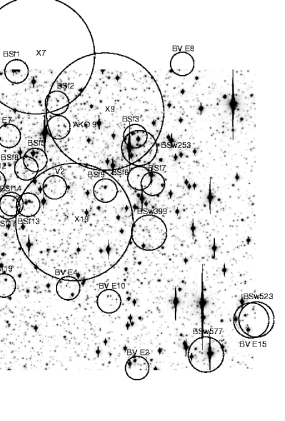
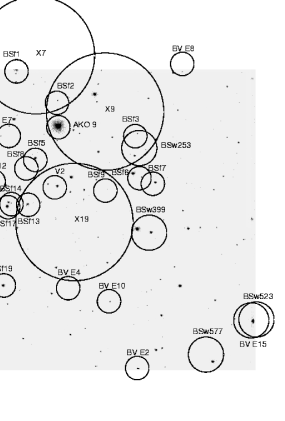
Figure 3 shows the summed FUV spectral image of the cluster core, as produced by our slitless spectroscopy. Each trail in this figure is the dispersed image of a bright FUV point source. The sharp cut-off at the left hand side of each trail corresponds to the abrupt decrease in sensitivity shortward of 1450 Å, where the quartz filter becomes opaque. This cut-off can actually be used to provide a “rough-and-ready” wavelength calibration. The spectra of well isolated, bright objects can be extracted fairly straightforwardly from the spectral image, using a method analogous to aperture photometry (i.e. by placing a ’virtual’ slit on the image). However, the extraction of overlapping and/or faint spectral trails requires the spectral equivalent of PSF-fitting photometry.
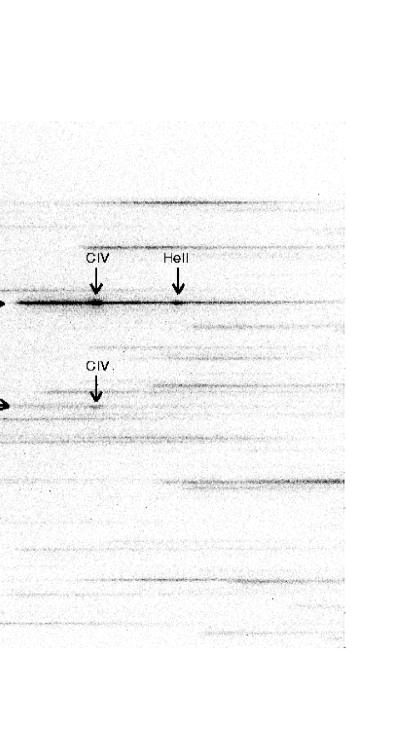
Figure 4 shows the FUV luminosity function, which rises fairly steeply towards fainter magnitudes. By far the brightest FUV source in our images is the well-known object AKO 9, to which we will return in Section 3.2. The total number of FUV sources we have detected to date is 425. Most of these are likely to be WDs, as shown by the following simple estimate (c.f. Richer et al. 1997) The number of stars in two post-main-sequence phases is, in general, proportional to the duration of these phases. We will use horizontal branch (HB) stars as a reference point, and therefore take as the number of HB stars in our field of view (FOV) and yrs as their lifetime (e.g. Dorman 1992). We then expect to find approximately
| (1) |
WDs hotter than in the FOV, where is the time it takes a WD to cool to . Inspection of existing optical data shows that (Guhathakurta et al. 1992). The appropriate WD cooling time can be estimated from the fact that we can detect WDs down to approximately K in our summed FUV image. WD models predict a cooling time of yrs to reach this temperature (e.g. Wood 1995). Substituting these numbers into Equation 1, we find that we may expect to detect WDs in our FOV.
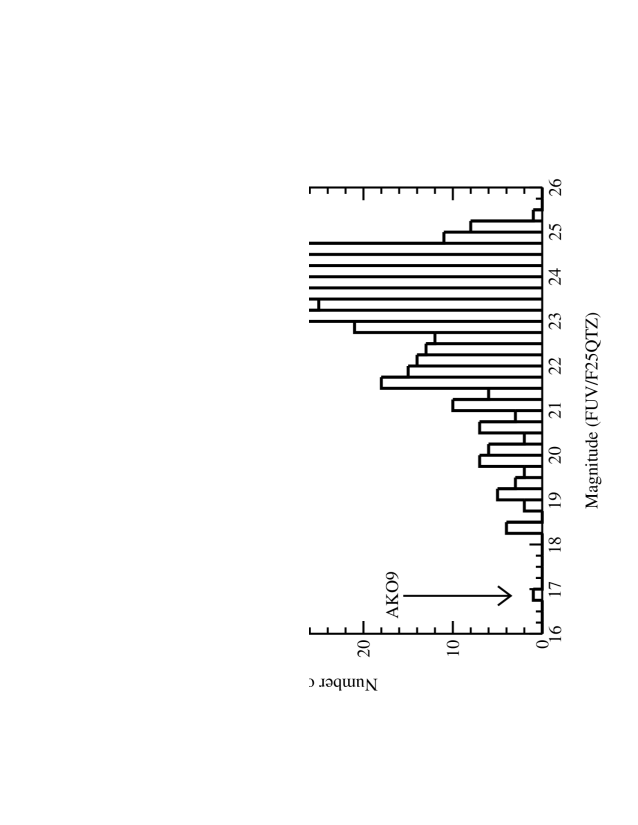
Figure 5 shows a first FUV-optical color-magnitude diagram (CMD) we have constructed from our data. Given the large number of sources in the optical images, it is not trivial to match FUV sources with optical counterparts. As a result, the preliminary CMD in Figure 5 only includes the 50 or so objects for which this was relatively straightforward. Note that this explains the lack of sources on or close to the WD sequence in the CMD: optical counterparts for such optically faint objects are hard to find. We stress that this is a temporary state of affairs. Deep and well-resolved optical images of the cluster core are already available (Gilliland et al. 2000), so we fully expect to find optical counterparts for most or all of our FUV sources.
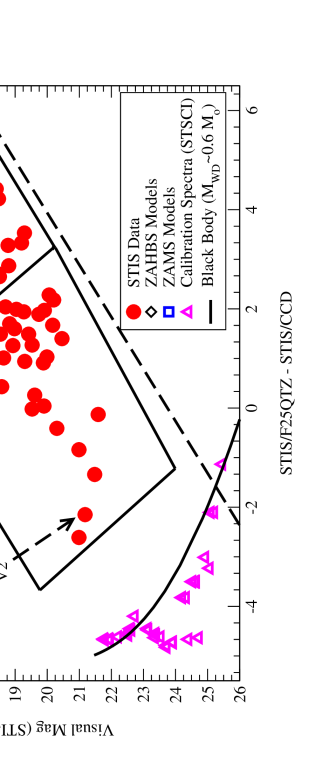
Luckily, the limited number of objects that have made it into Figure 5 are extremely interesting. The 20 or so stars closest to the MS extension are most probably blue stragglers (BSs), i.e. the rejuvenated products of stellar collisions or mergers (Livio 1993). The existence of a BS population in the core of 47 Tuc is well established (Paresce et al. 1991), but our program will be the first to provide FUV spectra for a representative sample of BSs.
The remaining 30 or so objects in Figure 5 are even more interesting. They are not part of either the WD sequence or the extended MS, and instead occupy a region squarely between the two. This is precisely the area of the CMD that should be populated by CVs. After all, CVs contain both a UV bright, accreting WD and an optically bright MS companion. If this identification is correct, then we have finally discovered the large population of faint GC CVs whose existence is predicted by tidal capture theory.
It is reassuring that the only confirmed CV in 47 Tuc, the DN V2 (Shara et al. 1996), is among the CV candidates in our FUV-optical CMD. However, it is also interesting to note that V2 and AKO 9 (see Section 3.2) are the only two FUV sources detected so far that exhibit obvious emission lines in the FUV spectral image (Figure 3). Is it possible that this is just a selection effect, i.e. are most of our CV candidates simply to faint to reveal their emission lines in Figure 3? Or does it mean the remaining sources are not, in fact, CVs at all? Or perhaps GC CVs are different from field CVs in presenting much weaker lines, perhaps due to the lower metallicity in the cluster environment?
Clearly, much work is still needed to verify our potential discovery of a large CV population in 47 Tuc. However, all of it can be done with available data. First, it is important to identify all CV candidates in our FUV images, not just the optically brightest ones. This simply means that we need to push both the FUV and optical photometry deeper and carefully match the two. Second, we need to search for time variability among the CV candidates. As noted above, once all of our HST visits have been analyzed, we will be able to look for variability on a wide range of time scales, from tens of minutes (flickering) to hours (orbital variations) to months (DN eruptions). Third, we obviously still need to extract the spectra of the FUV sources from our slitless spectral images. The immense value of these spectra is best illustrated by an example, so we now turn our attention to the brightest FUV source in our data, AKO 9.
3.2. New Light on AKO 9
The nature of AKO 9 has been a long-standing puzzle: it is known to be a eclipsing binary with an orbital period of about one day (Edmonds et al. 1996); it has been suggested (Aurière, Koch-Miramond & Ortolani 1989; Geffert, Aurière & Koch-Miramond 1997) and refuted (Verbunt & Hasinger 1998) as the counterpart of a known x-ray source in the cluster; it is clearly UV-bright (Aurière, Koch-Miramond & Ortolani 1989; this paper); and it exhibits optical high and low states separated by approximately 2-3 mag (Minniti et al. 1997). All of these clues have yet to be assembled into a convincing interpretation.
We begin our new look at AKO 9 by considering what can be learned from the available optical data. Figure 6 shows the phase-folded V- and I-band light curves of the system, as extracted from Gilliland et al.’s (2000) observations of 47 Tuc. Two important features are evident: (i) a weak primary eclipse is clearly present in the V-band, but is barely noticeable in the I-band; (ii) both optical light curves are double-humped.
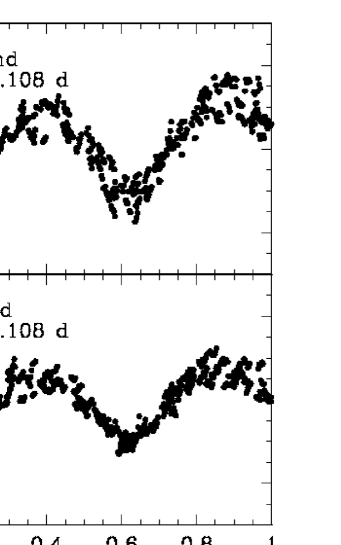
The decreasing depth of primary eclipse with increasing wavelength indicates that the spectrum of the primary is much bluer than that of the secondary. In fact, a look at AKO 9’s U-band light curve (Figure 6 in Edmonds et al. 1996) shows that at this wavelength the primary eclipse is at least 1 mag deep. We can therefore conclude that the secondary dominates at both V and I, whereas the primary dominates at U. The double-humped light curve shapes are most easily interpreted as ellipsoidal variations caused by the distorted shape of a Roche-lobe-filling secondary. They therefore strongly support the idea that AKO 9 is an interacting binary system.
The amplitude of ellipsoidal variations depends on mass ratio () and inclination () and can be used to constrain these parameters. In AKO 9, a second constraint comes from the presence of primary eclipses. In a system containing a Roche-lobe-filling secondary, the size of the secondary relative to the binary separation, , is only a function of . We can therefore set a lower limit on inclination as a function of mass ratio, . Figure 7 shows the allowed parameter space for AKO 9 in the plane. Overall, the limits are and .

The ellipsoidal variations also imply that the secondary star cannot be on the MS. Combining Kepler’s law, Eggleton’s (1983) approximation for the Roche-lobe radius and AKO 9’s orbital period, we find that for any reasonable MS mass-radius relation, the mass and radius of a lobe-filling MS star would have to be over 3 times solar, regardless of the mass ratio of the system. Such a star should have evolved off the cluster MS long ago (the MS turn-off occurs at about in 47 Tuc; Hesser et al. 1987). The donor star must therefore be an evolved object. This is consistent with AKO 9’s V-band magnitude, which corresponds to the sub-giant branch of the cluster (Hesser et al. 1987).
All of this suggests that mass transfer in AKO 9 has started relatively recently, as a direct consequence of the nuclear evolution of the secondary. More specifically, mass transfer was probably initiated when the radius of the donor star caught up with the Roche lobe during the donor’s evolution from the MS to the RGB via the sub-giant branch. If this scenario is correct, the mass of AKO 9’s secondary must still be roughly that of an isolated star on 47 Tuc’s sub-giant branch, i.e. (Hesser et al. 1987). We can combine this with the upper limit on the mass ratio to obtain a lower limit of for the mass of the primary.
We now turn our attention to the appearance of AKO 9 in our FUV data. Figure 8 shows two cropped FUV images of the vicinity of AKO 9. Both images were taken during the 1999 pilot visit, the first near the beginning, the second near the end (about 7 hrs later). It is immediately obvious that AKO 9 faded dramatically over the course of this visit. We initially thought that we might have caught the system on the decline from one of its bright states, but the correct explanation turns out to be more mundane. Figure 9 shows AKO 9’s light curve over the course of the visit, as derived from our FUV spectroscopy (this provides much better time resolution than the FUV photometry). The light curve shape clearly suggests that our observations coincided with the ingress into primary eclipse. The timing of the observed fading is consistent with this interpretation: it agrees very well with the time of eclipse predicted by a rough orbital ephemeris we were able to derive from Gilliland et al.’s (2000) optical data.
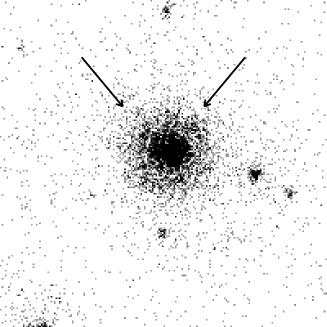
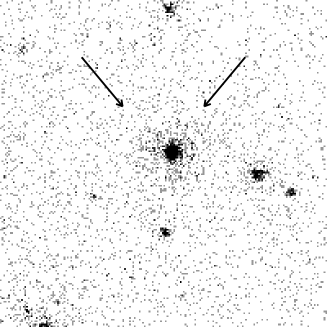
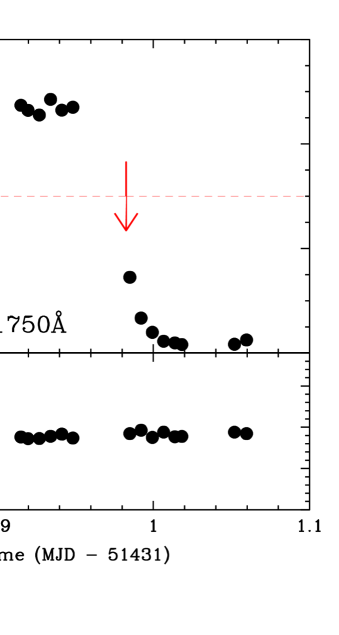
Figure 10 shows the FUV spectrum of AKO 9 and illustrates its evolution through the eclipse. The spectra in Figure 10 are based on somewhat preliminary, quick-and-dirty extractions from our slitless spectral images, but their overall spectral shapes and strong features should be reliable. The pre-eclipse spectrum is very blue, with strong C iv and He ii emission lines. A power law fit to the dereddened continuum () yields a spectral index of . Extrapolating this fit to the U-band predicts . This is approximately mag fainter than the U-band magnitude of AKO 9 in its normal, low state. The power law extrapolation should not be taken too seriously, but it is interesting to note that is reasonably consistent with the presence of 1-mag U-band eclipses. More specifically, if the U-band light at mid-eclipse is completely due to the secondary, the primary should be approximately mag fainter than the total out-of-eclipse U-band magnitude.
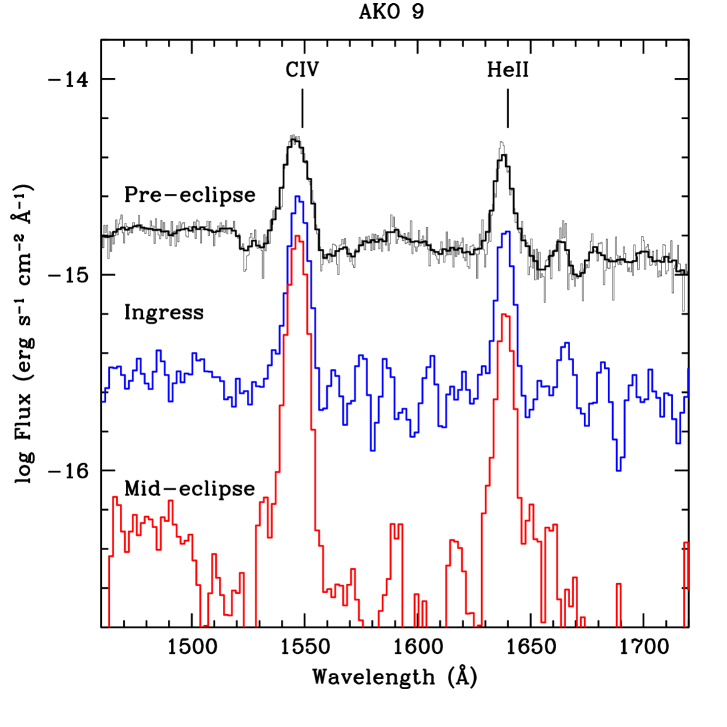
The pre-eclipse FUV spectrum of AKO 9 looks remarkably like that of certain CVs. This similarity extends to the fact that the strong spectral lines are much more weakly eclipsed than the continuum. This effect is common among field CVs and is generally ascribed to line formation taking place in a vertically extended region, such as an accretion disk wind (e.g. Knigge & Drew 1997). AKO 9’s 1.1 d orbital period is, of course, rather long for a CV. It is therefore important to compare its properties specifically to those of long-period field CVs. Such a comparison is shown in Figure 11, where AKO 9’s FUV spectrum is compared to that of the well-known, long-period CV GK Per. The similarity between the two spectra is obvious.
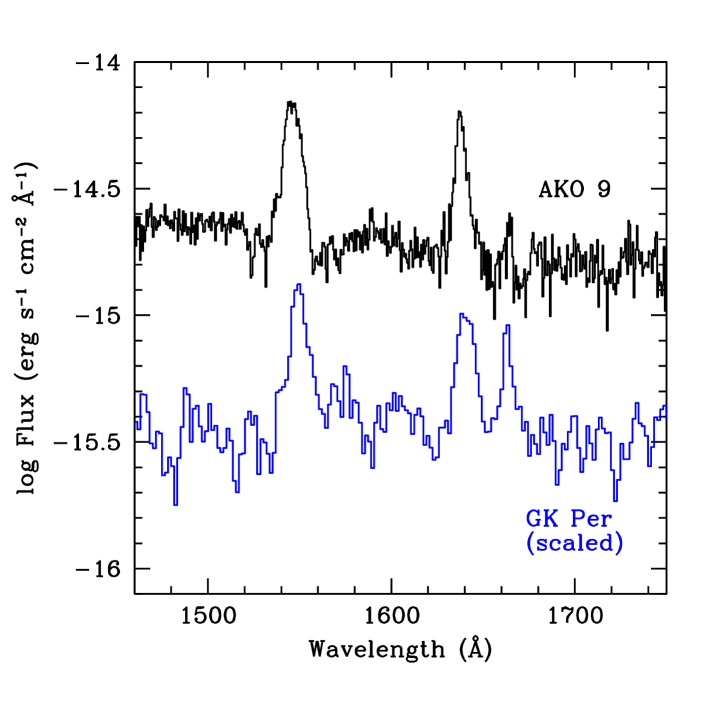
GK Per is thought to be an intermediate polar, in which a magnetic WD accretes from an evolved sub-giant companion via a magnetically truncated accretion disk. Its orbital period is approximately 2 days, and it is known to undergo DN eruptions. If the similarities between GK Per and AKO 9 extend to CV sub-type, AKO 9’s occasional high states probably represent DN outbursts. Minniti et al. (1997) inferred a roughly 1 hr rise time for the low-state-to-high-state transition from a rapid brightening of the system in their U-band HST observations. This would seem to argue against a DN interpretation, since the rise times of DN eruptions are generally much longer. However, we suspect that the brightening observed by Minniti et al. was not a true low-state-to-high-state transition, but instead an egress from eclipse at a time when AKO 9 was already in a high state. Minniti et al. apparently discarded this possibility because the brightness increase they observed was in excess of 2 mags – considerably larger than the 1 mag eclipse depth seen in the low state. However, if high states are caused by increases in accretion luminosity, the fractional contribution of the accreting primary to the total light will be much larger in the high state than in the low state. The primary eclipse should therefore be expected to be much deeper in the high state.
Considering all of the available evidence, it seems very likely that AKO 9 is a DN-type CV in which mass transfer is driven by the nuclear evolution of a sub-giant donor star. As we have shown, all of AKO 9’s observational characteristics can find a natural interpretation within this framework. We therefore consider AKO 9 to be the first new, spectroscopically confirmed GC CV to come out of our survey. Given the results presented in the previous section, many more may follow.
4. Summary and Conclusions
We have presented first results from a FUV spectroscopic and photometric survey of the GC 47 Tuc. Standard tidal capture theory predicts that well over 100 faint CVs should presently reside in 47 Tuc (di Stefano & Rappaport 1994). Our main goal is to either confirm or rule out the existence of such a large CV population in the cluster core.
We have so far analyzed only a fraction of the data, but have already detected approximately 425 FUV sources. Most of these are probably hot, young WDs, but we have also identified approximately 30 FUV sources whose position in the FUV-optical CMD makes them strong CV candidates. If most of these objects are confirmed to be CVs by a careful analysis of the full data set, tidal capture theory will have been vindicated.
Our observations have also allowed us to resolve the long-standing puzzle surrounding AKO 9, a UV-bright and highly variable 1.1 day binary system in 47 Tuc. AKO 9 is the brightest FUV source in our data, and presents a blue FUV spectrum with strong C iv and He ii emission lines. Its spectrum is strikingly similar to that of the long-period DN-type CV GK Per. Based on this similarity and other evidence, we suggest that AKO 9 is a long-period CV in which mass-transfer is driven by the nuclear evolution of a sub-giant donor star.
References
Aurière, M, Koch-Miramond, L., & Ortolani, S 1989, A&A, 214, 113
Bochkarev, N. G., Karitskaya, E. A., & Shakura, N. I. 1979, Soviet Ast., 23, 8
Diaz-Cordovés, J., Claret, A., & Giménez, A. 1995, A&AS, 1995, 110, 329
Di Stefano, R., & Rappaport, S. 1994, ApJ, 423, 274
Dorman, B. 1992, ApJS, 81, 221
Edmonds, P. D., Gilliland, R. L., Guhathakurta, P., Petro, L. D., Saha, A., & Shara, M. M. 1996, ApJ, 468, 241
Eggleton, P. P. 1983, ApJ, 268, 368
Fabian, A. C., Pringle, J. E., & Rees, M. J. 1975, MNRAS, 172, L15
Geffert, M., Aurière, M., & Koch-Miramond, L. 1997, A&A, 327, 137
Gilliland, R. L., Edmonds, P. D., Guhathakurta, P., Petro, L. D., Saha, A., & Shara, M. M. 1995, ApJ, 447, 191
Gilliland, R. L. et al. 2000, ApJ, 544, L00
Guhathakurta, P., Yanny, B., Schneider, D. P., & Bahcall, J. N. 1992, AJ,104, 1790
Hasinger, G., Johnston, H. M., & Verbunt, F. 1994, A&A, 288, 466
Hesser, J. E., Harris, W. E., & Vandenberg, D. A. 1987, PASP, 99, 1148
Hills, J. G., & Day, C. A. 1976, Ap. Letters, 17, 87
Hut, P., McMillan, S., Goodman, J., Mateo, M., Phinney, E. S., Pryor, C., Richer, H. B., Verbunt, F., & Weinberg, M. 1992, PASP, 104, 981
Katz, J. I. 1975, Nature, 253, 698
Knigge, C., & Drew, J. E. 1997, ApJ, 486 445
Livio, M. 1993, in ASP Conf. Ser., 42, Blue Stragglers, ed. R. E. Saffer (San Francisco: ASP), 3
Minniti, D., Meylan, G., Pryor, C., Phinney, E. S., Sams, B., & Tinney, C. G. 1997, ApJ, 474, L27
Paresce, F., Meylan, G., Shara, M. M., Baxter, D., & Greenfield, P. 1991, Nature, 352, 297
Richer, H. B., Fahlman, G. G., Ibata, R. A., Pryor, C., Bell, R. A., Bolte, M., Bond, H. E., Harris, W. E., Hesser, J. E., Holland, S., Ivanans, N., Mandushev, G., Stetson, P. B., & Wood, M. A. 1997, ApJ, 484, 741
Shara, M. M., Bergeron, L. E., Gilliland, R. L., Saha, A., & Petro, L. 1996 ApJ, 471, 804
Verbunt, F., & Hasinger, G. 998, A&A, 336, 895
Wood, M. A. 1995, in Lecture Notes in Physics, 443, White Dwarfs, ed. D. Koester & K. Werner (Berlin: Springer), 41