Discovery of a very X-ray luminous galaxy cluster at in the WARPS survey
Abstract
We report the discovery of the galaxy cluster ClJ1226.9+3332 in the Wide Angle ROSAT Pointed Survey (WARPS). At and h erg s-1 ( keV) ClJ1226.9+3332 is the most distant X-ray luminous cluster currently known. The mere existence of this system represents a huge problem for world models.
At the modest (off-axis) resolution of the ROSAT PSPC observation in which the system was detected, ClJ1226.9+3332 appears relaxed; an off-axis HRI observation confirms this impression and rules out significant contamination from point sources. However, in moderately deep optical images (R and I band) the cluster exhibits signs of substructure in its apparent galaxy distribution. A first crude estimate of the velocity dispersion of the cluster galaxies based on six redshifts yields a high value of 1650 km s-1, indicative of a very massive cluster and/or the presence of substructure along the line of sight. While a more accurate assessment of the dynamical state of this system requires much better data at both optical and X-ray wavelengths, the high mass of the cluster has already been unambiguously confirmed by a very strong detection of the Sunyaev-Zel’dovich effect in its direction (Joy et al. 2001).
Using ClJ1226.9+3332 and ClJ0152.7–1357 (), the second-most distant X-ray luminous cluster currently known and also a WARPS discovery, we obtain a first estimate of the cluster X-ray luminosity function at and h erg s-1 ( keV). Using the best currently available data, we find the comoving space density of very distant, massive clusters to be in excellent agreement with the value measured locally (), and conclude that negative evolution is not required at these luminosities out to . Our findings are in conflict with earlier claims of highly significant () negative evolution already at based on the cluster samples of the EMSS and the CfA 160 degree survey. Our results agree, however, with the lack of significant evolution of very X-ray luminous clusters out to reported by the MACS team. Our findings are also consistent with the abundance of very X-ray luminous clusters at inferred from the EMSS cluster sample, provided ClJ0152.7–1357 (which was missed by the EMSS) is added in.
Subject headings:
galaxies: clusters: general — galaxies: clusters: individual (ClJ1226.9+3332, ClJ0152.7–1357) — cosmology: observations — X-rays: general1. Introduction
Measurements of the abundance of clusters of galaxies as a function of redshift allow a number of physical and cosmological parameters of structure formation models to be constrained (e.g. Oukbir & Blanchard, 1997; Eke et al., 1998). The tightest constraints are obtained from observations of the most massive and most distant clusters which are extremely rare in all models of cluster formation. For instance, the predicted space density of galaxy clusters with intra-cluster gas temperatures of about K (k keV) at is two orders of magnitudes higher in an open universe with than in a flat universe with (Viana & Liddle, 1996).
Among the many efforts to compile statistically relevant samples of these rare systems, X-ray flux limited surveys carry particular appeal. Galaxy clusters are bright X-ray sources that can be detected out to high redshift. Moreover, X-ray emission from clusters originates from gas trapped and heated in deep gravitational potential wells. X-ray surveys thus naturally select three-dimensionally bound systems and are almost unaffected by projection effects. Finally, X-ray flux limited surveys greatly facilitate the measurement of comoving space densities since effective search volumes are easily computable from the surveys’ selection functions which are usually a simple function of X-ray flux and, for distant clusters, almost independent of X-ray source extent.
While one would ideally want to study clusters that are both distant and massive, the rarity of these objects currently forces the observer to give priority to one of the two qualifiers. Previous and ongoing cluster surveys have thus adopted either of two fundamentally different, but complementary, approaches. For instance, very deep X-ray and optical surveys covering only small areas of sky have become increasingly successful at finding poor clusters at (Rosati et al., 1999; Lubin et al., 2000) while, at the other extreme, relatively shallow X-ray surveys covering very large solid angles (Ebeling, Edge & Henry, 2001) are in the process of producing large samples of very massive systems at lower redshift ().
2. The Wide Angle ROSAT Pointed Survey
The Wide Angle ROSAT Pointed Survey (WARPS) is one of a few surveys straddling the dividing line between the two strategies outlined in the previous section. Following the approach pioneered by the EINSTEIN Extended Medium Sensitivity Survey (EMSS, Gioia et al., 1990; Stocke et al., 1991), WARPS searches for distant clusters among a large number of X-ray sources serendipitously detected in pointed ROSAT PSPC observations. The WARPS strategy, as well as earlier results, have been discussed in previous papers (Scharf et al., 1997; Jones et al., 1998; Ebeling et al., 2000; Fairley et al., 2000).
3. Discovery of ClJ1226.9+3332
ClJ1226.9+3332 was detected in the WARPS survey as an extended X-ray source 14.5 arcminutes off axis in the ROSAT PSPC observation of NGC 4395, a nearby, low-luminosity Sy1 galaxy (RP600277N00, on-axis exposure time 9036s). The significance of detection exceeds 10 in a 2 arcmin (radius) aperture. The source is also detected at more than 5 significance (within an aperture of 1’ radius and at an off-axis angle in 14.1’) in a ROSAT HRI observation of the same target (RH702725N00, on-axis exposure time 11,353s).
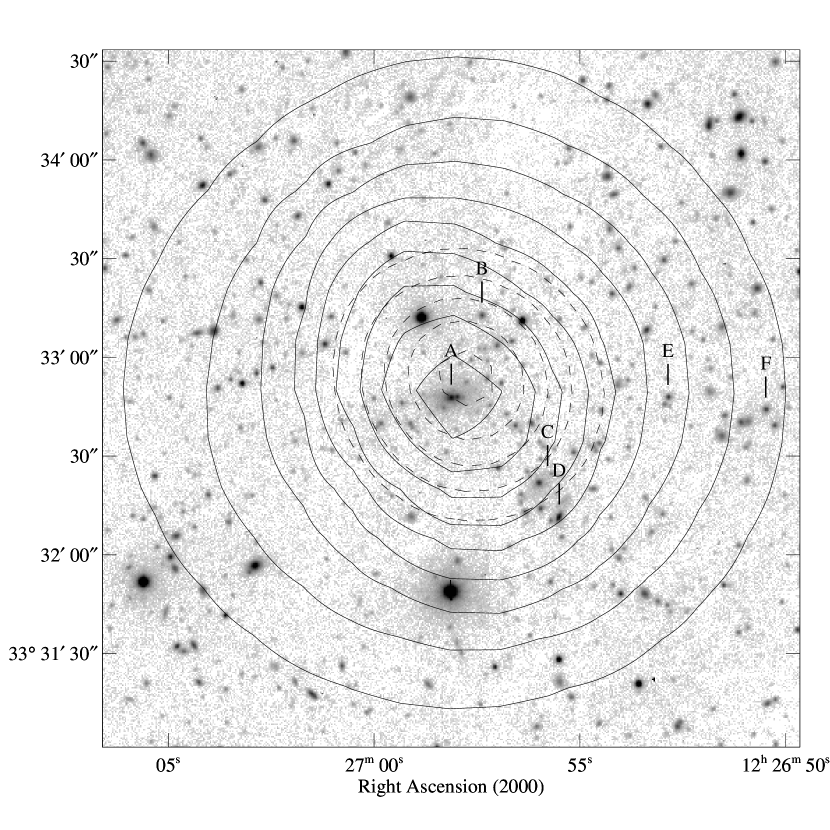
Figure 1 shows an I band image of the source with adaptively smoothed X-ray contours from the ROSAT PSPC and HRI observations overlaid. The emission is well centered on an apparent overdensity of faint galaxies.
3.1. X-ray observations
The net PSPC count rate directly detected by the VTP algorithm (Ebeling & Wiedenmann, 1993; see also Scharf et al. 1997 for details of how WARPS employs this detection algorithm) is ct s-1 in PHA channels 50 to 200. The exposure time at the location of the source (, J2000) is 7.9 ks. Assuming a beta model (Cavaliere & Fusco-Femiano, 1976) with and core radius kpc, derived from the distribution of the immediately detected photons (see Scharf et al. 1997 for details), and taking into account the effects of the PSPC off-axis point-spread function (PSF) we extrapolate to a total source count rate of ct s-1. Using the Galactic value of cm-2 for the equivalent column density of neutral hydrogen in the direction of the source (Dickey & Lockman, 1990), a metallicity of 0.3, and a gas temperature of keV (see below) we convert the total PSPC count rate into a total X-ray flux in the 0.5–2.0 keV band of erg s-1 cm-2.
Following the same procedure for the HRI data, we find an exposure time of 10.2 ks at the location of the source (, J2000). This source centroid agrees to within 4.2” (less than the typical ROSAT astrometry error) with the one determined from the PSPC data. The extrapolated total cluster count rate is measured to be ct s-1. We use the same assumptions as before to convert this count rate to a total X-ray flux of erg s-1 cm-2 (0.5–2.0 keV), a value that is in good agreement with the PSPC measurement. Although the HRI image shows no obvious point sources within three arcminutes of the source (see Fig. 1) we cannot strictly rule out the possibility that some or all of the observed X-ray flux originates from a concentration of individually faint point sources.
3.2. Optical observations
We obtained redshifts of 11 objects close to the apparent cluster core shown in Fig. 1 using the LRIS spectrograph (Oke et al. 1995) on the Keck-II 10m telescope. Both apparent cluster members and possible X-ray contaminants (blue galaxies and stars) were targeted. Combining the results of a longslit observation carried out in January 1999 (300/5000 grism, dispersion 2.6Å/pixel, slitwidth 1.5 arcsec, wavelength range 5000–10000Å) with those of multi-object spectroscopy performed in January 2000 (600/7500 grism, dispersion 1.3Å/pixel, slitwidth 1.5 arcsec, wavelength range typically 6200–8700Å) we find no obvious contaminants (broad line emitters) but six galaxies with accordant redshifts around a (heliocentric) mean of . The six spectroscopically confirmed cluster members are marked in Fig. 1; their positions and redshifts are listed in Table 1. The position of the brightest cluster galaxy (labeled A in Table 1) coincides within 2” (6”) with the X-ray emission centroid as determined from the PSPC (HRI) observations discussed in Section 3.1, supporting our identification of this source as a distant cluster of galaxies.
4. Intrinsic properties of ClJ1226.9+3332
From the six redshifts measured by us so far (see Table 1) we obtain a very crude first estimate of the cluster galaxy velocity dispersion of km/s. If confirmed in future observations, this very high value suggests a very massive cluster and/or substructure along the line of sight.
Assuming a mean cluster redshift of we derive a total X-ray luminosity of h erg s-1 ( keV, is assumed throughout this Letter) from the total cluster flux as determined from the PSPC observation, corresponding to an estimated gas temperature of 11.7 keV based on the relation of White, Jones & Forman (1997). The inferred bolometric luminosity of this sytem is h erg s-1 (we assume an uncertainty of keV in the estimated value), making ClJ1226.9+3332 more X-ray luminous than any other cluster currently known at . The cluster’s estimated X-ray temperature is consistent with its high velocity dispersion (Mushotzky & Scharf, 1997).
While the X-ray and optical properties of ClJ1226.9+3332 described above strongly suggest the presence of a highly massive cluster, the limited depth of the existing X-ray and optical data does not allow us to rule out contamination from a multitude of X-ray faint point sources and/or from projection effects. Unambiguous evidence of the high mass of this system was, however, obtained recently in the form of the detection of a very strong Sunyaev-Zeldovich Effect (SZE) decrement centered on the X-ray position reported here. The SZE measurements were obtained interferometrically at the Berkeley-Illinois-Maryland Array (BIMA) at a frequency of 28.5 GHz, and are reported by Joy et al. (2001). The BIMA observations confirm the presence of a deep gravitational potential well and lead to an estimate for the total gravitational mass of ClJ1226.9+3332 that is similar to, and possibly higher than that of the well studied, massive cluster MS 1054.4-0321 at (Hoekstra, Franx & Kuijken 2000, and references therein).
5. The effective depth of serendipitous X-ray cluster surveys
All serendipitous X-ray cluster surveys past and present, from the EMSS to the ROSAT Deep Cluster Survey (RDCS, Rosati et al., 1998), probe deep enough to detect very X-ray luminous clusters ( h erg s-1 , 0.5–2.0 keV) out to redshifts . WARPS, for instance, would have detected ClJ1226.9+3332 over the full geometric solid angle covered (72.0 deg2) out to a maximal redshift of .
Although formally correct, such maximal detection redshifts are misleading. WARPS, like all other serendipitous cluster surveys conducted to date (with the notable exception of the RDCS), performed its imaging follow-up observations exclusively in the optical R and I bands. For clusters at , R and I correspond to B or even U in the cluster rest frame and are thus very inefficient bands for the detection of distant cluster ellipticals. Indeed, and not surprisingly, WARPS111as well as all other cluster surveys relying exclusively on imaging observations in the optical passband for cluster identifications failed to detect any cluster at . We thus argue that the limitations of the optical imaging observations impose a more stringent constraint of .
Imaging of X-ray selected cluster candidates at near-infrared wavelengths (as conducted by the RDCS team) allows the identification of clusters beyond (Rosati et al., 1999). However, instrumental limitations still impose a redshift limit of as, at , the most important absorption features (the Ca H and K doublet) are redshifted to observed wavelengths redward of 9,500 Å where the efficiency of even the most powerful present-day spectrograph (LRIS on the Keck 10m telescope) is less than 5 per cent. Consequently even the currently deepest X-ray cluster survey, the RDCS, has yet to spectroscopically confirm a cluster at .
6. The evolution of the most massive clusters of galaxies out to
We attempt to constrain the evolution of the X-ray cluster luminosity function (XLF) at the highest redshifts and highest luminosities using the small, but statistically complete WARPS sample defined by the selection criteria and h erg s-1 ( keV). The only two WARPS clusters meeting these criteria, ClJ0152.7–1357 (Della Ceca et al., 2000; Ebeling et al., 2000) and ClJ1226.9+3332, are the most X-ray luminous distant clusters currently known222A discussion of the WARPS XLF of less luminous systems at will be presented elsewhere.. Both ClJ0152.7–1357 (which was missed by the EMSS, Ebeling et al., 2000) and ClJ1226.9+3332 feature X-ray fluxes well above the WARPS flux limit and would have been detected out to maximal redshifts of and , respectively. However, for the reasons described in the previous section, we use a lower maximal redshift of when computing the WARPS search volumes.
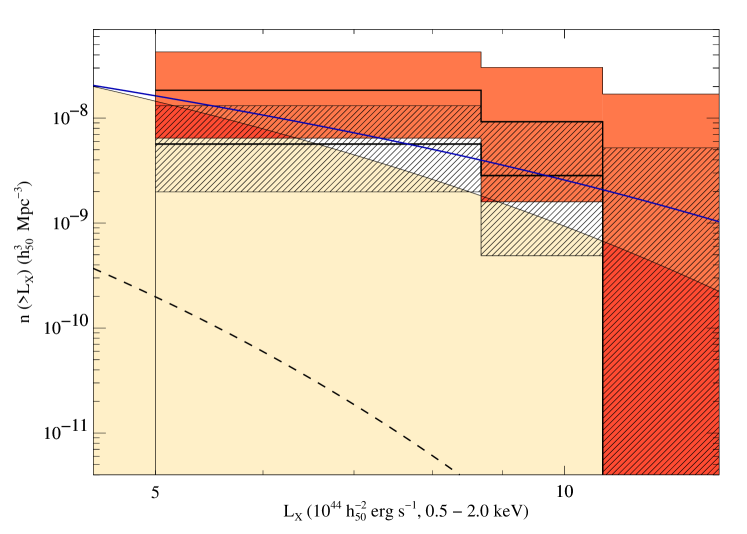
The resulting cumulative WARPS X-ray luminosity function of very X-ray luminous ( h erg s-1 , keV) and very distant () clusters is shown in Figure 2. Standard errors (in the Poisson limit, Gehrels 1986) are indicated by the dark, shaded region. We also compute an alternative version of the XLF, using the very generous assumption of (shown by the hatched region in Fig. 2). The currently best determination of the local () cluster XLF from the ROSAT Brightest Cluster Sample (Ebeling et al., 1997) is shown by the thick, solid line. We find both WARPS XLF estimates to be in very good agreement with the local measurement. Since the search volumes of WARPS and EMSS for clusters with h erg s-1 ( keV) at are very similar (about h Mpc3) our measurement is also in good agreement with the XLF inferred from the two X-ray luminous EMSS clusters in this redshift interval, MS1054–0321 () and ClJ0152.7–1357 (originally missed by the EMSS).
Also shown in Fig. 2 is the prediction of the XLF evolution model derived by Rosati et al. (2000) from a fit to the RDCS data, together with its errror range. At this model lies between a factor of 100 and a factor of 1000 below the WARPS XLF measurement. While our data thus do not support the RDCS model, they cannot strictly rule it out either because of the large uncertainties in the model parameters. We note though that at h erg s-1 ( keV) the observed WARPS XLF for very X-ray luminous clusters at is inconsistent with the RDCS prediction at greater than significance.
7. Conclusions
The discovery of ClJ1226.9+3332, the most X-ray luminous distant cluster currently known, adds to the growing evidence in favour of an early period of cluster formation at redshifts with little evolution in the cluster abundance ever since.
While the small size of the WARPS subsample discussed here does not allow us to firmly rule out negative or positive evolution at , we stress that our data certainly do not require a change in the abundance of very X-ray luminous clusters out to the highest redshifts probed by current surveys. Specifically, we do not find a decrease in the comoving cluster abundance by a factor of more than 100 (at compared to the local value) as predicted by the best-fitting XLF model derived from RDCS data (Rosati et al., 2000).
The lack of significant evolution observed by us at the highest redshifts and highest X-ray luminosities is consistent with the EMSS results at if the known incompleteness of the EMSS at these redshifts is corrected for. Our findings also agree with preliminary results from the MAssive Cluster Survey (MACS, Ebeling, Edge & Henry, 2000) which, boasting greatly improved statistics, finds only very mild negative evolution in a measurement of the XLF of similarly X-ray luminous clusters at .
Unless cluster evolution is a non-monotonic function of redshift and/or X-ray luminosity, our results are in conflict with earlier claims of highly significant () negative evolution at lower redshifts () and lower luminosities ( h erg s-1 , keV) based on the cluster samples compiled in the EMSS (Gioia et al., 1990) and the CfA 160 deg survey (Vikhlinin et al., 1998a).
Larger, well defined samples of massive clusters at intermediate and high redshift as well as spatially resolved cluster temperatures are needed to actually measure the rate of evolution and to place meaningful constraints on the cosmological parameters governing structure formation.
References
- (1) Cavaliere, A. & Fusco-Femiano, R. 1976, A&A, 49, 137
- (2) Della Ceca R., Scaramella R., Gioia I.M., Rosati P., Fiore F., Squires G. 2000, A&A, 353, 498
- (3) Dickey, J.M. & Lockman, F.J. 1990, Ann. Rev. Astron. Astroph., 28, 215
- (4) Ebeling H., Edge A.C., Fabian A.C., Allen S.W., Crawford C.S., Böhringer H. 1997, ApJ, 479, L101
- (5) Ebeling H., Edge A.C. & Henry J.P. 2000, in Large-Scale Structure in the X-ray Universe, eds Plionis & Kolokotronis, Atlantisciences, p39
- (6) Ebeling H., Edge A.C. & Henry J.P. 2001, ApJ, submitted
- (7) Ebeling H. et al. 2000, ApJ, 534, 133
- (8) Fairley B.W., Jones L.R., Scharf C., Ebeling H., Perlman E., Horner D., Wegner G., Malkan M. 2000, MNRAS, 318, 333
- (9) Gehrels N. 1986, ApJ, 303, 336
- (10) Gioia I.M., Maccacaro T., Schild R.E., Wolter A., Stocke J.T., Morris S.L., Henry J.P. 1990, ApJS, 72, 567
- (11) Gioia I.M., Henry J.P., Maccacaro T., Morris S.L., Stocke J.T., Wolter A. 1990, ApJ, 356, L35
- (12) Hoekstra, H., Franx, M., Kuijken, K. 2000, ApJ, 532, 88
- (13) Jones L.R., Scharf C., Ebeling H., Perlman E., Wegner G., Malkan M., Horner D. 1998, ApJ, 495, 100
- (14) Joy M. et al. 2001, ApJL, submitted, astro-ph/0012052
- (15) Lubin L.M. Brunner R., Metzger M.R., Postman M., Oke J.B. 2000, ApJ, 531, L5
- (16) Mushotzky R.F. & Scharf C.A. 1997, ApJ, 482, L13
- (17) Oukbir J. & Blanchard A. 1997, A&A, 317, 10
- (18) Rosati P., Della Ceca R., Norman C., Giacconi R. 1998, ApJ, 492, L21
- (19) Rosati P., Stanford S.A., Eisenhardt P.R., Elston R., Spinrad H., Stern D., Dey A. 1999, AJ, 118, 76
- (20) Rosati P., Borgani S., Della Ceca R., Stanford S.A., Eisenhardt P.R., Lidman C. 2000, in Large-Scale Structure in the X-ray Universe, eds Plionis & Kolokotronis, Atlantisciences, p13
- (21) Scharf C.A., Jones L.R., Ebeling H., Perlman E., Malkan M., Wegner G. 1997, ApJ, 477, 79, Paper I
- (22) Stocke J.T., Morris S.L., Gioia I.M., Maccacaro T., Schild R., Wolter A. 1991, ApJS, 76, 813
- (23) Viana P.T.P. & Liddle A.R. 1996, MNRAS, 281, 323
- (24) Vikhlinin A., McNamara B.R., Forman W., Jones C., Quintana H., Hornstrup A., 1998a, ApJ, 498, L21
- (25) Vikhlinin A., McNamara B.R., Forman W., Jones C., Quintana H., Hornstrup A., 1998b, ApJ, 502, 558
- (26) White D.A., Jones C. & Forman W. 1997, MNRAS, 292, 419
| galaxy | R.A. (J2000) | Dec (J2000) | redshift |
|---|---|---|---|
| A | |||
| B | |||
| C | |||
| D | |||
| E | |||
| F |
Note. — The quoted positions are accurate to better than 1 arcsec. All redshifts were derived from spectra taken with LRIS on Keck-II. The quoted redshift errors are standard deviations from the quoted mean and are based on the observed wavelengths of individual spectral features.