STIS Ultraviolet Spectral Evidence for Outflows in Extreme Narrow-Line Seyfert 1 Galaxies
Abstract
I present and discuss the results of HST STIS observations of IRAS 132243809 and 1H 0707495, two narrow-line Seyfert 1 (NLS1) galaxies. We discovered that high-ionization UV emission lines are much broader and strongly blueshifted compared with the low-ionization and intermediate-ionization lines, which are relatively narrow and centered at the rest wavelength. We interpret this as evidence that the high-ionization lines come from a wind, while the low-ionization lines are emitted from the accretion disk or low-velocity base of the wind. The optically thick disk blocks our view of the receding wind.
We also found that not all NLS1s display strongly blueshifted emission lines, and the degree of asymmetry is inversely correlated with the equivalent width and correlated with the Si iii] to C iii] ratio, a density indicator. It may also be significant that these NLS1s display the extreme in the X-ray properties: they have the strongest X-ray soft-excess components and the highest-amplitude, flaring variability. We postulate that this combination of properties are all related to a high value of , even among NLS1s.
The high-ionization and low-ionization lines are nearly completely kinematically separated, a fact that allows us to study the conditions in the disk and wind separately. The ratios and equivalent widths of the emission lines produced in the wind, especially the comparative amounts of C iii], C iv, and the 1400 Å feature, are somewhat challenging to explain. To illustrate this, we consider the simple, but probably unrealistic, single-zone model in which the line-emitting gas sees the same continuum that we see. We find two solutions: one in which the gas is so dense that C iv is thermalized, and another in which the C iv is reduced because of a relatively higher optical depth in gas with a velocity gradient.
Columbia Astrophysics Laboratory, Columbia University, 550 W. 120th Street, New York, NY 10027; and Department of Physics and Astronomy, The University of Oklahoma, 440 W. Brooks St., Norman OK 73019
1. Introduction
Broad optical and UV emission lines are a nearly ubiquitous and identifying feature of active galactic nuclei (AGN) spectra. Yet despite more than thirty years of intensive study, many very basic properties are not well constrained or understood, including the geometry of the emission-line region, the origin of the inferred high velocities, and the physical conditions in the line-emitting gas.
Within the last five years it has become well-established that a subclass of AGN known as narrow-line Seyfert 1 (NLS1) galaxies exhibit a characteristic set of X-ray properties including high-amplitude and rapid X-ray variability, ultrasteep X-ray spectra, and often a strong soft-excess component (e.g., Leighly 1999a, b). These properties are interpreted as evidence that NLS1s are accreting at a higher fraction of the Eddington rate. Because all AGN are believed to be powered by a supermassive black hole, this result is fundamental.
This discovery represents the first identification of a direct link between the central engine and the kinematics of the emission-line region. Much of the new work done has focused on the influence of the inferred different SED that NLS1s have on the distance to the emission-line region (Wandel & Boller 1998) and the density in terms of an ionization instability (Kuraszkiewicz et al. 2000), or on the usual method of reverberation mapping. The detailed study of NLS1 emission line profiles has not yet been been performed. We show below that because of the peculiarities of some NLS1 profiles, this method may prove significantly more powerful than usually thought.
2. UV STIS Spectra of IRAS 132243809 and 1H 0707495
We observed the NLS1 galaxies IRAS 132243809 and 1H 0707495 using the HST STIS in June and February 1999, respectively. The spectra are shown in Fig. 1. The spectra are as blue as that of the average quasar (e.g., Leighly 2000; Leighly & Halpern 2000), and all of the absorption lines present in the spectra originate in our Galaxy. The spectra are practically identical to each other and strongly resemble that of the NLS1 I Zw 1 (Laor et al. 1997), indicating that these spectra represent not an isolated phenomenon but rather reflect characteristic behavior resulting from some set of physical conditions.
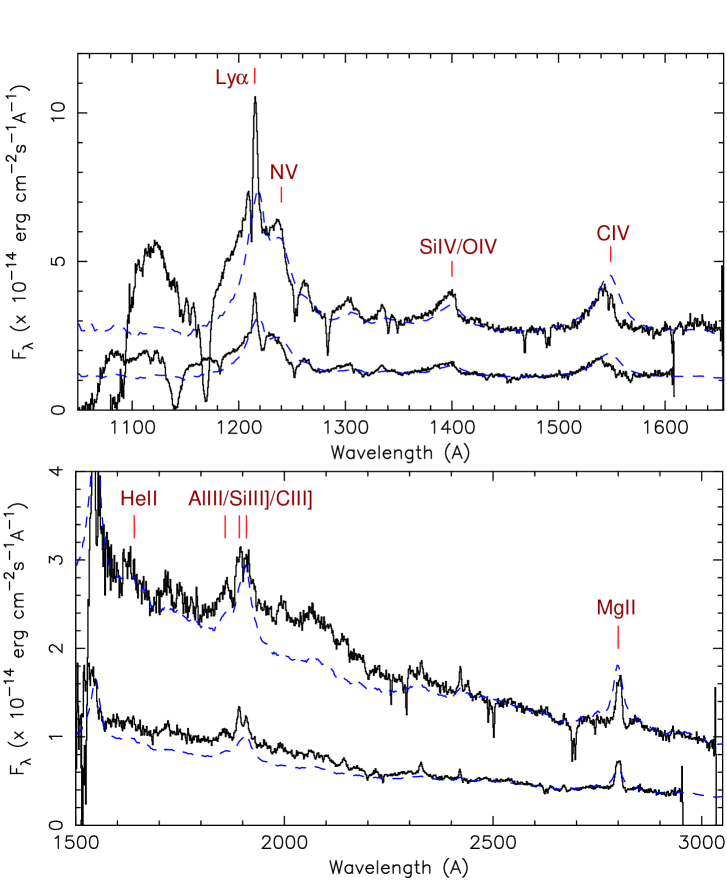
The most remarkable features of these spectra are the emission-line profiles. We find that the high-ionization lines, including C iv , Ly, N v , and the 1400 Å feature comprised of Si iv and O iv are much broader than the low-ionization and intermediate-ionization lines, including Mg ii , Al iii , 1863, Si iii] and C iii] (Fig. 2). The trend for the high-ionization lines to be broader than the low-ionization lines has been observed before, but these spectra represent an extreme of the phenomenon. The high-ionization lines are also strongly blueshifted with respect to the low-ionization lines. This trend has also been previously observed (e.g., Tytler & Fan 1992; Marziani et al. 1996), but these lines again represent the extreme.
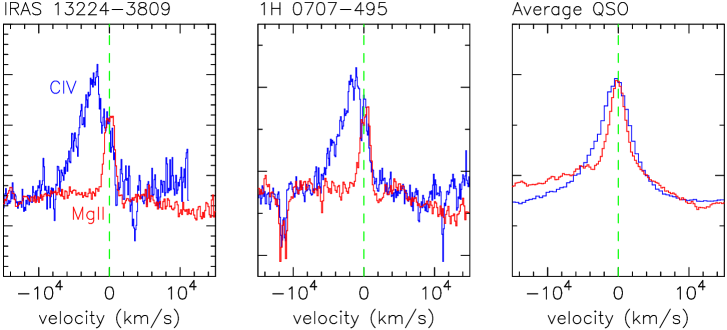
The most straightforward interpretation of this result is that the high-ionization lines are produced in a wind, perhaps accelerated by radiative line driving (e.g., Proga, Stone, & Kallman 2000), while the low-ionization lines are produced in the accretion disk or low-velocity base of the wind. The disk is optically thick, so the emission from the receding wind is not seen. Disk–wind models for AGN emission lines have been discussed previously (Collin-Souffrin et al. 1988); however, these spectra arguably provide one of the strongest pieces of evidence supporting this model and ruling out other models.
The X-ray properties of narrow-line Seyfert 1 galaxies, including their enhanced X-ray variability, have led to the interpretation that NLS1s have a smaller black-hole mass relative to their accretion rate (e.g., Leighly 1999a, b, and references therein). The fact that we find evidence for emission from high-velocity winds in NLS1s rather than in other AGN is intuitively sensible, since a relatively high-luminosity to black-hole mass ratio may very well produce a powerful wind. Many NLS1s have also been found to have very high Si iii] to C iii] ratios, an indication of high densities (e.g., Wills et al. 1999). High densities in the accretion disk may also be expected when the accretion rate is high.
Interestingly, however, not all NLS1s show these highly blueshifted high-ionization emission lines or high Si iii] to C iii] ratios. The high-ionization lines of some NLS1s, while broader than the respective low-ionization lines, are still relatively narrow and symmetric. We discovered that the C iv equivalent width is inversely correlated with the line asymmetry, as shown in Fig. 3111We note that this result cannot be attributed to a Baldwin effect, since our objects have a median luminosity compared with the sample of NLS1s with HST spectra.. We postulate that this result can be qualitatively explained if the high-ionization lines are considered to be approximately comprised of two components: one from the outflow and the other from the lower-velocity material at the base of the wind or from the accretion disk. The highly asymmetrical, low equivalent width emission lines are observed when only the wind component is seen and the emission lines are dominated by the wind. This may be because the wind is so thick that it blocks the more energetic photoionizing photons from reaching the low-velocity material at the base of the wind. The Si iii] to C iii] ratio is similarly correlated with the line asymmetry.
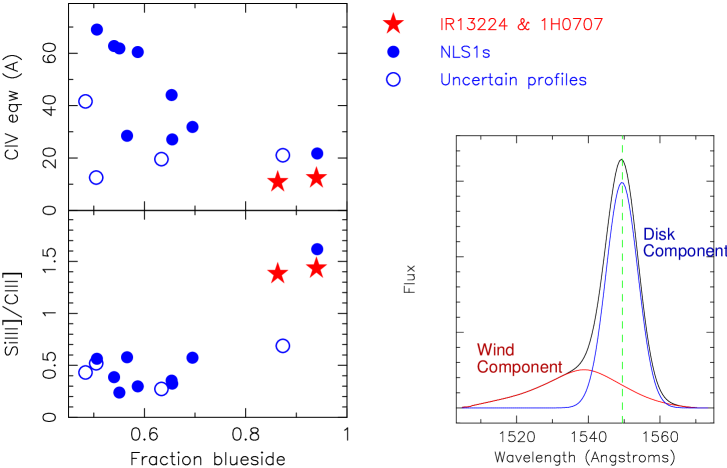
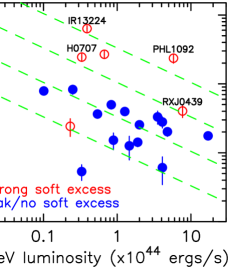
Why do IRAS 132243809 and 1H 0707495 show these extreme line profiles and other NLS1s do not? It is probably important that these two objects are not run-of-the-mill NLS1s with respect to their X-ray properties. IRAS 132243809 and 1H 0707495 fall at the extreme of the correlation between high amplitude X-ray variability and soft-excess strength observed in the ASCA sample of NLS1s (Leighly 1999a, b). They also have unusual features around 1 keV that have been interpreted as evidence for absorption in a high-velocity outflow (Leighly et al. 1997), although we note that no evidence for similar absorption was detected in the UV.
Based on these results, we are developing the following paradigm (Leighly & Halpern 2000): in concurrence with other investigators, we support the idea that all NLS1s have a higher ratio than do Seyfert 1 galaxies with broad optical lines. However, some NLS1s have a higher ratio than others. The objects that have the highest ratios are accreting close to the Eddington rate and suffer accretion instabilities, a condition manifesting itself in high-amplitude, flaring X-ray variability. It is in these objects that are close to the Eddington limit that we also observe high-ionization lines that are dominated by emission from the wind.
3. Photoionization Modeling
Analysis of the ultraviolet emission lines in IRAS 132243809 and 1H 0707495 promises great rewards. The high-ionization and low-ionization lines are nearly completely kinematically separated, so the conditions in the wind and disk222We do not know with certainty the geometrical and physical origin of the emission lines in the objects we are discussing here. However, for simplicity, we refer to the highly blueshifted high-ionization lines as originating in the “wind”, and the narrow, symmetric low-ionization lines as originating in the “disk”. These distinctions are somewhat similar to the HIL and LIL regions previously proposed (Collin-Souffrin et al. 1988), except that C iii] and other similar intermediate-ionization lines appear to be produced in the disk. can each be determined in principle. This kind of component analysis has also been discussed in Baldwin et al. 1996; our spectra may provide arguably better constraints because the kinematic separation is cleaner.
We first try to model the blueshifted high-ionization emission lines from the wind using one-zone models, although we acknowledge that such models almost certainly must be inadequate. We first assume that the emitting gas sees the same continuum that we do, although this may also be unrealistic, as discussed below. We find that the following observed properties place the most severe constraints on the models:
-
1.
The C iv equivalent width is low relative to other emission lines in these objects compared with other AGN.
-
2.
The 1400 Å feature is stronger in these objects compared with other AGN. This feature is most probably comprised of Si iv and O iv, and profile deconvolution indicates that much of it must come from the wind.
-
3.
There is no evidence for a broad, blueshifted component of C iii] or any other intermediate-ionization or low-ionization line. We nominally set the upper limit of the equivalent widths contribution to the wind from these lines to be 1 Å.
We find two scenarios that roughly fulfill these constraints; the details are discussed by Leighly & Halpern (2000). The first scenario assumes that the gas is very dense. In this case, the C iii] equivalent width is reduced as the C+2 ions become collisionally de-excited before emission occurs. If the gas is denser still, C iv becomes thermalized; C iv is the dominant coolant over a wide range of ionization parameters, so when it becomes thermalized, the cooling must shift to other emission lines such as Si iv. This is somewhat similar to the scenario proposed by Kuraszkiewicz et al. (2000) from an analysis of NLS1 line ratios without the benefit of kinematic decomposition. We found that this process becomes effective when the density is . We find that the equivalent widths and line ratios are explained when the ionization parameter , the column density is , and the covering fraction is 0.25. It is important to note that in this case the “wind” must have approximately three orders of magnitude higher density than the “disk,” since we observe C iii] to be narrow and symmetric and therefore present among the disk lines. We note that nitrogen must be overabundant, as is often inferred in AGN (e.g., Hamann & Ferland 1999).
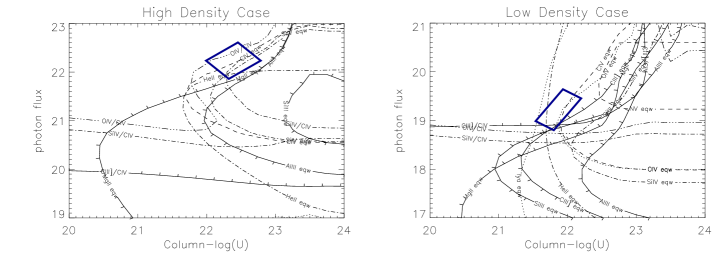
We found a second solution to the problem. If the wind is smooth and if there are significant velocity gradients in the wind, the radiative transfer of the lines will be affected. This is a well-known phenomenon in stellar atmospheres that potentially affects emission lines in other windy systems such as supernovae, CVs, and hot stars. Under the Sobolev approximation, the optical depth to the line depends on a number of factors including the velocity gradient that will affect all resonance lines the same way. However, the optical depth also has some dependence on the atomic physics that will result in a different opacity for different lines. The primary factor is the product of the line absorption oscillator strength, the atomic abundance, and the wavelength of the emission line. This factor is about 4–5 times larger for C iv than it is for the other high-ionization resonance lines, and much larger than it is for semiforbidden lines such as O iv. When the scattering optical depth is large, the escape probability will be proportional to in the Sobolev approximation (Rybicki & Hummer 1983). Taking this difference in opacity into account, we find that we can find an approximate solution for ionization parameter , density , column density , and a covering fraction of 0.5. Again, nitrogen should be overabundant.
It is interesting to note that the effects of differential opacity due to velocity gradients may be present also in the disk emission lines. We observe fairly strong features at least partially attributable to Si ii , Si ii , and C ii (Fig. 1). Such strong Si ii features have also been noted in the NLS1 archetype I Zw 1 (Laor et al. 1997) and other narrow-line quasars (Baldwin et al. 1996). Recently, Bottorff et al. (2000) have shown that these emission lines are predicted to be enhanced under conditions of turbulence or velocity gradients.
However, there are a number of factors that could strongly affect the predicted emission lines that have not been accounted for here:
-
1.
The one-zone model is certainly overly simplistic. Spatial ionization stratification may be present among the high-ionization lines although we note that we obtain a fairly good fit to other high-ionization lines using a template constructed from the C iv profile.
-
2.
Is the wind smooth or clumpy? Radiative transfer of C iv relative to other lines may or may not be a significant factor in a two-phase wind, depending on the density and ionization contrasts.
-
3.
These objects are among the most X-ray variable NLS1s, and therefore the effects of a rapidly-variable ionizing continuum could be important. It is easy to show that the average line emission produced from two continua is not the same as the line emission from the average continuum. The wind is likely to be supersonic, and if the wind is accelerated by line-driving, variability may produce shocks which could change the density and the ionization.
-
4.
What are the effects of radiative transfer? A zeroth-order discussion is presented here, and any attempt to couple radiative transfer to the line emission obtained from CLOUDY (Ferland 1997) is necessarily approximate because the radiative transfer will affect the cooling as well as the level populations.
-
5.
Is the continuum incident upon the line emitting material the same continuum that we see? Models for AGN winds employing radiation line-driving require a screen of highly ionized gas between the central engine and the line-emitting wind to absorb the soft X-rays and prevent the wind gas from becoming over-ionized (Murray et al. 1995; Proga, Stone & Kallman 2000). There are also some indications that the soft X-rays in these highly variable objects may be beamed (Brandt et al. 1999).
References
Baldwin, J.A., et al., 1996, ApJ, 461, 664
Bottorff, M., Ferland, G., Baldwin, J., & Korista, K. 2000, ApJ, 542, 644
Brandt, W.N., et al., 1999, MNRAS, 303, L53
Collin-Souffrin, S., et al. 1988, MNRAS, 232, 539
Ferland, G.J. 1997, HAZY: A Brief Introduction to Cloudy, (Univ. Kentucky Phys. Dept. Int. Rep.)
Francis, P.J., et al., 1991, ApJ, 373, 465
Hamann, F., & Ferland, G. 1999, ARAA, 461, 683
Kuraszkiewicz, J., et al. 2000, ApJ, 542, 692
Laor, A., Jannuzi, B.T., Green, R.F., & Boroson, T.A. 1997, ApJ, 489, 656
Leighly, K.M., 2000, New Astronomy Reviews, 44, 395
Leighly, K.M., 1999a, ApJS, 125, 297
Leighly, K.M., 1999b, ApJS, 125, 317
Leighly, K.M., & Halpern, J.P., 2000, submitted to ApJ
Leighly, K.M., et al. 1997, ApJL, 489, 25
Marziani, P., et al. 1996, ApJS, 104, 37
Murray, N, et al. 1995, ApJ, 451, 498
Proga, D., Stone, J.M., & Kallman, T.R., 2000, ApJ, in press
Rybicki, G.B., & Hummer, D.G., 1983, ApJ, 274, 380
Tytler, D., & Fan, X.-M. 1992, ApJS, 79, 1
Wills, B.J., et al. 1999, ApJL, 515, 53
Wandel, A., & Boller, Th. 1998, A&A, 331, 884