Warm molecular gas in nearby galaxies. Mapping of the CO(3–2) emission
Abstract
Using the Heinrich-Hertz-Telescope on Mt. Graham, Arizona, we have observed several nearby galaxies in the CO(3–2) line. The CO(3–2) emission traces – in contrast to lower rotational transitions – a warmer and denser component of the molecular gas. We find that this emission is spatially extended in the target galaxies. The excitation conditions seem to vary with the location of the gas within the galaxy, and also with the overall properties of the target objects. However, a clear correlation between the CO(3–2) emission and other quantities, such as Hubble type or IR luminosity, is not present.
Submillimeter Telescope Observatory (Steward Observatory, The University of Arizona), 933 N. Cherry Ave, Tucson, AZ 85721, U.S.A.
1. Introduction
Since stars form in molecular clouds, the investigation of the molecular gas component of the ISM is necessary to obtain information about one of the most important links between the stellar component and the interstellar medium. The CO(1–0) and (2–1) lines, which are usually used as a tracer of molecular hydrogen, originate in the large bulk of molecular gas at low and moderate temperatures, and therefore trace the total amount and distribution of molecular gas rather than the highly excited molecular gas close to regions of star formation.
To observe this warmer and denser molecular gas component, one has to consider higher transitions of CO, like the (3–2) line. Due to the lack of good sub-mm telescopes at good sites, early observational attempts were restricted to starburst galaxies, where this line is expected to be strong. Recently Mauersberger et al. (1999) observed a larger sample of galaxies of various types and activities, but measured only one position for each object, hence they were not able to account for spatial changes of excitation conditions within the galaxies.
In order to obtain a data set which covers several different types of galaxies and activity stages and allows to investigate the gas properties at different locations within each galaxy, we extensively mapped a total of twelve nearby galaxies in the CO(3–2) line.
| Source | Type | ||||
|---|---|---|---|---|---|
| [] | [] | [kpc kpc] | (center/disk) | ||
| NGC 253 | SBc | 15.1 | 5.98 | 0.8 / 0.5 | |
| NGC 278 | SBb | 8.7 | 6.21 | 0.8 | |
| NGC 891 | Sb | 19.3 | 7.92 | 0.4 / 0.5 | |
| Maffei 2 | SBbc | – | 1.08 | 1.3 / 0.8 | |
| IC 342 | SBcd | 2.3 | 0.78 | 1.3 / 1.0 | |
| NGC 2146 | SBab pec | 85.7 | 61.40 | 1.3 / 1.0 | |
| M 82 | I0 | 29.7 | 16.40 | 1.0 / 0.8 | |
| NGC 3628 | SBb pec | 6.3 | 13.10 | 1.4 / 1.0 | |
| NGC 4631 | SBd sp | 11.9 | 8.33 | 1.0 / 0.7 | |
| M 51 | Sbc pec | 30.9 | 16.14 | 0.5 / 0.7 | |
| M 83 | SBc | 15.0 | 7.53 | / – | |
| NGC 6946 | SBcd | 10.8 | 4.21 | 1.3 / 1.0 |
2. Observations and data reduction
The observations were carried out at the Heinrich-Hertz-Telescope111The HHT is operated by the Submillimeter Telescope Observatory on behalf of Steward Observatory and the MPI für Radioastronomie.(Baars & Martin 1996) on Mt. Graham during several periods between April 1998 and January 2000. We used a 345 GHz 2-channel SIS receiver, provided by the MPIfR Bonn, together with acousto-optical spectrometers. The total bandwidth of the AOS’s is 1 GHz. System temperatures during the observations were typically between 600 and 1200 K. The data reduction was performed in a standard manner using the CLASS and GRAPHIC programs of the GILDAS package.
3. Results and discussion
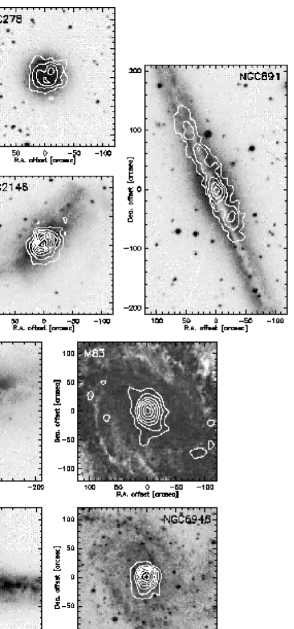
Of the twelve galaxies which were observed, the results for nine are shown as integrated intensity maps in Fig. 1, overlaid on optical images extracted from the Digitized Sky Survey. A map of M 51 is shown in Wielebinski, Dumke, & Nieten (1999), of Maffei 2 in Walsh et al. (in prep.), and CO(3–2) data of M 82 are available in the literature (e.g. Tilanus et al. 1991; Wild et al. 1992). In addition a more detailed analysis of the present data, showing all maps, is given by Dumke et al. (2000).
We found that the CO(3–2) emission is not confined to the nucleus of the galaxies, but rather extended, with the actual extent depending on the object. In some cases, the CO(3–2) is as extended as the CO(1–0). In a few objects, it was even detected in the spiral arms. Nevertheless, the CO(3–2) emission is more concentrated to the vicinity of star forming structures (nuclear regions and spiral arms). This is shown by the difference in the CO(3–2)/(1–0) line ratios between the very centers to regions located further out. The sizes of the central emission peaks, estimated by Gaussian fits and deconvolution, are given in Tab. 1.
The CO(3–2) luminosity is enhanced in objects that contain a nuclear starburst or morphological peculiarities. The total power emitted in the CO(3–2) line from the central regions (i.e. excluding spiral arms/outer disk) is highest in the starburst galaxies NGC 2146, M 82, NGC 3628, and in the spiral galaxy M 51. When comparing the total power divided by the size of the emission region, the starbursts M 82 and NGC 253 show the highest values (about times higher than the other objects), and NGC 278 the smallest.
With the present spatial resolution, the line ratios seem to be independant of Hubble type, color or luminosity. Most galaxies with enhanced central star formation show line ratios of in the very inner center and at a radius of about 1 kpc. Those objects with a ring-like molecular gas distribution (M 82 and NGC 4631) show lower ratios. The two galaxies that show CO(3–2) emission distributed over their spiral arms (NGC 891 and M 51) show very low line ratios despite their high infrared luminosities. This result suggests that CO in these two objects reflects a large amount of molecular gas, rather than enhanced star formation efficiency.
4. Outlook
These observations have shown that it is necessary to study several types of galaxies in order to obtain results which are not biased towards starburst objects. Further it is not sufficient to observe only one point per galaxy, since this cannot account for differences of the CO(3–2) spatial distribution.
In order to improve this study, our group will survey more galaxies in the future. This will lead to better statistics of the findings presented here. Even higher transitions of 12CO are considered, as well as observations of other isotopomers to restrict interpretations concerning optical depth effects.
Acknowledgments.
I thank my colleagues R. Beck, Ch. Nieten, G. Thuma, R. Wielebinski, and W. Walsh for the collaboration during the observations. Further I thank the SMTO staff for their help at the telescope.
References
Baars, J.W.M., Martin, R.N. 1996, in Rev. Mod. Astr., 9, Astr. Ges. Hamburg, 111
de Vaucouleurs, G., de Vaucouleurs, A., Corwin, H.G.Jr., et al. 1991, Third Reference Catalogue of Bright Galaxies (New York: Springer-Verlag)
Dumke, M., Nieten Ch., Thuma, G., Wielebinski, R., Walsh, W. 2000, A&A, (submitted)
Mauersberger, R., Henkel, C., Walsh, W., Schulz, A. 1999, A&A, 341, 256
Tilanus, R.P.J., Tacconi, L.J., Sutton, E.C., et al. 1991, ApJ, 376, 500
Wielebinski, R., Dumke, M., Nieten, Ch. 1999, A&A, 347, 634
Wild, W., Harris, A.I., Eckart, A., et al. 1992, A&A, 265, 447
Young, J.S., Xie, S., Kenney, J.D.P., Rice, W.L. 1989, ApJS, 70, 699