Abstract
We present the results of a spatial correlation analysis between unidentified gamma-ray sources in the 3EG catalog and candidates to supernova remnants. This work extends a previous study made by Romero, Benaglia & Torres (1999). We also consider the gamma-ray emission variability and the spectral index for the sources with positional coincidence.
keywords:
gamma-rays: observations – ISM: supernova remnants – stars: pulsarsPositional correlation between low-latitude gamma-ray sources and SNRs
1 SNRs as gamma-ray emitters
Supernova remnants (SNRs) are usually considered as the main sources of cosmic rays with energies below eV. Both electrons and protons are believed to be accelerated by Fermi mechanism in the expanding shock front of these objects. The electrons produce synchrotron emission detected at radio wavelengths whereas the interactions between relativistic protons and ambient nuclei can produce neutral pions, which quickly decay yielding -ray emission at energies MeV, in the EGRET range. The expected -ray flux at Earth was given by Drury et al. (1994),
| (1) |
where is the energy of the SN in ergs, is the fraction of the total energy of the explosion converted into cosmic ray energy, and and have their usual meaning, number density and distance, respectively. In most cases, the expected flux at GeV energies is far too low to be detected in the range of EGRET, but the presence of nearby clouds can produce a significant enhancement of the -ray emission. Such scenario has been recently studied by Combi et al (1998) in relation with the source 3EG J1659-6251.
As showed by Aharonian et al. (1994), when a SNR hits a cloud a part of the proton population can be transported into it by convection, and illuminate the cloud by subsequent p-p interaction, via pion decay. The resulting flux is
| (2) |
where is the -ray emissivity per H-atom in the cloud. This parameter can be related with its value in the vicinity of Earth by , with .
Other mechanisms, like relativistic bremsstrahlung and inverse Compton losses, associated with the leptonic component, can also play a role if the electron density and/or the photon fields are high enough, see for instance Pohl (1996). Then, there are many theoretical reasons to expect a positional correlation between SNRs and unidentified -ray sources. We devote the rest of this work to analyze this correlation.
2 Positional correlation
Possible physical correlation between SNRs and unidentified EGRET sources, on the basis of two dimensional positional coincidence, has been proposed since the release of COS-B data (Montmerle 1979) and the first EGRET (1EG) catalog. Sturner & Dermer (1995) suggested that some of the unidentified sources lying at low galactic latitudes might be associated with SNRs: of 37 detections, 13 overlapped SNR positions in the 1EG catalog. However, the statistical significance was not too high as to provide a strong confidence. Using the 2EG catalog, Sturner et al. (1996) repeated the analysis, and showed that 95% confidence contours of 7 unidentified EGRET sources overlapped SNRs, some of them appearing to be in interaction with molecular clouds. Similar results were independently reported by Esposito et al. (1996), considering only radio-bright SNRs, and Yadigaroglu and Romani (1997), although they did not assessed the overall chance probability of these 2EG-catalog findings. The evolution in the number of coincidences and SNRs considered in the different studies is shown in Table 1. Note that from the First to the Second EGRET catalogs, fourteen unidentified sources were discarded. In the Third catalog, 6 unidentified sources are possibly artifacts produced by the strong emission of the Vela pulsar: these sources disappear in a map where the pulsed Vela emission is suppressed.111Notes corresponding to Table 1 are as follow: a: Sturner and Dermer (1995). b: Sturner, Dermer and Mattox (1996). c: Esposito, Hunter, Kanbach and Sreekumar (1996). d: Yadigaroglu and Romani (1997). e: Romero, Benaglia and Torres (1999). f: This work. g: Only radio-bright SNRs, flux at 1 GHz greater than 100 Jy, were used. h: Computed for pairs.
In Table 2 we show the 3EG sources that are positionally coincident with SNRs listed in the latest version of Green’s catalog. From left to right we provide the -ray source name, the measured flux, the photon spectral index , the variability index (see below), the SNR identification, the angular distance between the best -ray source position and the center of the remnant, the size of the remnant in arcminutes, the SNR type (S for shell, F for filled-centre, and C for composite), and other positional coincidences found in our previous study (Romero, Benaglia and Torres 1999). It is interesting to note that in the 3EG catalog, not all the positional coincidences with SNRs are SNOBs, as was the case reported by Montmerle (1979) and Yadigaroglu and Romani (1997) using previous samples.
![[Uncaptioned image]](/html/astro-ph/0012160/assets/x1.png)
We also consider whether some of the sources in our sample may be associated with recently proposed candidates to supernova remnants, presently not catalogued by Green (1998). Our interest in this search resides in the fact that young stellar objects, like recently formed black holes and pulsars, can still be associated with the gaseous remnant of the original supernova that created them. The diffuse non-thermal emission of the galactic disk, originated in the interaction of the leptonic component of the cosmic rays with the galactic magnetic field, is surely veiling many remnants of low surface brightness. Recent observational studies using filtering techniques in the analysis of large-scale radio data have revealed several new SNR candidates that are not yet included in the latest issue of Green’s catalog. In general, these new candidates are much more extended than those previously known. There are 101 of these weak non-thermal structures detected so far in the Galaxy. This number significantly extends Green’s (1998) catalogue. The list of these new candidates, and the references from where they were compiled, can be obtained from the paper by Torres et al. (2000).
We have found that only 7 gamma-ray sources in our sample are positionally coincident with non-thermal radio structures. The positional coincidences thus obtained are shown in Table 3, where we provide similar information as that given in Table 2.
In order to estimate the statistical significance of these coincidences, we have numerically simulated a large number of synthetic sets of EGRET sources using the code described in the paper by Romero, Benaglia and Torres (1999). The results of this study are shown in Table 4 where we provide results for different samples of unidentified sources and SNRs catalogs: the original 81 unidentified EGRET sources, the 75 high confidence ones, and the 40 sources without any positional correlation with known galactic gamma-ray emitters (as reported by Romero et al. (2000)). For the latter sample we are interested in checking the possible association with candidates to SNRs. We conclude that there is strong statistical evidence suggesting that some 3EG unidentified EGRET sources must be physically associated with SNRs in Green’s Catalog. At the same time, there is no statistical evidence suggesting that the 3EG sources analyzed in our sample are physically associated with candidates to SNRs: the number of real positional coincidences with them is totally compatible with, and even lower than, the result of a random association. This latter result appear to be the consequence of the candidates to SNRs being much more extended objects, thus improving the random coincidences with any given population, and does not discard in itself that some of the coincidences could be physical ones.
Table 4. Statistical results. G stands for Green’s SNRs and C for candidates.
| Number | Unidentified | Real | Simulated | Poisson |
|---|---|---|---|---|
| of SNRs | Sources | coincidences | coincidences | probability |
| 220 (G) | 81 | 22 | 7.8 2.5 | 1.5 |
| 220 (G) | 75 | 19 | 7.0 2.4 | 9.9 |
| 321 (G C) | 75 | 30 | 22.4 3.8 | 0.02 |
| 101 (C) | 40 | 7 | 10.4 2.7 | 0.07 |
3 Spectral and variability indices
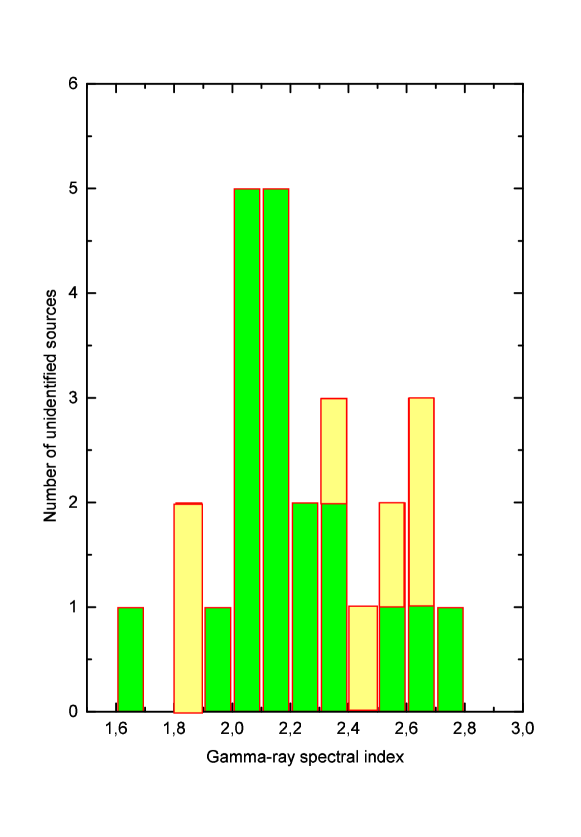
In Figure 1 we present the distribution of the spectral index for all unidentified sources which resulted to have positional correlation with SNRs and candidates. All values are compatible with Fermi-like acceleration processes that could happen in the strong shocks generated by the explosion of the supernova, or be the outcome of the interaction between relativistic material and a nearby cloud, or –for the lowest ones– be associated with gamma-ray emission by pulsars. The distribution peaks around , but some sources have a large spectral index of about 2.8. Recall that the steepest measured spectral index for pulsars is around 2.2, so this is pointing against a pulsar origin for several of these gamma-ray sources.
We now assess the possible long term variability of the sources. We define a mean weighted value for the EGRET flux as:
| (3) |
is the number of viewing periods for each gamma-ray source. is the observed flux in the -period, whereas is the corresponding error in the observed flux.222For those observations in which the significance ( in the EGRET catalog) is greater than 3, we took the error as . However, many of the observations are in fact upper bounds on the flux, with significance below 3. For these ones, we assume both and as half the value of the upper bound. We then define the fluctuation index as: In this expression, is the standard deviation of the flux measurements. In order to remove as far as possible any spurious variability introduced by the observing system, we computed the fluctuation index for the confirmed gamma-ray pulsars in the 3EG catalog. The identification by Kuiper et al. (2000) is not included because of the blazar contamination of the EGRET flux, observed by these authors. We adopt the physical criterion that pulsars are non-variable gamma-ray sources. Then, any non-null -value for pulsars is attributed to experimental uncertainty. We then define an averaged statistical index of variability, , as
| (4) |
In terms of the averaged index , the adopted variability criterion is then that variable sources will be those with , which is 3 away from the statistical variability of pulsars.333Detailed comments on how this variability index compares with others, especially with the analysis made in W. Tompkins’ Ph.D. thesis, are given elsewhere (Torres et al. 2000).
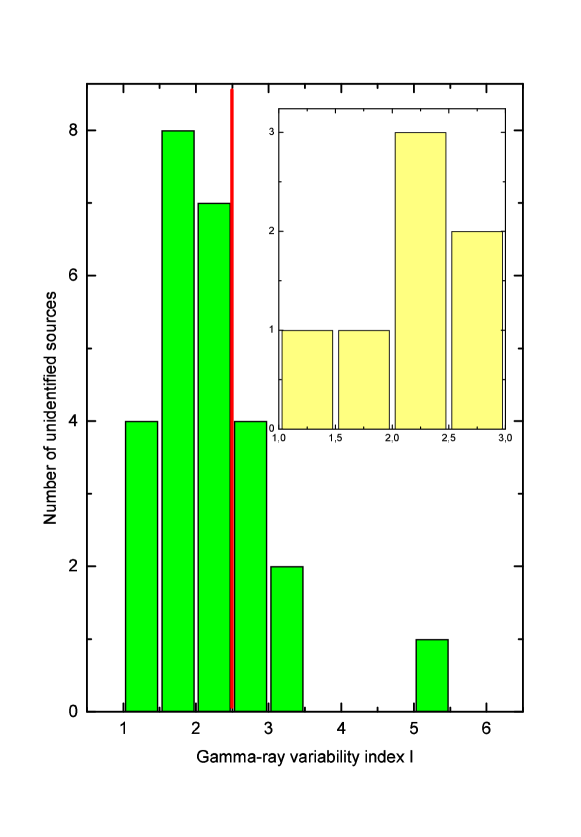
In Figure 2 we show the distribution for the variability index of those sources that are positionally coincident with SNRs. We see that most of the 19 sources positionally related with Green’s SNRs have , being their mean value 2.17. Indeed, 12 sources out of 19 have . There are three sources with very high -index: 3EG J1824-1514, J1837-0423 and 3EG J05422610, with , and , respectively. These sources show spectral indices of 2.19, 2.71 and 2.67. The source 3EG J1824-1514 has been recently proposed by Paredes et al. (2000) as a faint microquasar detected through VLBI observations. This and other sources with , are very unlikely physically associated with the SNRs in the usual sense, i.e. being pulsars or nearby clouds in interaction with the swept up material. Nevertheless, compact objects like accreting black holes, or even isolated Kerr-Newmann black holes (Punsly et al. 2000) are interesting possibilities, they surely requires additional analysis.
Acknowledgements.
This work was partially supported by CONICET, ANPCT (PICT 98 No. 03-04881), and Fundación Antorchas (through separate grants to D.F.T., J.A.C. and G.E.R.). Additional on-line data can be obtained at URL: www.iar.unlp.edu.ar/garra. Authors would like to thank the Organizers for their kind invitation to this meeting.1
References
- [1] Aharonian F.A., Drury L.O’C., Völk H.J. 1994, A&A 285, 645
- [2] Combi J.A., Romero G.E., Benaglia P. 1998, A&A 333, L91
- [3] Drury L.O’C., Aharonian F.A., Völk H.J. 1994, A&A 297, 959
- [4] Esposito J.A., Hunter S.D., Kanbach G., Sreekumar P. 1996, ApJ 461, 820
- [5] Green D.A. 1998, A Catalog of Galactic Supernova Remnants, Mullard Radio Astronomy Observatory, Cambridge, UK (available on the World Wide Web at http://www.mrao.cam.ac.uk/surveys/snrs/)
- [6] Kuiper L., Hermsen W., Verbunt F., et al. 2000, A&A 359, 615
- [7] Montmerle T. 1979, ApJ 231, 95
- [8] Paredes J. M., Marti J., Ribo M., Massi M. 2000, Science, 288, 2340
- [9] Pohl M., 1996, A&A, 307, 57
- [10] Punsly B., Romero G.E., Torres D.F., Combi J.A., 2000, A&A to appear, [astro-ph/0007465]
- [11] Romero G.E., Benaglia P., Torres D.F. 1999 A&A 348, 868
- [12] Romero G.E., Torres D.F., Combi J.A. 2000, Proceedings of the 4th Integral Workshop, ESA-SP Publications, In press.
- [13] Sturner S.J., Dermer C.D. 1995, A&A 293, L17
- [14] Sturner S.J., Dermer C.D., Mattox J.R. 1996 A&AS 120, 445
- [15] Torres D.F., Romero G.E., Combi J.A., et al., 2000, A&A (submitted), [astro-ph/0007464]
- [16] Yadigaroglu I.-A., Romani R.W. 1997, ApJ 476, 356