2.-Astronomisches Institut der Universitat Basel, CH-4102 Binningen, Switzerland.
3.-School of Physics and Astronomy, University of Nottingham, NG7 2RD, UK
email: jalfonso@astro.unibas.ch, balcells@ll.iac.es, Reynier.Peletier@nottingham.ac.uk
Growth of Galactic Bulges by Mergers: I Dense Satellites
Abstract
Andredakis, Peletier & Balcells (1995) fit Sersic’s law to the bulges of the Balcells & Peletier (1994) galaxy sample, and infer that drops with morphological type T from 4–6 for S0 to (exponential) for Sc’s. We use collisionless N body simulations to test the assumption that initially the surface brightness profiles of all bulges were exponential, and that the steepening of the profiles toward the early-types is due to satellite accretion. The results are positive. After the accretion of a satellite, bulge-disk fits show that the bulge grows and that the bulge profile index increases proportional to the satellite mass. For a satellite as massive as the bulge, rises from 1 to 4. We present kinematic diagnostics on the remnants and disk thickening. The latter suggests that the bulge growth must have occurred before the last formation of a thin disk in the galaxy. The thick disks created by the merger are reminiscent of thick disks seen in early-type edge-on galaxies. The efficiency of the process suggests that present day bulges of late-type spirals showing exponential profiles cannot have grown significantly by collisionless mergers.
Key Words.:
galaxies:evolution — galaxies:interactions — galaxies:kinematics and dynamics — galaxies:nuclei — galaxies:spiral — galaxies:structure1 Introduction
Two paradigms are commonly used to explain the formation of the central bulges of disk galaxies. In the first, the bulge forms prior to the disk, perhaps as part or an aftermath of the formation of the stellar halo (Gilmore & Wyse 1998), or as a result of early merging resulting in an spheroid around which a new thin disk forms from surrounding gas (eg. Kauffmann, Guiderdoni & White 1994). In the second, bulges form and grow after bar instabilities draw disk stars and gas to the center (Pfenniger & Norman 1990). Details about these paradigms are given in the review by Wyse, Gilmore & Franx (1997). Bouwens, Cayón & Silk (1999) perform a comparative test of these hypotheses.
What is the role of interactions, mergers and accretion of satellites in the functioning of these processes?. Satellite accretion must have occurred several times in a disk galaxy over a Hubble time. While mergers of galaxies with similar mass fully destroy the disk (eg. Barnes & Hernquist 1991) and leave remnants resembling an elliptical galaxy, satellite accretion does less damage to the disk; and, if the satellite is dense enough, it must reach the galaxy center. The accretion in this case may drive the growth of the central bulge. Several studies have addressed whether mergers are responsible for pushing a spiral galaxy along the Hubble sequence toward Sa/S0 (eg. Walker et al 1996). Mergers must have been efficient in groups and in the field; in the cluster environment, disk cosmological fading due to the evaporation of neutral gas, the cluster tidal field (Dubinski 1998) and occasional galaxy-galaxy encounters (Moore et al. 1996) contribute as well to the growing prominence of the bulge.
Satellite accretion onto disk galaxies has been extensively studied in the past using N body techniques. The focus of these studies have been the thickening of the disk (Quinn & Goodman 1986, Tóth & Ostriker 1992, Quinn, Hernquist & Fullagar 1993, hereafter QHF93, Walker et al 1996, Huang & Carlberg 1997), the formation of counterrotating disks in spirals (Thakar & Ryden 1996), the formation of X structures in S0 galaxies (Mihos et al. 1995), and the triggering of nuclear starbursts (Mihos & Hernquist 1994). Diagnostics related to the central bulge are largely ignored. Indeed, except for the latter paper, none of the studies mentioned above include a central bulge in their initial galaxy model, a bold simplification given that the potential of the central bulge is a key ingredient of the merger dynamics of both stars (Hernquist 1993) and gas (Mihos & Hernquist 1994).
Sufficient data exists nowadays on bulges (Balcells & Peletier 1994, hereafter BP94, Peletier & Balcells 1996, 1997, Peletier et al. 1999, Carollo 1999, de Jong 1996, Prieto et al. 1999, Ratnatunga, Griffiths & Ostrander 1998, Schade et al. 1996, Abraham et al. 1999, Marleau & Simard 1998) to allow the structure and dynamics of bulges to be used as constraints on the accretion history of disk galaxies. However, no detailed studies of the growth of bulges by accretion of satellites have been published to date.
In this paper we study whether the shape of the surface brightness profiles of bulges changes with the merger history of spiral galaxies. Andredakis, Peletier & Balcells (1995, hereafter APB95) show that bulges follow a systematic behavior in the vs. T plane, where is the exponent index in Sersic’s law , and T is the galaxy type index given eg. in the RC3. APB95 find that is 4–6 in early, S0 types, decreasing to for late types (Sc).
The APB95 result could result from the effect of the disk potential on a bulge initially following an law, in an scenario in which the bulge forms prior to the disk. Andredakis (1998) studies the adiabatic growth of a disk onto an existing spheroid, and finds that the disk potential does modify the bulge surface brightness profile, lowering the in the exponent of Sersic’s law. But the mechanism saturates at , showing that exponential bulges () cannot be produced by adiabatic growth of the disk around an bulge.
That merging is an efficient way to generate surface brightness profiles is well-known (Gerhard 1981; Barnes 1988). We may thus conjecture that the behavior found by APB95 reflects the effects of the relaxation in an scenario of bulge growth by accretion. Here we address the following question: assuming that bulges are formed with exponential profiles, does the accretion of dense satellites simultaneously drive the growth of the bulge mass and the evolution of the bulge surface density profile toward higher- Sersic law shapes? In cosmological models of galaxy formation involving gas and stars, central bulges show characteristic exponential surface density profiles (Domínguez-Tenreiro et al. 1999), suggesting that bulges may start out with exponential profiles, and that any changes are imprints of subsequent evolution. To test the bulge growth conjecture we consider disk-bulge-halo galaxy models for which the bulge surface brightness profile is initially exponential, and fit Sersic’s law to the bulge surface brightness profile after an accretion of a satellite. We then draw ”growth vectors” in the vs. T plane.
Our results suggest that accretion of dense satellites is efficient in turning exponential bulges into bulges. After the merger, the index of Sersic’s law increases proportional to the satellite mass. It reaches for a satellite as massive as the original bulge. Our models suggest that this result is largely independent of the internal structure of the satellite, as long as the satellite is dense enough to reach the center undisrupted. We quantity disk thickening. We concur with other studies of spiral galaxy evolution via merging, that only if the thin disk is rebuilt after the accretion can we match real galaxies. We analyze the kinematic structure of the merger remnants to provide additional tests of the model. For direct mergers, the rotation curve shapes are steeper for more massive bulges, consistent with observations. Massive satellites on retrograde orbits result in counterrotating bulges, suggesting either that massive accretion events are rare, or that accretion preferentially occurs on prograde orbits.
| Bulge | Disk | Halo | ||||||||||
|---|---|---|---|---|---|---|---|---|---|---|---|---|
| (1) | (2) | (3) | (4) | (5) | (6) | (7) | (8) | (9) | (10) | (11) | ||
| 0.422 | 0.24 | 0.82 | 1.0 | 5.0 | 0.10 | 5.14 | 21.81 | |||||
(1) Bulge mass (2) Bulge half-mass radius (3) Number of bulge particles (4) Disk mass (5) Disk scale lenght (6) Disk truncation radius (7) Disk scale height (8) Number of disk particles (9) Halo mass (10) Halo truncation radius (11) Number of Halo particles.
Model details are given in § 2. The results on the shape of the bulge surface brightness profiles are given in § 3. Model kinematics are presented in § 4. Section 5 briefly presents results on disk heating. Implications are discussed in § 6. A summary of results is given in § 7. Throughout the paper, denotes mass and not absolute magnitude.
2 Models
The primary galaxy is modeled with the bulge-disk-halo model of Kuijken & Dubinski (1995, hereafter KD95). The bulge is modeled as a King model. This model was chosen for the bulge because its surface density profile is exponential between the core radius and the truncation radius, providing a good match to the surface brightness profiles of late-type spirals, and because it is spheroidal. The core radius is 0.15 (units given below), and the concentration parameter, taken as the ratio of the bulge truncation radius and the core radius, is 6.7. The disk surface density is exponential both in the galactic plane and in the perpendicular direction to the plane. The scale height is ten times less than the scale length (see eg. Guthrie 1992, de Grijs 1998). The chosen disk velocity dispersion makes the disk warm with a Toomre at the disk half mass radius. The value of is fairly constant throughout the disk, though rising both in the center within 1 scale length and near the edge (KD95). This parameter does not allow the growing of bar-type perturbations in the disk when in isolation. The halo has a distribution function of an Evans model (Kuijken & Dubinski 1994).
The model used for our experiment is equal to model of KD95 This model matches the Milky Way when the units of length, velocity and mass are kpc, km s-1, . Note that the core radius is then 0.71 kpc, indicating that the models lack central resolution. Masses, radii, and number of particles for each component are given in Table 1. A gravitational constant of is used throughout.
The satellite galaxy is modeled either as a non-rotating Hernquist sphere (Hernquist 1990), with outer radius similar to that of the bulge, or with a King model. The King model satellite is useful to verify that the accretion-driven evolution toward an profile is not motivated by the fact that the Hernquist satellite models already have a surface density profile approaching the law.
Both the disk and the satellite galaxy models are allowed to relax separately for 1.5 disk rotation periods (measured at 1 disk scale length) before starting the simulations. The surface density profile of the initial disk galaxy model after relaxation is shown in figure 3a. Its projected rotation curve is shown in figure 7a together with the model’s circular velocity curve. We ran the disk galaxy model in isolation for 2000 time updates (14 disk rotation periods at 1 disk scale length, the maximum duration of our merger experiments). The shape of the bulge surface density profile is stable (same value at start and at end of run), while the disk thickens in close agreement with the thickening results of KD95. This demonstrates that, while the number of particles is admittedly low, the results do not suffer from two-body relaxation as the more massive halo particles cross the disk and the bulge. This result also demonstrates the excellent stability properties of the KD95 model, which makes it ideally suited to experiments of interaction-driven structural evolution such as the ones in this paper.
We run several merger experiments varying the mass of the satellite galaxy. We explored three values of the bulge-to-satellite mass ratio, 1:1, 3:1, and 6:1. For each satellite mass setting we run a direct orbit (inclination 30∘ w.r.t. the disk plane) and a retrograde orbit (inclination 150∘). Initial orbits were elliptical with apocenter equal to twice the disk outer radius and pericenter equal to twice the diskscale length. We don’t explore the dependency of the results on the orbital energy or angular momentum. This choice is probably restrictive. We expect a dependency on orbital initial conditions to be significant for the disk (eg. QHF93), though possibly not for the bulge; when the satellite reaches the inner parts of the galaxy, the potential’s circular velocity should determine the energy of the bulge-satellite merger more so than the orbit initial conditions. For all these models a Hernquist satellite was used. Retrograde merger orbits with mass ratios 1:1 and 1:3 were repeated using a King model satellite. While full exploration of satellite density effects is beyond the scope of this paper, we run one model in which the satellite has low density (model 7 in Table 2). This model is similar to the models of Velazquez & White (1999). Orbital parameters for the merger experiments are shown in Table 2. Satellite masses and half-mass radii are given in Table 2. We used a scaling between satellites of different masses. In the remainder of the paper, models are referred to using a three-character code: SMO, where S describes the satellite (H for Hernquist, K for King, L for low-density), M describes the ratio of bulge mass to satellite mass (values 1, 3, 6), and O describes the orbit (D for direct, R for retrograde). Codes are given in Table 2. On one of the merger remnants, we ran a second merger, which we denote H3R3R (see § 3 and inset in Figure 6). We also attempted a multi-merger experiment involving 10 small satellites (§ 6).
Computations were carried out with a SGI Power Challenge machine (6 64-bit R8000 processors). Evolution was computed using the TREECODE of C. H. Heller (see Heller 1991, Heller & Sholsman 1994), kindly made available by the author. Heller’s code, with SPH turned off, uses the cubic tree structure described by Barnes & Hut (1986). The algorithm updates the particle positions with the leap-frog algorithm, with a variable time step ranging between 0.01 and 0.05. The gravitational force was softened with a spline kernel (Hernquist & Katz 1989) with constant softening length . No quadrupole-moment corrections were applied. In cubic treecodes, a monopole-only calculation increases force errors by about 50% relative to a calculation including quadrupole terms (Hernquist 1987). Hence, for the tolerance parameter used (), our code computes forces within 1.5% of those given by direct summation, compared to typical 1% errors of the calculation to quadrupole order. All models were evolved beyond the full merger. Total energy was conserved to better than 0.1% during the simulation. Two of the merger models were repeated using Hernquist’s version of the TREECODE (Hernquist 1987, 1990a). The final surface density profiles were identical to those computed with Heller’s code.

3 Results
In figures 1 and 2 we show snapshots of the evolution of the models H1D and H6D. In both these models, as in models 1–6, 8 and 9, the core of the satellite reaches the center of the primary galaxy and merges with the bulge. The scaling of dynamical friction with the satellite mass causes the merger times to significantly increase as the satellite mass decreases. The merger affects the structure of the main galaxy in several ways. Transient spiral patterns, warps and non-axisymmetrical structures appear in the disk of the main galaxy. We address those in § 5.
We first focus on the structural parameters of the bulge. Figure 3a shows the surface density profile of the main galaxy before the merger. Poisson-based error bars in the density, not plotted, are a few percent at most owing to the large number of particles. We decompose this profile in two components much in the same way as observers decompose a galaxy surface brightness profiles. The disk portion of the profile is well fit with an exponential law. The Sersic law written as
| (1) |
is used for the bulge (Sérsic 1968; Andredakis et al 1995; Prieto et al. 1999), with , and as free parameters. The best fit is achieved with , i.e. exponential profile. Deviations occur only at radii smaller than the core radius, where the surface density profile flattens.
Figures 3b–j show the final face-on, azymuthally-averaged radial surface density profiles of all luminous matter for models 1–9. The dotted lines show the two-component, exponential plus Sersic-law fits to the surface density. Again these are raw fits to the luminous matter, ie. no account is made of whether particles originally belonged to the bulge, to the disk or to the satellite when performing the decomposition of the profile. Thus, we analyze the mass distribution in much the same way as an observer would model the light distribution of a face-on spiral galaxy. Points inside were excluded from the fit, as they are too sensitive to the flattening of the initial bulge surface density profile. The fits were made using a Levenberg-Marquardt nonlinear fitting algorithm to locate the minimum. All model parameters were allowed to change. The entire set of fitted parameters and the bulge-to-disk mass ratio derived from the fits are tabulated in Table 3. The final increases with the satellite mass, being slightly higher in the retrograde cases (7%) than in the prograde cases. reaches 4 for a satellite as massive as the original bulge. In order to compute the goddness of the fits we computed the reduced for fits in which was fixed at values ranging from 0.8 to 5. Figure 5a–j shows the reduced vs . arrows indicate the minimum values listed in Table 3. The minimum values of together with the number of data points in the fit , imply a better than 99% confidence that the errors are not due to mismatch of the model to the data. Figure 5a–j demonstrates that the remnant bulges have indeed evolved away from the initial exponential profile, given that values of below the best-fit values are strongly excluded. The profiles have well-defined minima, with the exception of the massive-satellite models H1D, H1R, K1R. These models admit fits with .

The models displayed in figures 3c–h all correspond to Hernquist satellites. Models H1R and H3R were repeated using King model satellites, as a basic test of the dependency of the result on the choice of satellite model. These are models 8 (K1R) and 9 (K3R) in Table 2. Masses and half-mass radii for the satellites of models K1R and K3R are identical to those of models H1R and H3R, respectively. The surface density profiles of models K1R and K3R (Fig. 3i,j) are very similar to those of H1R, H3R, except at the very center. The Sersic shape index , given in each figure, is nearly identical in models K1R and K3R as in models H1R and H3R, respectively. This suggests that the present results do not depend on a fundamental way on the details of the internal structure of the satellite, but mostly on the satellite total mass and mean density.

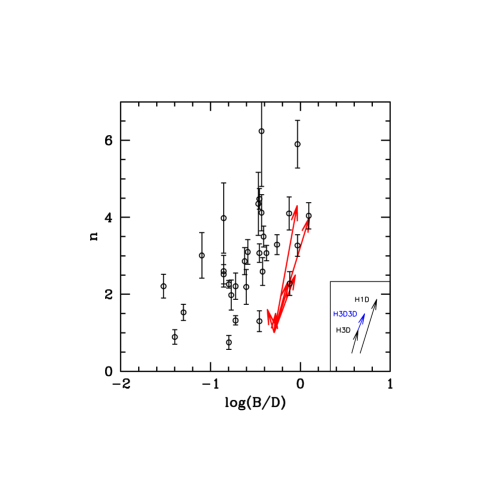
Figure 6 shows growth vectors in the – plane. As discussed above, the bulge-to-disk ratios are those derived from the Sersic plus exponential fits, i.e. they are the ones an observer would derive. Overall, bulges grow with the accretion process. As satellite accretion deposits mass onto the central bulge, it drives the increase of the shape parameter of the surface density profile. Plotted in the same figure is the distribution of vs for the bulges in the BP94 sample, extracted from Figure 5b of APB95. The match is encouraging, as the growth vectors trace an increase of Sersic index with B/D just as observed in the data; and most of the range of values displayed by the data is obtained in the models. Admitedly our models cover the high-mass end of the space only. Also, the growth vectors trace a somewhat steeper slope than that of the distribution of data points. Indeed, accretion appears as being effective in driving bulges toward high values of . Two conclusions can be drawn from this result. First, collisionless accretion of dense satellites onto disk-bulge-halo galaxies causes the bulge surface density profile to evolve toward higher- Sersic profiles. That a merger of similar-mass systems leads to an profile is well known (Gerhard 1981, Barnes 1988). The present mergers involve very unequal masses, thus our result is not a direct consequence of theirs, and indeed the final (total) mass distribution in our models differs substantially from the law. The second conclusion is that bulges showing exponential surface brightness profiles may not have significantly grown via collisionless accretion of dense satellites.
As said in § 2, we let the remnant of model H3D absorb a second satellite of the same mass as the first. The inset to Figure 6 shows the growth vector of the resulting model, H3D3D, together with those of H3D and H1D. The second merger results in a similar increase in as the first merger, as well as a similar fractional growth of . The figure suggests that a subsequent merger with a similar satellite (total accreted mass in the three mergers equal to the initial bulge mass) would bring the final remnant to a and comparable to those of model H1D (single satellite with mass equal to the initial bulge mass). This suggests that the evolution of bulges in the – plane has little dependence on whether the mass is accreted in one event or peacemeal.
The satellite needs to reach the galaxy center undisrupted for it to modify the bulge shape parameter. In the low density satellite case (model 7, L1D), the satellite disrupted completely before reaching the bulge. The decomposition of the surface brightness profile in this case is shown in Figure 3b. The best fit for the bulge has , the same value as in the initial profile. The mass distribution is however not entirely undisturbed. Comparison with the initial surface density profile (Fig. 3a) shows that the final extrapolated disk central surface density of model L1D is slightly lower, and, more significantly, the central density of the bulge component is higher than in the initial model. This is surprising as the satellite has disrupted completely before reaching the center.
We now analyze the contribution of each mass component to the final surface density profiles. Figure 4 shows the surface density distributions for matter originally belonging to bulge, disk and satellite, for all of the merger models. Panel gives the distributions in the models before the merger. Near the x-axis of each plot, vertical arrows mark the half-mass radius for the distribution of bulge particles (thick arrows) and that of satellite particles (thin arrows).
The distributions of particles initially belonging to the bulge and to the satellite develop extended tails in all cases, with being larger for the more massive satellite cases. For the bulge, the tail is a result of the absorption by dynamical friction of the orbital energy and angular momentum of the satellite, while for the satellite it is a result of stripping. Matter from both the bulge and the satellite contribute to the final profile of the inner component deviating from the straight, exponential shape. For the more massive satellite mergers, the central density of bulge material drops significantly, the center being filled with satellite material; the central density of bulge particles is roughly unchanged for lower mass satellites.
There is a third contribution to the final shape of the inner component deviating from an exponential shape – that of the disk material. In all cases, the surface density profile of particles originally belonging to the disk significantly deviates from an exponential law, curving up inward and showing a significantly higher central surface density than in the initial model. Disk material has been dragged inward during the merger. When performing raw two-component fits such as those shown in Figure 3, matter originally belonging to the disk contributes to the inner component. This occurs even in model L1D where the satellite has completely disrupted before reaching the center.
How much damage does the initial bulge take as as result of the absorption of orbital energy? Figure 9 gives , the radius enclosing a given fraction of the mass, for the bulge particles in the initial and the final snapshots for models 1–7. In models 1 (H1D) and 2 (H1R), the initial bulge expands at all radii, reflecting the effects of the denser satellite on the relatively fragile bulge. Smaller satellites (models 3–7) deposit most of their energy in the outer layers. In all cases, the increase in traces the formation of an extended tail which turns the initial exponential profile into an Sersic profile.
4 Internal kinematics of the merger remnants
The transformation brought forward by the merger modifies not only the galaxy’s radial mass distribution but also its internal kinematics. Rotation curves of disk galaxies follow systematic patterns as a function of Hubble type, hence we may obtain additional diagnostics on the accretion by studying the rotation curves of the merger remnants. The rotation curves of the initial model and of models 1–9 after the merger are shown in Figure 7. These are line-of-sight velocities, measured along a virtual slit placed in the plane of the disk, with the disk seen edge-on. Velocities for particles initially belonging to each of the galaxian components are shown with different symbols. For the post-merger rotation curves, bulge and satellite particles have been grouped together for clarity. The individual rotation curves for bulge and satellite material are shown in Figure 8.
We first analyze the direct models (Models 1, 3, 5, 7). The overall rotation curve of the luminous matter (Figure 7, solid line) is steeper in the model representing the earliest type (model H1D, largest final bulge), becoming shallower for later types (model H6D). This behavior is similar to that observed in disk galaxies (eg. Casertano & van Gorkom 1991). The faster rotation of the model with the largest bulge reflects not only the contribution of the massive bulge to the gravitational potential but also the intrinsic fast rotation of the bulge. In the central parts this is higher than that of the disk material, whose motion is partially pressure-supported due to heating: merger 1 has produced an object that may resemble an S0 galaxy. It is the material originally belonging to the bulge that drives the fast inner rotation of the final bulge (Fig. 8a), while the satellite material rotates much slower. The difference is due to the differences in the density profile of bulge and satellite. The bulge (King model) and satellite (Hernquist model), despite having equal total masses, have different central densities; when both merge, the satellite high-density core eventually dominates the potential, driving bulge material to spin in the satellite’s wake. This behavior is common to all mergers of galaxies with unequal densities (Balcells & Quinn 1990, Balcells & González 1998). In models involving King satellites, the rotation curves of bulge and satellite materials are more nearly similar (Fig. 8i,j). Smaller satellites have overall lower effect on the total potential. Stripped, high velocity material dominates the rotation curve of the material originally belonging to the satellite (Fig. 8g,h).

Retrograde models (nos. 2, 4, 6, 8, 9) show characteristic retrograde rotation of the bulge and satellite material. In the central region, the final bulge spins due to deposition of orbital angular momentum transported inward by the satellite, and the material belonging to the initial bulge acquires rotation (our initial models featured non-rotating bulges). Outside the bulge (at roughly ), stripped satellite particles and particles initially belonging to the bulge orbit as test particles in the halo potential. This material may correspond to the retrograde moving groups in the Milky Way halo (Norris & Ryan 1989, Majewski 1992), but would be unobservable in unresolved galaxies due to its low surface brightness.
The counterrotation of the final bulge is common to all our retrograde mergers. If the initial bulges had had direct rotation, we expect that the final bulge would not counterrotate in the low-mass mergers (models H3R, H6R, K3R, Fig. 7f,h,j), but new models are needed to verify this. For the low-mass retrograde mergers, the fast counterrotating velocity of the satellite material (Fig. 8h), can be detected with line-profile spectral analysis techniques such as unresolved Gaussian decomposition (Kuijken & Merrifield 1993). These simulations show that the counterrotation found in the bulge of NGC 7331 (Prada et al. 1996) could correspond to the remnant of an accreted low-mass satellite. Bulge counterrotation has also been found in NGC 2841 (Silchenko et al 1997), but is otherwise uncommon in spiral and S0 galaxies (Kuijken et al. 1996).
5 Effects on the disk
It is well known that mergers with dense satellites heat up the disk (QHF93), and the effect is clearly seen in Figures 1 and 2. Figure 10 shows the disk scale height for all models as a function of time. has been measured at the galactocentric distance of which corresponds to one initial disk scale length. The thickness of the disk increases with the mass of the satellite galaxy. Satellites with the same mass as that of the bulge increase by about 2.5 times more than satellites with of the bulge mass. No significant differences can be found between prograde an retrograde models. Figure 10 gives also the thickness of the disk for the low-density satellite model (L1R). The increment of in model L1R is about 3.4 times less than the increment presented by models H1D and H1R in which the satellite has the same mass but higher density. Our thickening results are comparable to those of QHF93.
A second important effect of the merger is to increase the disk scale length. increases by 10% for the smaller, increasing to 60% for the largest satellites (Table 3). The shallower disk profile is a result of outward transport of disk material in the outer parts, combined with inward transport to the bulge in the inner parts. Because the bulge effective radius does not increase strongly during the merger, the ratio decreases as a result of the merger. The final does not scale with the final in any systematic way. We discuss the significance of these results in § 6.

6 Discussion
Our simulations show that, as a spiral galaxy grows its bulge by accretion of small satellites, the bulge surface brightness profile quickly evolves from an , exponential profile, to a profile approaching . Growth vectors on the vs plane suggest that the dependency of on Hubble type found by APB95 could be the result of satellite accretion.
The result goes beyond being just a manifestation of the known evolution of violently relaxing systems toward the law (eg. van Albada 1982). Indeed, gravitational matter in our systems includes disk and halo in addition to the bulge. Taken as a whole, none of the final remnants approach the law, especially so the luminous components. Our results demonstrate that, only that specific subsystem identified with the central bulge, gradually evolves toward , while the rest of the luminous matter keeps its exponential surface density distribution.
Collisionless processes alone are involved in the transformation. Satellites that do not entirely disrupt during the merger are needed for the process to operate with the efficiency shown here. If the satellite disrupts the bulge surface brightness profile remains undisturbed. However, the transformation does not rely on the satellite having an to begin with: the evolution of the surface brightness profile is similar whether the satellite is modeled with a Hernquist profile or a King profile, suggesting that, as long as the satellite does not disrupt during the merger, accretion-driven bulge growth makes the bulge evolve from toward profile shapes. Indeed, the evolution of the bulge surface brightness profiles is driven more by the puffing up of the bulge material by the absorption of orbital energy and angular momentum of the satellite than by the deposition of the satellite’s high-density cusp in the remnant center. We expect that the details of the central surface brightness profiles do depend on the shape of the central density profile of the satellite (eg. compare the central profiles of H1R to K1R, and H3R to K3R, Fig. 3), but the effects on are small. We do not make quantitative predictions on the resulting central densities because our King models deviate from exponentials within , and because softening limits the ability of the models to accurately reproduce central densities.


| Model | Code | Inclin (deg) | ||||
|---|---|---|---|---|---|---|
| (1) | (2) | (3) | (4) | (5) | (6) | (7) |
| 1 | H1D | 1 | 0.243 | -0.001 | 0.222 | 30 |
| 2 | H1R | 1 | 0.243 | -0.001 | 0.222 | 150 |
| 3 | H3D | 0.333 | 0.102 | -0.025 | 0.227 | 30 |
| 4 | H3R | 0.333 | 0.102 | -0.025 | 0.227 | 150 |
| 5 | H6D | 0.167 | 0.068 | -0.115 | 0.219 | 30 |
| 6 | H6R | 0.167 | 0.068 | -0.115 | 0.219 | 150 |
| 7 | L1D | 1 | 0.347 | -0.011 | 0.222 | 30 |
| 8 | K1R | 1 | 0.243 | -0.001 | 0.222 | 150 |
| 9 | K3R | 0.333 | 0.102 | -0.025 | 0.227 | 150 |
Description of the columns: (1) Model number. (2) Model code. (3) Initial mass ratio between satellite and bulge. (4) Initial half-mass radius of the satellite. (5) and (6) Radial and tangential velocity components of the relative orbit. (7) Initial angle between the orbital angular momentum and the disk spin.
Mixing of the initial populations occurs not only due to heating but also because the radial redistribution of disk material toward the center makes some material initially belonging to the disk to be interpreted by the observer as belonging to the bulge when fitting the disk with a standard exponential profile. This mixing may contribute to the extreme color similarity between bulges and inner disks (Terndrup et al. 1994, Peletier & Balcells 1996). Mixing does not occur at the very center, where the satellite core ends up, hence on purely stellar dynamical grounds we should expect a color signature there. Detailed interpretation however is made uncertain due to the presence of dust and star forming processes. The color structure in the inner few 100 pc of bulges is now known to be far from simple, with steep reddening profiles and hidden star formation processes revealed by HST/NICMOS-WFPC2 imaging (Peletier et al. 1999). Gas in the disk, not modeled in our simulations, is likely to respond more violently to the accretion and pile up at the center (Barnes & Hernquist 1996) probably triggering star formation and chemical enrichment.
The results are somewhat affected by the choices made for the simulation, such as the bulge rotation, the satellite rotation or the types of merger orbit. Rotation in the initial bulge, not included in our models, would probably make the prograde and the retrograde cases more different from each other, broadening the range of evolution vectors in Figure 6. Otherwise, rotation is not likely to significantly affect the evolution of . Differences may occur if the bulge, or the satellite, had a central black hole. Massive black holes are now virtually confirmed in a number of galaxies, and they might be by-products of the initial formation of the bulge (Rees 1993). Central black holes would probably affect both the final density profile and the rotation of remnant. Modeling disk galaxy mergers with smaller initial bulges would be interesting, although difficult computationally.
| Model | Code | Bulge | Disk | B/D | |||||
|---|---|---|---|---|---|---|---|---|---|
| (1) | (2) | (3) | (4) | (5) | (6) | (7) | (8) | ||
| Initial | … | 0.040.05 | 0.210.02 | 1.050.13 | -0.80 0.03 | 1.00.03 | 0.51 | ||
| 1 | H1D | -0.050.01 | 0.230.01 | 4.030.11 | -1.23 0.02 | 1.630.08 | 1.26 | ||
| 2 | H1R | -0.210.06 | 0.230.01 | 4.300.23 | -1.03 0.04 | 1.200.07 | 0.92 | ||
| 3 | H3D | -0.200.03 | 0.240.05 | 2.350.15 | -1.12 0.05 | 1.450.05 | 0.72 | ||
| 4 | H3R | -0.180.04 | 0.220.03 | 2.510.09 | -0.90 0.03 | 1.110.06 | 0.85 | ||
| 5 | H6D | -0.120.02 | 0.210.01 | 1.530.12 | -0.96 0.01 | 1.190.03 | 0.53 | ||
| 6 | H6R | -0.180.03 | 0.200.02 | 1.650.16 | -0.92 0.06 | 1.130.04 | 0.43 | ||
| 7 | L1D | -0.010.01 | 0.210.02 | 1.030.11 | -0.89 0.07 | 1.120.03 | 0.51 | ||
| 8 | K1R | -0.050.02 | 0.230.02 | 4.010.13 | -0.90 0.03 | 1.050.02 | 1.24 | ||
| 9 | K3R | -0.100.03 | 0.230.04 | 2.530.17 | -0.90 0.02 | 1.060.03 | 0.88 | ||
Description of the columns: (3) Bulge effective surface density, (4) Bulge effective radius, (5) Bulge profile index, (6) Disk central intensity, (7) Disk scale length, (8) Bulge-to-disk final mass ratio as derived from the Sersic plus exponential double fit.
The lack of bulge initial rotation and the higher density of the satellite both contribute to making counterrotation more prevalent in the models than they are likely to be in reality, and it is not a prediction of our models that half of all bulges should contain counterrotating components. Quantifying merger-induced bulge counterrotation will require a comprehensive set of simulations that include a realistic distribution of satellite orbit orientations (Zaritsky et al. 1997).
The accretion of dense satellites is less effective in making the bulge’s effective radius grow than it is at making the disk scale length grow (Table 3 from absorption of orbital energy and angular momentum. The decrease of with each merger is at odds with the observed increase of toward early types in real galaxies (Graham & Prieto 1999). Two explanations for this mismatch are possible. First we note that the dense satellites deposit most of their mass in the center of the bulge, while the low density model (LD1) deposits all of its mass outside the bulge. We may envision that for intermediate density satellites the mass is deposited throughout the bulge driving a stronger increase in the bulge’s . Second, we discuss below that the surviving disk in in fact a thick disk. De Grijs & Peletier (1997) measure the scale lengths of thick and thin disks in edge-on galaxies, showing that . This may explain that decreases in our models, where , while it increases in real galaxies, where .
The disks thicken during the process. The exact values shown in Fig. 10 are sensitive to the choice of energy and inclination of the initial orbits, with higher thickening expected of more inclined, and more energetic, orbits. Discussion of the disk vertical heating effects are beyond the scope of this paper, and are extensively addressed in eg. QHF93. Our thickening results are similar to theirs, and may be interpreted as indicating that the merger contributes to the growth of a thick disk. Lowering the satellite mass to reduce the impact on the disk helps a bit. Our low-mass satellites impart less damage to the disk. But their effect on the surface density of the bulge is also limited ( to ). It is plausible, but not obvious a priori, that a sequence of such mergers may drive to keep growing. Lowering the satellite mass even further is of limited use, as dynamical friction becomes inefficient. Satellites with mass 0.1 times the bulge mass have merger times approaching one Hubble time. We ran a multi-merger case in which 10 satellites with mass 0.1 times the bulge mass evolved around the disk galaxy. Weak dynamical friction and satellite-satellite interactions prevented the merger over one Hubble time.
Therefore, disk thickening is probably unavoidable, and, because we start out with an already formed disk, the present scenario of bulge growth is variation on the ”bulge before the disk” theme. Indeed, for such galaxy to match present day disk galaxies, a thin disk must be rebuilt out of the gas remaining after the last merger. The formation of the thick disk is itself not a problem for this scenario, as thick disks are present in early type disk galaxies and absent in late-types (de Grijs & Peletier 1997).
Merger-driven bulge formation prior to the disk (e.g. Kauffmann et al. 1994) is at odds with the fact that Sc and later-type spirals have exponential bulges: our experiments indicate that exponential bulges are extremely fragile against accretion and merging. The seeds of the central bulges of spiral galaxies must be given by events unrelated to accretion of smaller galaxies.
The efficiency of the increase of (Fig. 6) places limits on the fractional growth of bulges by collisionless accretion of dense satellites. Our results suggest that collisionless accretion of dense satellites bear the signature of a non-exponential bulge surface density profile. Such signature lends itself to tests requiring imaging data only, hence can be be used to constrain the merger history of galaxies at high cosmological distances.
7 Summary
The collisionless accretion of dense satellites onto disk galaxies drives the growth of the bulge and an increase in the index of the Sersic fit to the bulge surface density profile. The mass of the bulge and grow proportional to the satellite mass. A single merger with a satellite as massive as the bulge forms an bulge. The range of values obtained in the models matches that observed in bulges by APB95, which points at accretion as a simple way of setting up the APB95 relation. These results support the idea that bulges of late type spirals which show exponential surface brightness profiles can evolve to bulges of early type galaxies with by mergers with satellites galaxies.
We predict a fair amount of population mixing by expansion of the bulge material and piling up of disk material to the center.
The rotation curves of the merger remnants are steeper for more massive bulges, in accordance with observations. Retrograde mergers may lead to counterrotating bulges.
The models predict that thick disks form as by-products of the evolution toward larger B/D, in accordance with the presence of thick disks in S0 and Sa disk galaxies. Matching to present day galaxies requires the rebuilding of a thin disk out of remaining gas.
The efficient transformation of exponential bulges by accretion suggests that collisionless mergers at high- are not responsible for the structure of bulges of late-type spirals.
7.1 Acknowledgments
JALA was supported by grant 20-56888.99 from the Schweizerischer Nationalfonds.
References
- (1) Abraham, R. G., Ellis, R. S., Fabian, A. C., Tanvir, N, R., Glazebrook, K. 1999, MNRAS, 303, 641
- (2) Andredakis, Y. C., 1998, MNRAS, 295, 725.
- (3) Andredakis, Y. C., Peletier, R. F. & Balcells, M., 1995, MNRAS, 275, 874 (APB95)
- (4) Balcells, M., González, A. C. 1998, ApJ, 505, L112
- (5) Balcells, M., Peletier, R. F. 1994, AJ, 104, 135 (BP94)
- (6) Balcells, M., Quinn, P. J. 1990, ApJ, 361, 381
- (7) Barnes, J. E. 1988, ApJ, 331, 699
- (8) Barnes, J. E., Hernquist, L. 1991, ApJ, 370, L65
- (9) Barnes, J. E., Hernquist, L. 1996, ApJ, 471, 115
- (10) Barnes, J. E., Hut, P. 1986, Nature, 324, 446
- (11) Bouwens, R. J., Cayon, L., Silk, J. 1999, ApJ, 516, 77
- (12) Carollo, C. M. 1999, ApJ, 523, 566
- (13) Considere, S., Davoust, E. 1991, A&A, 252, 56
- (14) Domínguez-Tenreiro, R., Sáiz, A., Tissera, P. B. 1999, Ap. Sp. Sc., 263, 35
- (15) de Grijs, R. 1998, MNRAS, 299, 595
- (16) de Grijs, R., Peletier, R. F. 1997, A&A, 320, L21
- (17) de Jong, R. S. 1995, A&AS, 118, 557
- (18) Dubinski, J. 1998, ApJ, 502, 141
- (19) Gerhard, O. 1981, MNRAS, 197, 179
- (20) Gilmore, G. & Wyse, R. F. G. 1998, AJ, 116, 748.
- (21) Graham, A. W., Prieto, M. 1999, ApJ, 524, L23
- (22) Guthrie, B. N. G. 1992, A&AS, 93, 255
- (23) Heller, C. H. & Shlosman, I., 1994, ApJ, 424, 84.
- (24) Heller, C. H., 1991, PhDT Yale Univ.
- (25) Hernquist, L. 1987, ApJS, 64, 715
- (26) Hernquist, L. 1990a, ApJ, 356, 359
- (27) Hernquist, L. 1990b, J. Comput. Phys., 87, 137
- (28) Hernquist, L. 1993, ApJ, 409, 548
- (29) Hernquist, L., Katz, N. 1989, ApJS, 70, 419
- (30) Huang, S. & Carlberg, R. G., 1997, ApJ, 480, 503
- (31) Kauffmann, G., Guiderdoni, B., White, S. D. M. 1994, MNRAS, 267, 981
- (32) Kuijken, K. & Dubinski, J., 1994, MNRAS, 269, 13.
- (33) Kuijken, K. & Dubinski, J., 1995, MNRAS, 277, 1341.
- (34) Kuijken, K., Fisher, D., Merrifield, M. R. 1996, MNRAS, 283, 543
- (35) Kuijken, K., Merrifield, M. R. 1993, MNRAS, 264, 712
- (36) Marleau, F. R., Simard, L. 1998, ApJ, 507, 585
- (37) Majewski, S. R. 1992, ApJ Suppl., 78, 87
- (38) Mihos, J. C., Hernquist, L. 1994, ApJ, 425, L13
- (39) Mihos, J. C., Walker, I. R., Hernquist, L., Mendes de Oliveira, C., Bolte, M. 1995, ApJ, 447, L87
- (40) Moore, B., Katz, N., Lake, G., Dressler, A., Oemler, A., Jr. 1996, Nature, 379, 613
- (41) Norris, J. E., Ryan, S. G. 1989, ApJ, 336, L17
- (42) Peletier, R. F., Balcells, M. 1996, AJ, 111, 2238
- (43) Peletier, R. F., Balcells, M. 1997, NewAst, 1(4), 349
- (44) Peletier, R. F., Balcells, M., M., Davies, R. L., Andredakis, Y. C., Vazdekis, A., Burkert, P., Prada, F. 1999, MNRAS, 310, 703
- (45) Prada, F., Gutierrez, C. M., Peletier R. F, Mckeith C. D., 1996, ApJ, 463, L9
- (46) Pfenniger, D., Norman, C. 1990, ApJ, 363, 391
- (47) Prieto, M., Aguerri, J. A. L., Varela, A. M. & Muñoz-Tuñón, C., 2000, A&A, in press
- (48) Quinn, P. J., Hernquist, L., Fullagar, D. P. 1993, ApJ, 403, 74 (QHF93)
- (49) Quinn, P. J. & Goodman, J. 1986, ApJ, 309, 472.
- (50) Ratnatunga, K. U., Griffiths, R. E., Ostrander, E. J. 1998, 118, 86
- (51) Rees, M. 1993, Proc.Nat.Acad.Sci., 333, 523
- (52) Schade, D., Lilly, S. J., Le Fevre, O., Crampton, D. 1996, ApJ, 464, 79
- (53) Sérsic, J. L. 1968, Atlas de galaxias australes, Observatorio Astronómico, Córdoba
- (54) Silchenko O. K., Vlasyuk, V. V., Burenkov A. N. 1997, A&A, 326, 941
- (55) Thakar, A. R., Ryden, B. S. 1996, ApJ, 461, 55
- (56) Tóth, G., Ostriker, J. P. 1992, ApJ, 389, 5
- (57) van Albada, T. S. 1982, MNRAS, 201, 939
- (58) Velazquez, H. & White, S. D. M., 1999, MNRAS, 304, 254
- (59) Wyse, R. F. G., Gilmore, G., Franx, M. 1997, ARAA, 35, 637
- (60) Walker, I. R., Mihos, J. C. & Hernquist, L., 1996, ApJ, 460, 121