submitted to The Astrophysical Journal Letters
On Ultrasmall Silicate Grains in the Diffuse Interstellar Medium
Abstract
The abundance of both amorphous and crystalline silicates in very small grains is limited by the fact that the 10m silicate emission feature is not detected in the diffuse ISM. On the basis of the observed IR emission spectrum for the diffuse ISM, the observed ultraviolet extinction curve, and the 10m silicate absorption profile, we obtain upper limits on the abundances of ultrasmall () amorphous and crystalline silicate grains. Contrary to previous work, as much as 20% of interstellar Si could be in silicate grains without violating observational constraints. Not more than 5% of the Si can be in crystalline silicates (of any size).
1 Introduction
The idea of interstellar silicate grains can be traced back to the 1960’s when Kamijo (1963) first proposed that SiO2, condensed in the atmospheres of cool stars and blown out into the interstellar space, could provide condensation cores for the formation of “dirty ices”. It was later shown by Gilman (1969) that grains around oxygen-rich cool giants are mainly silicates such as Al2SiO3 and Mg2SiO4. Silicates were first detected in emission in M stars (Woolf & Ney 1969; Knacke et al. 1969), in the Trapezium region of the Orion Nebula (Stein & Gillett 1969), and in comet Bennett 1969i (Maas, Ney, & Woolf 1970); in absorption toward the Galactic Center (Hackwell, Gehrz, & Woolf 1970), and toward the Becklin-Neugebauer object and Kleinmann-Low Nebula (Gillett & Forrest 1973). Silicates are now known to be ubiquitous, seen in interstellar clouds, circumstellar disks around young stellar objects (YSOs), main-sequence stars and evolved stars, in HII regions, and in interplanetary and cometary dust.
The observed broad, featureless profile of the 10m Si-O stretching mode indicated that interstellar silicates are predominantly amorphous. With the advent of Infrared Space Observatory (ISO) and the improved ground-based spectrometers, the presence of crystalline silicates has been revealed in six comets (see Hanner 1999 for a summary), in dust disks around main-sequence stars (see Artymowicz 2000 for a summary), YSOs, and evolved stars (see Waelkens, Malfait, & Waters 2000 for a summary), in interplanetary dust particles (IDPs) (Bradley et al. 1999), and probably also in the Orion Nebula (Cesarsky et al. 2000).
If silicate grains with radii – which we will refer to as “ultrasmall” – are present, single-photon heating by starlight (Greenberg 1968) will cause these grains to radiate in the 10 feature (see, e.g., Draine & Anderson 1985). The absence of a 10 emission feature in IRAS spectra led Désert et al. (1986) to conclude that not more than 1% of Si could be in silicate grains, and on this basis recent grain models (Duley, Jones, & Williams 1989; Désert, Boulanger, & Puget 1990; Siebenmorgen & Krügel 1992; Mathis 1996; Li & Greenberg 1997; Dwek et al. 1997; Weingartner & Draine 2001; Li & Draine 2001) have excluded ultrasmall silicate grains as a significant grain component. Nondetection of the 10m silicate emission feature in the diffuse ISM by ISO (Mattila et al. 1996) and the Infrared Telescope in Space (IRTS) (Onaka et al. 1996) appeared to confirm this conclusion.
However, the presence of ultrasmall silicate grains can not be ruled out since the 10m silicate emission feature may be hidden by the dominant PAH features. In this Letter we place quantitative upper limits on the abundances of both amorphous and crystalline ultrasmall silicate grains by calculating spectra for such tiny grains heated by starlight, and comparing to measurements of the infrared (IR) emission of the diffuse ISM by IRTS (Onaka et al. 1996) and by the Diffuse Infrared Background Experiment (DIRBE) instrument on the Cosmic Background Explorer (COBE) satellite. The interstellar extinction curve and the 10m silicate absorption profile are also invoked to provide further constraints.
In §2 we discuss the optical and thermal properties of crystalline silicate material. In §3 we calculate the IR emission spectra of ultrasmall silicate grains and deduce upper limits on their abundances based on the constraints provided by the observed IR emission spectrum (§3.1), by the interstellar extinction curve (§3.2), and by the 10m silicate absorption profile (§3.3). In §4 we discuss the effects of dust size distributions and the sources of uncertainty. §5 summarizes our main conclusions.
2 Optical and Thermal Properties of Amorphous and Crystalline Silicates
We approximate the grains as spherical and use Mie theory to calculate their absorption and scattering properties. The complex refractive index of amorphous silicates is taken from Draine & Lee (1984).
For crystalline silicates, we proceed as follows: for m, we take from Huffman & Stapp (1973) for crystalline olivine (Mg,Fe)2SiO4; for , we take from “astronomical silicate” (Draine & Lee 1984); for , we take from Mukai & Koike (1990) for crystalline olivine Mg1.8Fe0.2SiO4; for m, we assume . The real part is obtained from using the Kramers-Kronig relation.
The specific heat of amorphous silicates is taken from Draine & Li (2001). For crystalline silicates, following Draine & Li (2001), we adopt a three-dimensional Debye model with K which closely reproduces the specific heat of crystalline Mg2SiO4 measured by Robie, Hemingway, & Takei (1982).
3 Upper Limits on Ultrasmall Silicate Grains
3.1 IR Emission Spectra
We will now derive upper limits on the abundances of ultrasmall silicate grains in the diffuse ISM based on comparison of the observed IR emission spectrum with the calculated emission spectrum of ultrasmall silicate grains. For this purpose, we require a line-of-sight with: 1) a good quality mid-IR emission spectrum; and estimates of 2) the starlight intensity (relative to the Mathis, Mezger, & Panagia [1983] radiation field), and 3) the hydrogen column density .
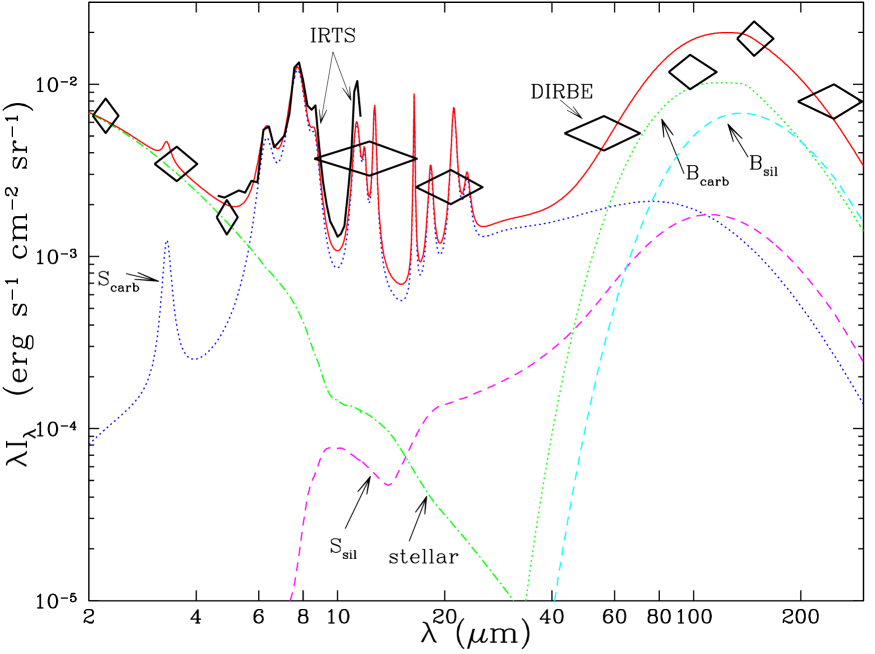
The diffuse ISM toward , has been observed by DIRBE (Hauser et al. 1998) and the Mid-Infrared Spectrograph (MIRS) on IRTS (Onaka et al. 1996) has obtained the 4.7–11.7m spectrum. Li & Draine (2001) have modelled the IR emission from the dust in this direction. In Figure 1 we show the observed photometry and mid-IR spectrum together with the Li & Draine (2001) model, with a total gas column , and a mixture of carbonaceous grains and silicate grains heated by starlight with . This model is seen to be in good agreement with the PAH emission features seen by IRTS, as well as the DIRBE photometry. The total power radiated constrains the product , while the 100 wavelength of peak emission constrains .
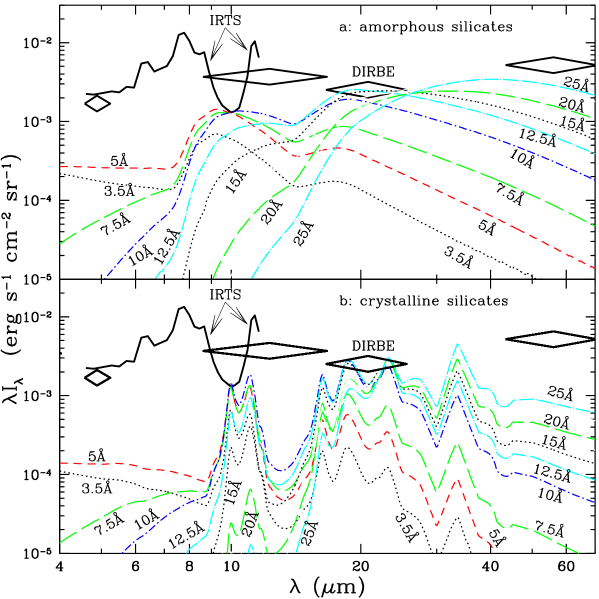
Lacking a priori expectations concerning the form of the size distribution for ultrasmall silicate grains, we first consider grains of a single size (radius of an equal-volume sphere). Suppose a fraction of the total silicon abundance (Si/H ; Grevesse & Sauval 1998) is contained in amorphous silicate grains of radius . Applying the thermal-discrete method developed in Draine & Li (2001), we calculate the energy probability distribution function and the resulting IR emission spectrum. The resulting emission spectra are shown in Figure 2, where for each size the value of has been chosen such that this abundance of ultrasmall amorphous silicate grains would not – by itself – exceed the observed emission at any wavelength. Grains with are heated by energetic photons to “temperatures” high enough to emit in the 10 silicate feature, and their abundances are thus limited by the IRTS spectrum. For grains with the emission peak shifts to longer wavelength, and the DIRBE 25 data provides stronger constraints.
From Figure 2a it can be seen that, for , even if a fraction were in the form of amorphous silicates, the resulting 10m Si-O emission feature would not have been apparent in the IRTS spectrum. For , is permitted. For , the DIRBE 25 photometry allows up to , and for , .
Similarly, we can estimate for ultrasmall crystalline silicate grains. As shown in Figure 2b, crystalline Mg1.8Fe0.2SiO4 has pronounced features at 10.0, 11.1, 16.3, 18.6, 23.0 and 33.6m. For , nondetection of the 10.0 feature implies . For , an upper limit is imposed by the DIRBE 25m data, and for , . Interstellar crystalline silicates could presumably differ from the crystalline olivine Mg1.8Fe0.2SiO4 considered here, resulting in changes in the strengths and positions of the infrared resonances (e.g., see Jäger et al. 1998 for different crystalline silicate samples). Observations of comet Hale-Bopp (see Hanner 1999) showed an emission feature at 11.2 rather than 11.1, and an emission feature at , evident in some spectra, was not always apparent. Our limits on crystalline silicates relied on the strength and position of the 10.0 feature; since this feature in interstellar crystalline silicates might be either weaker or shifted in wavelength, it is appropriate to weaken our upper limits for to . Below we will find that the 10 absorption profile provides a more restrictive limit on crystalline silicates.
3.2 Ultraviolet Extinction Curve
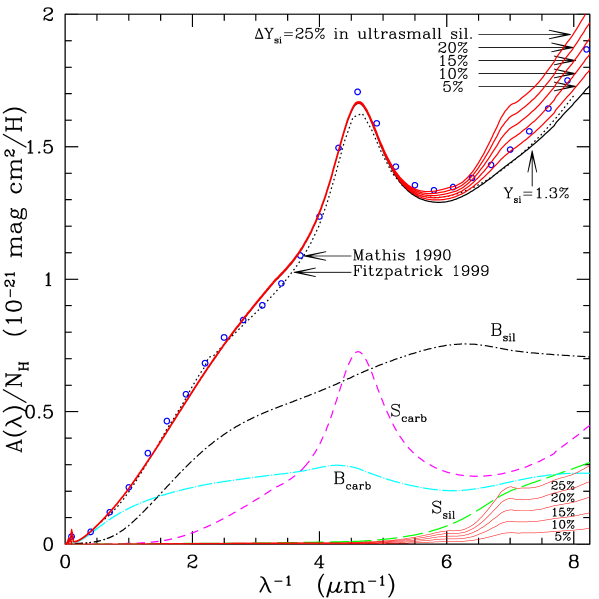
Ultrasmall silicate grains make a steeply-rising contribution to the ultraviolet (UV) extinction. Weingartner & Draine (2001) and Li & Draine (2001) have obtained a carbonaceous-silicate grain model which reproduces both the observed extinction and the observed infrared emission. This grain model has only a small abundance of ultrasmall () silicate grains. In Figure 3 we show the extinction obtained by adding ultrasmall silicate grains to this model. Since the ultrasmall grains are in the Rayleigh limit, the added extinction depends only on (independent of grain size), and applies to both crystalline and amorphous silicates since their optical properties at are taken to be similar (see §2).
As expected, the contribution to the region would be considerable for % (although the effects on the optical and near-UV extinction are negligible). In view of (1) the uncertainties in the observed interstellar extinction in this wavelength region (for example, the determinations of Mathis [1990] and Fitzpatrick [1999] differ from one other by ), (2) the fact that the size distributions of other components (carbonaceous grains and silicates) could be adjusted to reduce their contribution to the far-UV rise, and (3) the possibility that a mixture of ultrasmall silicates (both neutral and charged) might have a more gradual onset of UV absorption than our adopted silicate dielectric function (which has a relatively sharp increase in absorption near 6.5–7.0), it seems clear that the observed UV extinction does not rule out as large as on lines of sight with .
3.3 Silicate Absorption Profiles
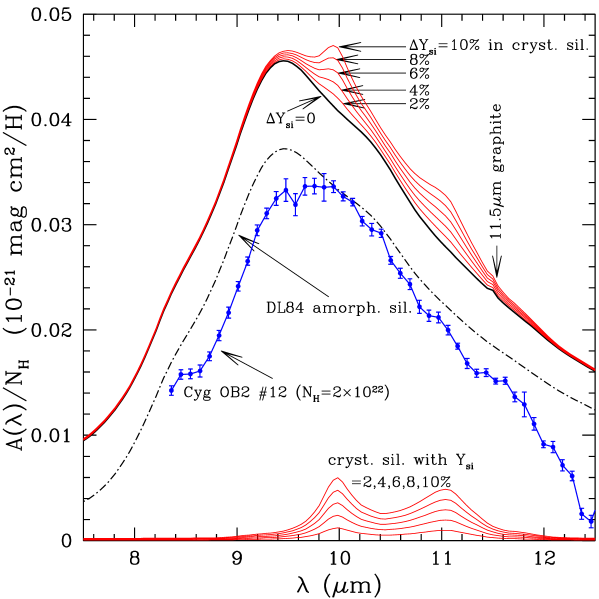
The 10m silicate absorption feature provides another constraint on the abundance of crystalline silicate grains of any size. A recent high signal-to-noise spectroscopic study of lines of sight towards Cyg OB2 # 12 (diffuse ISM), Elias 16 (quiescent molecular cloud) and Elias 18 (embedded YSO) in the Taurus dark cloud appears to rule out any narrow absorption features between 8.4 and 12.5m (Bowey et al. 1998). Figure 4 plots the 10m silicate absorption profiles resulting from addition of various amounts () of ultrasmall crystalline silicates to our best-fitting model (see Weingartner & Draine 2001; Li & Draine 2001). The absence of narrow features near 10.0 and 11.1 in the observed 8.4–12.5 extinction (Bowey et al. 1998) suggests an upper limit for crystalline silicates. Note that this result is insensitive to size as the grains are in the Rayleigh limit.
As noted above, the precise wavelengths and strengths of IR resonance features in crystalline silicates vary with composition, and there could be more than one crystalline form present in the interstellar medium. Nevertheless, the lack of fine structure in the observed broad 10 absorption feature makes it unlikely that more than of the interstellar Si could be in crystalline silicates. This limit on crystalline silicates is more stringent than the limit on ultrasmall crystalline silicates obtained in §3.1.
4 Discussion
The upper limits on the abundances of ultrasmall silicate grains estimated from the IR emission spectra in §3.1 are for grains of a single size. Adopting a log-normal size distribution , we have calculated emission spectra for various and . For this distribution, peaks at . For each distribution, we determined the maximum value of such that the infrared emission did not exceed either the IRTS 4.7–11.7 spectrum or the DIRBE photometry. Results are shown in Table 1. It can be seen that increases with : for and , varies in the range of 20%–55%. We take to be the limit on silicate grains.
| 3Å | 0.3 | 3.9Å | 20% | 4Å | 0.3 | 5.2Å | 20% | 5Å | 0.3 | 6.5Å | 20% | 6Å | 0.3 | 7.9Å | 20% |
|---|---|---|---|---|---|---|---|---|---|---|---|---|---|---|---|
| 3Å | 0.4 | 4.8Å | 20% | 4Å | 0.4 | 6.5Å | 20% | 5Å | 0.4 | 8.1Å | 22% | 6Å | 0.4 | 9.7Å | 30% |
| 3Å | 0.5 | 6.4Å | 20% | 4Å | 0.5 | 8.5Å | 25% | 5Å | 0.5 | 10.6Å | 35% | 6Å | 0.5 | 12.7Å | 45% |
| 3Å | 0.6 | 8.8Å | 30% | 4Å | 0.6 | 11.8Å | 40% | 5Å | 0.6 | 14.7Å | 50% | 6Å | 0.6 | 17.7Å | 55% |
One uncertainty in our upper limit on ultrasmall amorphous silicates arises from uncertainty in the absorption cross section for where the interstellar starlight spectrum peaks. We have assumed the ultrasmall silicate grains to be characterized by the refractive index estimated for amorphous “astronomical silicates” (Draine & Lee 1984; Weingartner & Draine 2001). We note that the visual absorptivity of crystalline olivine material is sensitive to its Fe content. If – as suggested by the low Fe content observed in some circumstellar environments (see Waelkens et al. 2000) and in comet Hale-Bopp (Crovisier et al. 1997) – crystalline astronomical silicate material is less absorbing than “astronomical silicate” (Draine & Lee 1984), then photon absorptions will be less frequent and the IR emission correspondingly reduced, in which case the infrared emission limit on ultrasmall silicates would be relaxed. However, for crystalline silicates, the strongest constraint comes from lack of sharp absorption features near 10 and 11, so our upper limit is not affected by uncertainty in the 1–4 absorption.
The observed 3.3, 6.2, 7.7, 8.6, and 11.3m emission bands (Mattila et al. 1996; Onaka et al. 1996) require a significant fraction of carbon in polycyclic aromatic hydrocarbon molecules with (the model of Li & Draine 2001 requires carbon atoms per H, or 10% of the total C abundance). In contrast, Désert et al. (1986) argued that not more than 1% of the Si could be in silicate particles with radii . Such a paucity of ultrasmall silicate grains would contrast sharply with the apparent large abundance of small carbonaceous particles. The present study, however, finds that as much as 20% of the Si could be locked up in ultrasmall silicate particles without violating any observational constraints.
We suspect that the analysis by Désert et al. (based on 2–13 observations of M82 and NGC 2023) underestimated the fraction of the absorbed starlight energy which is reradiated in the 6–12 PAH features. The present study is based on a line of sight with photometry extending to the far-infrared (see Figure 1).
5 Summary
Upper limits on the abundances of ultrasmall amorphous and crystalline silicate grains are estimated based on observed IR emission spectra (§3.1), the interstellar extinction curve (§3.2), and the 10m silicate absorption profile (§3.3). Our principal results are:
-
1.
For amorphous silicate grains, non-detection of the 10m silicate emission feature imposes an upper limit on the fraction of interstellar Si in very small silicate grains: for radii , and for , for , and for . For a distribution of sizes, in grains with . These limits are much higher than the earlier estimate by Désert et al. (1986) of for .
-
2.
The observed UV extinction curve in diffuse regions may allow as much as in ultrasmall silicate grains.
-
3.
For crystalline silicate grains, the absence of fine structure in the observed 10m silicate absorption profile provides the strongest constraint, limiting the abundances of crystalline silicate grains to .
Toward high galactic latitude “cirrus” both the radiation field and the hydrogen column density are known, but mid-IR spectroscopy is generally unavailable. In the near future, the Space Infrared Telescope Facility (SIRTF) may be able to obtain 5–40 spectra of cirrus regions to either detect silicate emission or obtain more rigorous upper limits on the abundances of very small silicate grains.
References
- (1) Artymowicz, P. 2000, Space Sci. Rev., 92, 69
- (2) Bowey, J.E., Adamson, A.J., & Whittet, D.C.B. 1998, MNRAS, 298, 131
- (3) Bradley, J.P., Keller, L.P., Snow, T.P., et al. 1999, Science, 285, 1716
- (4) Cesarsky, D., Jones, A.P., Lequeux, J., & Verstraete, L. 2000, A&A, 358, 708
- (5) Crovisier, J., Leech, K., Bockelee-Morvan, D., et al. 1997, Science, 275, 1904
- (6) Désert, F.X., Boulanger, F., Léger, A., Puget, J.L., & Sellgren, K. 1986, A&A, 159, 328
- (7) Désert, F.X., Boulanger, F., & Puget, J.L. 1990, A&A, 237, 215
- (8) Draine, B.T. 1984, ApJ, 277, L71
- (9) Draine, B.T., & Anderson, N. 1985, ApJ, 292, 494
- (10) Draine, B.T., & Lee, H.M. 1984, ApJ, 285, 89
- (11) Draine, B.T., & Li, A. 2001, ApJ, 550, 000 (astro-ph/0011318)
- (12) Duley, W.W., Jones, A.P., & Williams, D.A. 1989, MNRAS, 236, 709
- (13) Dwek, E., Arendt, R.G., Fixsen, D.J., et al. 1997, ApJ, 475, 565
- (14) Fitzpatrick, E.L. 1999, PASP, 111, 63
- (15) Gillett, F.C., & Forrest, W.J. 1973, ApJ, 179, L483
- (16) Gilman, R.C. 1969, ApJ, 155, L185
- (17) Greenberg, J.M. 1968, in Stars and Stellar Systems, Vol. VII, ed. B.M. Middlehurst & L.H. Aller (Chicago: Univ. of Chicago Press), 221
- (18) Grevesse, N., & Sauval, A.J. 1998, Space Sci. Rev., 85, 161
- (19) Hackwell, J.A., Gehrz, R.D., & Woolf, N.J. 1970, Nature, 227, 822
- (20) Hanner, M.S. 1999, Space Sci. Rev., 90, 99
- (21) Hauser, M.G., Kelsall, T., Leisawitz, D., & Weiland, J. 1998, COBE Diffuse Infrared Background Experiment Explanatory Supplement version 2.3, COBE Ref. Pub. No. 98-A (Greenbelt, MD: NASA GSFC), available in electronic form from the NSSDC
- (22) Huffman, D. & Stapp, J.L., 1973, in Interstellar Dust and Related Topics (IAU Symp. 52), eds. J.M. Greenberg, & H.C. van de Hulst (Dordrecht: Kluwer), 297
- (23) Jäger, C., Molster, F.J., Dorschner, J., Henning, Th., Mutschke, H., & Waters, L.B.F.M. 1998, A&A, 339, 904
- (24) Kamijo, F. 1963, PASP, 15, 440
- (25) Knacke, R.F., Gaustad, J.E., Gillett, F.C., & Stein, W.A. 1969, ApJ, 155, L189
- (26) Li, A., & Greenberg, J.M. 1997, A&A, 323, 566
- (27) Li, A., & Draine, B.T. 2001, submitted to ApJ (astro-ph/0011319)
- (28) Maas, R.W., Ney, E.P., & Woolf, N.J. 1970, ApJ, 160, L101
- (29) Mathis, J.S. 1990, ARA&A, 28, 37
- (30) Mathis, J.S. 1996, ApJ, 472, 643
- (31) Mathis, J.S., Mezger, P.G., & Panagia, N. 1983, A&A, 128, 212
- (32) Mattila, K., Lemke, D., Haikala, L.K., et al. 1996, A&A, 315, L353
- (33) Mukai, T., & Koike, C. 1990, Icarus, 87, 180
- (34) Onaka, T., Yamamura, I., Tanabe, T., et al. 1996, PASJ, 48, L59
- (35) Robie, R.A., Hemingway, B.S., & Takei, H. 1982, American Mineralogist, 67, 470
- (36) Siebenmorgen, R., & Krügel, E. 1992, A&A, 259, 614
- (37) Stein, W.A., & Gillett, F.C. 1969, ApJ, 155, L197
- (38) Waelkens, C., Malfait, K., & Waters, L.B.F.M. 2000, in Astrochemistry: From Molecular Clouds to Planetary Systems (IAU Symp. 197), ed. E.F. van Dishoeck (Dordrecht: Kluwer), in press
- (39) Weingartner, J.C., & Draine, B.T. 2001, ApJ, 548, 000 (astro-ph/0008146)
- (40) Whittet, D.C.B., Boogert, A.C.A., Gerakines, P.A., et al. 1997, ApJ, 490, 729
- (41) Woolf, N.J., & Ney, E.P. 1969, ApJ, 155, L181