Gas motions in the plane of the spiral galaxy NGC 3631
Abstract
The velocity field of the nearly face-on galaxy NGC 3631, derived from observations in the H line and Hi radio line, is analysed to study perturbations related to the spiral structure of the galaxy. We confirm our previous conclusion that the line-of-sight velocity field gives evidence of the wave nature of the observed two-armed spiral structure. Fourier analysis of the observed velocity field is used to determine the location of corotation of the spiral structure of this galaxy, and the radius of corotation is found to be about 42′′, or 3.2 kpc. The vector velocity field of the gas in the plane of the disc is restored, and taking into account that we previously investigated vertical motions, we now have a full 3D gaseous velocity field of the galaxy. We show clear evidence of the existence of two anticyclonic and four cyclonic vortices near corotation in a frame of reference rotating with the spiral pattern. The centres of the anticyclones lie between the observed spiral arms. The cyclones lie close to the observed spirals, but their centres are shifted from the maxima in brightness.
keywords:
galaxies: individual: NGC 3631 – galaxies: ISM – galaxies: kinematics and dynamics – galaxies: spiral – galaxies: structure – H line, 21 cm line: galaxies.1 Introduction
The branch of astronomy known as dynamics of galactic discs has acquired, through long years of development, an unquestionably classical status, but has so far evolved as a part of theoretical astrophysics (e.g., Fridman & Polyachenko 1984; Binney & Tremaine 1987). Observational data, which are the basis for dynamical investigations, have been up to now mostly one-dimensional: a mass distribution in a disc is usually reconstructed from a surface brightness profile and from a long-slit major-axis velocity profile or rotation curve. Such an approach leads dynamicists to suppose a strict axisymmetry of galactic discs. However, evidently the latter are not axisymmetric in general. Particularly, bars and spiral arms are a clear manifestation of such non-axisymmetry. Thus, in order to make dynamical analyses more reliable, one needs two-dimensional (2D) data.
With the advent of CCD detectors, 2D photometric studies began to appear. In particular, Kent (1984, 1985) has undertaken 2D decomposition of CCD images of galaxies and has determined a lot of exponential disc parameters. In a series of works Athanassoula and co-workers (Considère & Athanassoula 1988; García Gómez & Athanassoula 1993) have used an azimuthal Fourier analysis of images of galactic discs to reveal properties of their spiral structure, such as the number of arms and their pitch angle. Two-dimensional velocity fields, however, are rarely included into state-of-art dynamical investigations. The maximum yield obtained from such data is usually a rotation curve calculated in zero-order approximation of circular rotation, i.e. again under the assumption of axisymmetry. However, 2D velocity fields contain much more information.
The observed line-of-sight velocity of gas in spiral galaxies contains a contribution not only of the regular rotation, but also of the velocity perturbations due to the spiral density waves. In principle, an analysis of the velocity field enables one to separate all these components of gas motion, but this task is far from simple: the expected amplitude of the main harmonics related to wave motion is about one order of magnitude lower than the maximal velocity of rotation of a galaxy. In addition, the presence of both nonplanar oscillations of the gas along the rotation axis and local non-circular motions makes the observed velocity field very complicated and difficult to interpret. Although spiral-related perturbations of the gas motion were detected both in our Galaxy (Yuan 1969 and references therein) and in many external galaxies beginning with the classical work of Rots on M81 (1975), the amplitude of perturbed velocities and pattern angular velocity are badly known even for the best observed galaxies.
Different methods were proposed to determine kinematical parameters of density waves from the observed line-of-sight velocity fields (see Sakhibov & Smirnov 1987, 1989, 1990; Bonnarel et al. 1988; Canzian, 1993; Sempere et al. 1995; Schoenmakers et al. 1997; Westpfahl 1998 and references therein). However, all these methods have one or two principal shortcomings. First, they are based upon an alleged possibility to restore the equilibrium rotation velocity without the analysis of the residual velocities. Such a possibility exists if we deal with the results of a model experiment and know the form of the gravitational potential (exactly the case with Canzian’s 1993 investigation). However, when we analyse the line-of-sight velocity field of a real galaxy, independent restoration of the rotation curve becomes impossible (Lyakhovich et al. 1997; Fridman et al. 1997). A rotation curve determined in the frame of a model of pure circular motion has systematic errors of the order of the residual velocities, and thus the residual field built on the basis of this curve does not represent the real field of velocity perturbations caused by the density wave (Lyakhovich et al. 1997; Fridman et al. 1997). Second, all approaches mentioned above are based on the assumption of a 2D character of the galactic motion in a disc, whereas any real galactic disc is a 3D object and regular motions induced by a density wave are also three dimensional in principle (Fridman et al. 1997; Fridman et al., 1999). Thus the only direct approach to analyse the observed velocity field is to seek for self–consistent solutions for the full vector velocity field. In other words, the rotation velocity and all three components of the perturbed velocity should be determined simultaneously from the analysis of observational data, taking into account the 3D nature of the galactic discs.
A recent attempt to restore the complete (three component) vector velocity field in the gaseous discs of grand-design galaxies from the observed field of line-of-sight velocities (Lyakhovich et al. 1997; Fridman et al. 1997), gave us a hope to build, in the future, an observationally-based foundation of the dynamics of the galactic discs. The knowledge of the complete velocity field gives us at once (1) rotation curve, (2) all the basic resonances: Lindblad and corotational, and (3) knowledge of the residual velocity field, containing recently discovered structures such as giant anticyclones (Fridman et al. 1997) and cyclones (Fridman et al. 1999), the “constituent parts” of the spiral density waves. Finally, knowledge of the complete velocity field helps to determine the collective process — a kind of instability — which is responsible for the spiral–vortex structure of a given disc. Thus, we can state without risk of exaggeration that the observed velocity field provides the necessary observational base for the construction of the dynamical portrait of a galaxy under consideration.
The aim of the present article is to restore and analyse the velocity field of the gaseous disc of the grand–design galaxy NGC 3631, for which two types of line-of-sight velocity data were obtained, well complementing each other: in the radio Hi and optical H lines (see below). The Hi observations used for this study were obtained by Knapen (1997) with the Westerbork Synthesis Radio Telescope, and the H observations were carried out at the Special Astrophysical Observatory (SAO) with its 6-m reflector equipped with an F/2.4 focal reducer and a scanning Fabry–Perot interferometer.
NGC 3631 is a rather bright non-barred galaxy with well-defined spiral structure. Its optical axial ratio is close to unity: according to the RC3 catalogue (Vaucouleurs et al. 1991), , so this galaxy looks nearly face-on. Such an orientation is very favourable for studying gas motions perpendicular to the plane of the galaxy, which was the main topic of our previous paper (Fridman et al., 1998, referred hereafter as Paper I).
In Paper I we showed that non-circular gas motions in NGC 3631 have a regular character, and that they are related to the observed two-armed spiral structure, which has a wave nature. The vertical (that is perpendicular to the plane of the disc) component of the gas motions as revealed by a Fourier analysis method (Fridman et al. 1997), was also found to be induced by the spiral density wave. The inclination angle of the disc of NGC 3631 was found to be about , which enables, using the same observational data, the restoration of the vector velocity field in the plane of this galaxy, which is the main objective of the present paper.
NGC 3631 is a grand-design spiral galaxy of type SAc, at a distance of 15.4 Mpc, as estimated from its recession velocity using a Hubble constant of 75 km s-1 Mpc-1, which gives an angular scale of 75 pc per arcsec. Interestingly, the galaxy has been included in Arp’s (1966) atlas of peculiar galaxies, thanks to its “straight arms”, and “absorption tube crossing from inside to outside of southern arm”. These features can be recognised in the -image shown in Fig. 1, but the galaxy as a whole looks to us rather normal. The atomic hydrogen distribution has been described by Knapen (1997 and references therein to earlier work), and the ionized hydrogen has been studied through emission in the H line by, among others, Boeshaar & Hodge (1977), Hodge (1982) and Rozas, Beckman & Knapen (1996).
In Section 2 the results of a Fourier analysis of the observed distributions of optical (H and -band) surface brightness and of Hi surface density are given, and compared with a Fourier analysis of azimuthal distributions of the observed line-of-sight velocities. Section 3 presents a model of large-scale gas motion, in which we assume that the gas rotates in the galactic plane, and simultaneously participates in the perturbed 3D–motions caused by the two-armed density wave. The latter fact allows us to restrict the expansion of the line-of-sight velocity field to the first three Fourier harmonics () (Fridman et al. 1997). Two independent methods are used to determine the positions of corotation and other resonances, based on the relationships between the phases of azimuthal and radial oscillations of the perturbed velocity and the phase of the perturbed surface density. In Section 4 we then proceed to restore the vector velocity field of the gas in the plane of the disc. We show that in a frame of reference corotating with the spiral density wave pattern, giant cyclones exist alongside anticyclones near the corotation radius. Anticyclones were described in our earlier work (Fridman et al. 1997), whereas cyclones were predicted (Fridman et al. 2000) in those gaseous galactic discs in which the gradient of the azimuthal residual velocity exceeds the gradient of the rotation velocity in the reference frame corotating with spirals. We briefly summarize our main conclusions in Section 5.
We refer to Paper I for a description of the observations which are used in this work.
2 Spiral structure of NGC 3631
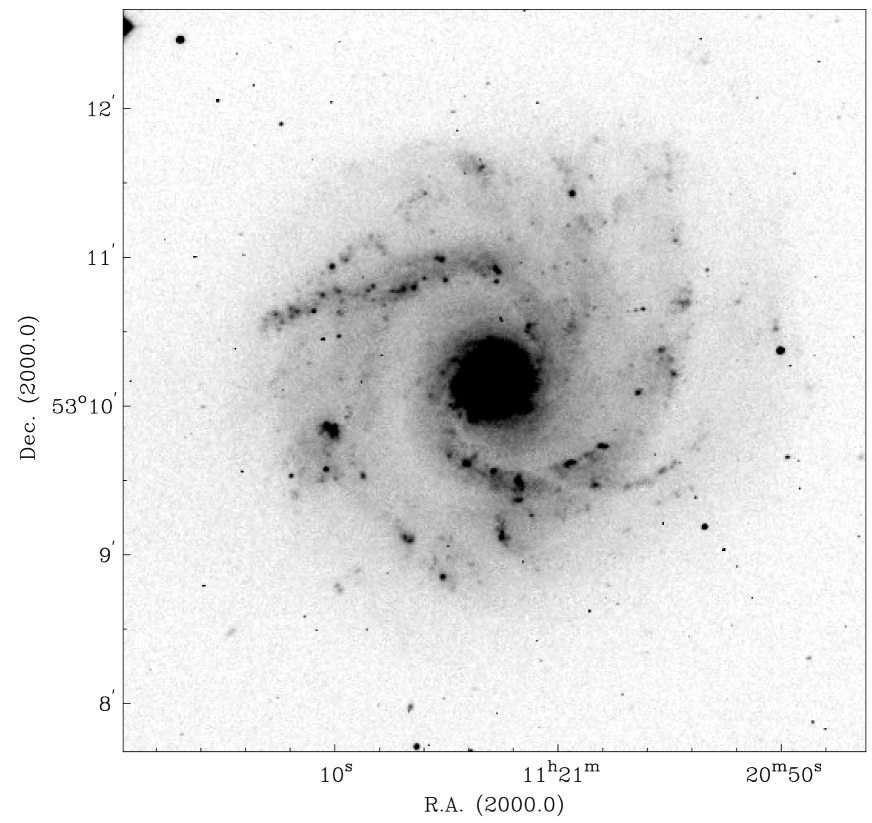
Although the two-armed spiral structure of NGC 3631 is well defined in optical light, it has a number of irregularities, especially in the outer parts of the disc. The Hi map has much lower angular resolution than optical images, yet it also clearly shows evidence of the two-armed spiral structure (Knapen 1997). For the purpose of our study we should be convinced that the second harmonic of the brightness, , of the spiral structure exceeds all other harmonics. To check this, we divided the galactic disc into elliptical rings, corresponding to circular rings after deprojection, and carried out a Fourier analysis of the azimuthal brightness distribution, using an H image of NGC 3631 obtained at the SAO 6-m telescope through interferometric observations (Paper I), an -band image of the galaxy, as obtained from the Isaac Newton Group (ING) archive, and the neutral hydrogen distribution, as obtained from 21 cm observations (Knapen 1997). We show the -band image, taken with the 1-m Jacobus Kapteyn Telescope, in Fig. 1, which outlines the main spiral arm structure in this galaxy. Technical information on this image can be found in Knapen (1997). The series of histograms in Fig. 2 shows the contributions of the different Fourier harmonics to the deviation from an axially symmetrical distribution of brightness, or dispersion, for the three images mentioned above. Throughout the paper, we restrict our consideration to the region of the galactic disc which corresponds to the extent of the optical spirals.
Fig. 2 shows clearly that the second harmonic, which corresponds to the observed two-armed structure, indeed dominates the spectrum. The high level of the first harmonic in the H image is caused by the non-symmetrical distribution of star-forming regions in the spiral arms, and does not reflect the true contribution of the first Fourier harmonic to the mass distribution in the galaxy. This assumption is supported by the low level of the first harmonic in the -band image and the Hi map. To demonstrate this yet more clearly, we show in Fig. 3 the existence of a tight correlation between lines of maximum values of the second harmonic in the - and H images (top panel), and a very weak correlation between points and lines of maximum values of the first harmonics (bottom panel).


As shown earlier (Sakhibov & Smirnov 1989; Canzian 1993; Fridman et al. 1997), if the circular velocity of gas in a galaxy is perturbed by a two-armed spiral pattern, this must lead to the appearance of the first and third Fourier harmonics ( 1 and 3) in the azimuthal distribution of the observed line-of-sight velocity. In addition, the second harmonic ( 2) may also appear if the density wave induces vertical oscillations of the gas (Fridman et al. 1997; Fridman et al. 1998). The predominance of the first three harmonics in the line-of-sight velocity field of the galaxy is clear, as first demonstrated in paper I. Here, we show this result for both optical and radio velocity measurements in Fig. 4 and 5, using , which gives minimum dispersion in a model of pure circular motion for the radio line-of-sight velocity data in the part of the galaxy under consideration. The optical data are practically insensitive to the change of by less than . Fig. 4 shows the contributions of different Fourier harmonics to the dispersion in the model of pure circular motion, averaged over the inner part of the disc ( ), whereas Fig. 5 shows similar histograms for the outer part of the optical disc ( ).


Comparison of the H (Figs. 4 a and 5 a) with the radio data (Figs. 4 c and 5 c) shows that the amplitude of the harmonics is much smaller in the latter than in the former case. Such a difference could be a reason to distrust the optical or radio data, if these data were related to the same velocity field, but this is, in fact, not the case.
As pointed out in Paper I, reasons for differences between radio and optical estimates of the amplitudes of the second Fourier harmonics on the one hand, and of the first and the third harmonics on the other hand, should be different. In the latter case, the difference may be caused by the low resolution of the radio data. This is well illustrated in Figs. 4b and 5b, where the amplitudes were calculated after smoothing of the optical velocity field to a resolution of 14′′, close to that of the radio data. The squares of the amplitudes of the third harmonic in Fig. 4b and of the first and third harmonics in Fig. 5b are one-third/one-fifth as many as those in the original H data. It thus follows from Figs. 4 and 5 that the histograms of the smoothed H data occupy an intermediate position between histograms of original H and Hi data — amplitudes in the histograms b) is closer to those in the histograms c) than those in histograms a). The second harmonic of the smoothed H line-of-sight velocity field is naturally much higher than the second harmonic of the Hi data. This can be explained by the different optical depth of the gaseous disc in the H and 21 cm lines, if one takes into account that the second harmonic is caused by the vertical motions in the density wave which are antisymmetrical with respect to the central plane of the disc (see discussion in Paper I).
It follows from Figs. 4 and 5 that the contribution of harmonics with 3 into the observed line-of-sight velocity field is not significant for this galaxy. Note that this conclusion is not a universal rule - our preliminary analysis of data for other objects shows that it might be wrong for some other galaxies, even though they have a two-armed grand-design spiral pattern. The anomalously large value of the amplitude of the 5th harmonic in Fig. 5 c is perhaps caused by the coincidence of the typical spatial scales of the 5th harmonic in the outer part of the disc with the resolution of the radio data. This hypothesis is supported by the appearance of an artificial anomalous amplitude of the fifth harmonic in the smoothed H data (Fig. 5 b).
The extraction of the first three harmonics from the line-of-sight velocity field reveals that the residuals have a non-regular noisy-like character. Fig. 6 shows a histogram of the distribution of the velocity residuals with all over the disc within the deprojected radius . It can be satisfactorily approximated by a Gaussian with a dispersion of about 10 km/s, which is close to the mean pixel-to-pixel error in the individual velocity measurements. This allows the construction of a simplified model of the velocity field of the galaxy, which uses only the first and the third harmonics to describe the gas motion in the plane of the disc.
All results given below are restricted to this model. The second harmonic of the line-of-sight velocity field will be ignored here because it relates to the vertical gas motions and was considered earlier (see Paper I for details).

3 Phase relationships and the position of corotation
The method used to restore the vector velocity field and to determine the corotation radius from observations of line-of-sight velocity distributions was described in detail by Lyakhovich et al. (1997) and applied to some galaxies by Fridman et al. (1997) and Fridman et al. (2000). The method is based on the comparison of Fourier coefficients of azimuthal distributions of the observed line-of-sight velocity, with those expected for a model where the perturbed velocity components at the particular moment of time , , are caused by a two-armed spiral density wave:
| (1) |
| (2) |
| (3) |
where and are an amplitude and phase of i-component of velocity.
The main idea behind this is the following. The line-of-sight velocity is connected with the velocity components of the gas by the relationship (Lyakhovich et al. 1997; Fridman et al. 1997)
| (4) |
where is the systemic velocity of the galaxy. Taking into account that , , , where is the rotation velocity, and substituting (1) – (3) in (4) we obtain the model representation of the line-of-sight velocity:
| (5) |
where Fourier coefficients related to phases and amplitudes of the velocity components are:
| (6) |
| (7) |
| (8) |
| (9) |
| (10) |
| (11) |
Calculating the Fourier coefficients of the observed line-of-sight velocity field (, , with 1, 2, 3) and equating them to the model ones (Eqs. 6-11), we obtain the base to determine the amplitudes and phases of all three velocity components.
The Fourier coefficients , , , , and as well as the best fit parameters of the galactic disc (, inclination, and centre position) may be found from the observed line-of-sight velocity distribution by minimising in each elliptical ring the quantity , as determined by the following equation (see Lyakhovich et al. 1997; Fridman et al. 1997 for details):
| (12) |
where designates the number of the ring and summing is performed over all pixels belonging to the ring.

The first harmonic of the observed velocity field contains contribution from both the rotation velocity and the perturbed motion, which can not be separated without taking some additional proposition, but the third harmonic should be unambiguously related to the velocity perturbation connected with the observed spiral arms. To verify this, Fridman et al. (1997) proposed to use the “modified third harmonic”, which has a form , where is the phase of the original third harmonic of the observed line-of-sight velocity. In the case of a tightly wound spiral, it was shown that the maxima of this ”modified third harmonic” follow the maxima of the perturbed surface density of the disc outside corotation (that is ). Inside corotation, they can coincide with maxima or minima of the perturbed surface density, depending on the relation between the amplitudes of the radial and azimuthal residual velocities. If then , otherwise . Fig. 7 shows the correlation between the positions of maxima of the perturbed surface density (characterized by the harmonic in the -band brightness distribution) and maxima (a) and minima (b) of the “modified third harmonic”. As one can see, the latter set of maxima really follow the spiral arms in the outer part of the disc and in the very inner region, whereas they lie between the arms in the radial region . This proves the correctness of the assumption we used on the wave nature of the spiral structure in NGC 3631, and implies that the position of corotation is at about . This argumentation gives the first rough estimate of the corotation radius .


To obtain a more accurate estimate of the position of corotation we previously proposed two methods (Lyakhovich et al. 1997; Fridman et al., 1997). The first method is based on the comparison of the radial behaviour of the sinus components of the first () and third () Fourier harmonics of the line-of-sight velocity field. In the case of tightly wound spirals, the following relations are fulfilled (for details see Lyakhovich et al. 1997 and Fridman et al., 1997):
| (13) |
These inequalities enable the determination of the location of the corotation radius from observational data. According to Eq.(13), corotation is located in the region where the difference changes sign, from minus to plus.
Fig. 8 shows the radial behaviour of in NGC 3631, as obtained from the original H (a), smoothed H (b), and 21-cm (c) line-of-sight velocity fields. Fig. 8 shows that this function derived from H line-of-sight velocity field is negative within the errors in the inner part of the galaxy, and positive in the outer region, in accordance with the expectations from (13). From these data it follows that the corotation radius is at . The level of errors in 21-cm data is relatively higher, due to lower resolution. Nevertheless, behaviour of derived from 21-cm line-of-sight velocity is in good agreement with H data within one level of confidence.
In addition, yet another method to estimate was proposed (Lyakhovich et al. 1997; Fridman et al. 1997), based on the relation between the phases of the perturbed surface density and the radial perturbed velocity of a gas, which is fulfilled for trailing tightly wound spirals:
| (14) |
This relation shows that gas should move along spiral arms inwards inside of corotation, and outwards outside of it. As shown in the cited papers, it may also be written as the relationship between the phase of the perturbed surface density and the Fourier coefficients and :
| (15) |
Fig. 9 shows the dependence of on galactocentric radius . The situation is quite similar to presented in the previous figure. The current approach leads to the estimate of of .
Combining the results from these methods, which agree well, we may conclude that the corotation radius , or 3.2 kpc0.38 kpc.
4 Restored velocity field of gas in the galactic plane
As shown in Section 2, lowering the angular resolution leads to an underestimate of the amplitudes of the Fourier harmonics. Therefore, to restore a two component vector velocity field of a gas in the disc of NGC 3631, we use the full resolution H line-of-sight velocity field.
To restore the velocity field in the plane of a galactic disc, i.e., its radial and azimuthal velocity components, it is necessary to determine five unknown functions: , , , , (see Eqs. 1 and 2). These five functions are connected with the Fourier coefficients of the observed line-of-sight velocity field by the four relations (6), (7), (10), and (11). An additional condition, required to close the system, should have a theoretical origin. Unfortunately, up to now, a reliable condition, valid for any density wave amplitude, is not available. Several possibilities discussed in the literature (Sakhibov & Smirnov, 1989; Fridman et al. 1997) are based on some kind of approximation and have limited applicability. To overcome this difficulty, we propose the following approach.
Among the functions listed above, can be most reliably estimated in two independent ways from observational data. The first one uses the equilibrium condition of a gaseous disc rotating in a gravitational potential
| (16) |
The right-hand side of the Eq.(16) is determined from the mass distribution in a galaxy, or its surface brightness maps, assuming the mass-to-light ratio is known and constant with radius. For this purpose, we use a three-component dynamical model of a spiral galaxy similar to the one used by Sumin, Fridman, & Haud (1991). Although the model is rather crude, the resulting rotation curve corresponds to the region approximately between and .

The same result can be obtained in another way. From equation (6) it follows that the difference cannot exceed the amplitudes and , which, in turn, are connected by equations (7), (10), and (11) with the Fourier coefficients , , and , determined from our observations. In Fig. 10, we show the radial behaviour of and . The extremes of these functions allow estimates of the amplitudes and . From Fig. 10 we conclude that in NGC 3631 a maximum value of the amplitude of the residual velocities occurs at km/s, i.e.
| (17) |
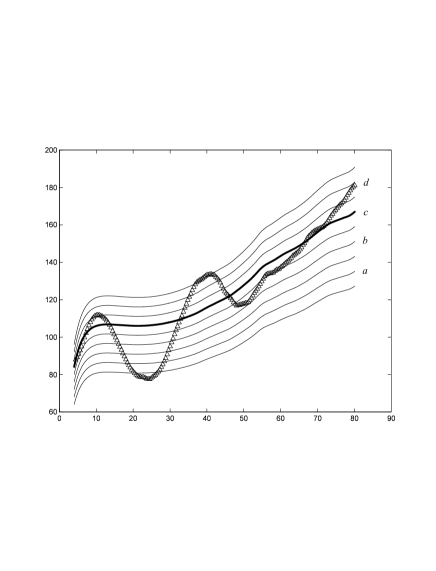
The conditions (16) and (17) do not allow an exact calculation of the function . Nevertheless, they set limits on the variations of both the amplitude and the form of . Within these limits, varying the mass-to-light ratio () and assuming it does not depending on radius we obtain a set of trial curves (Fig. 11) and analyse the velocity fields restored from Eqs. (6)–(11) for a given .
(a) The curve marked by symbol ”a” in Fig. 11 used as .
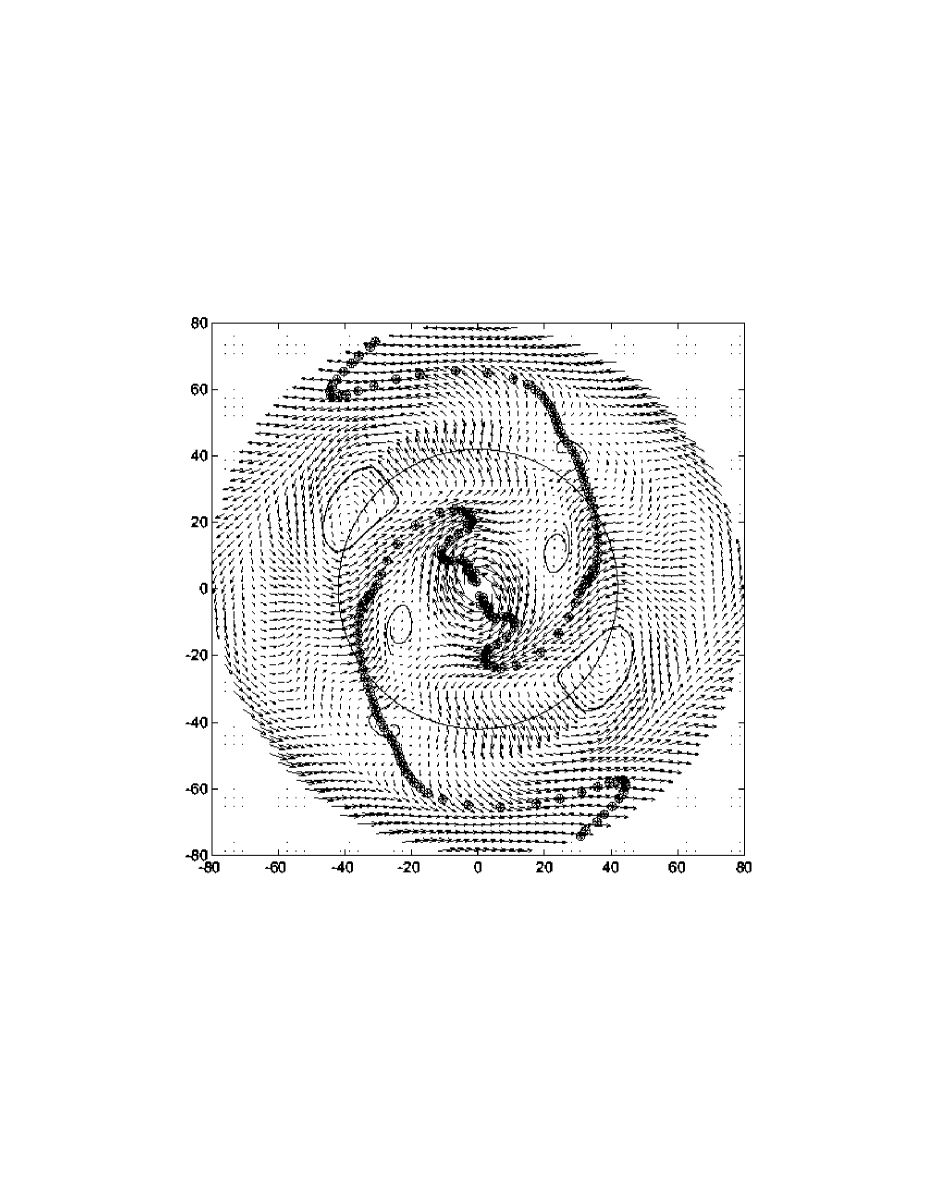
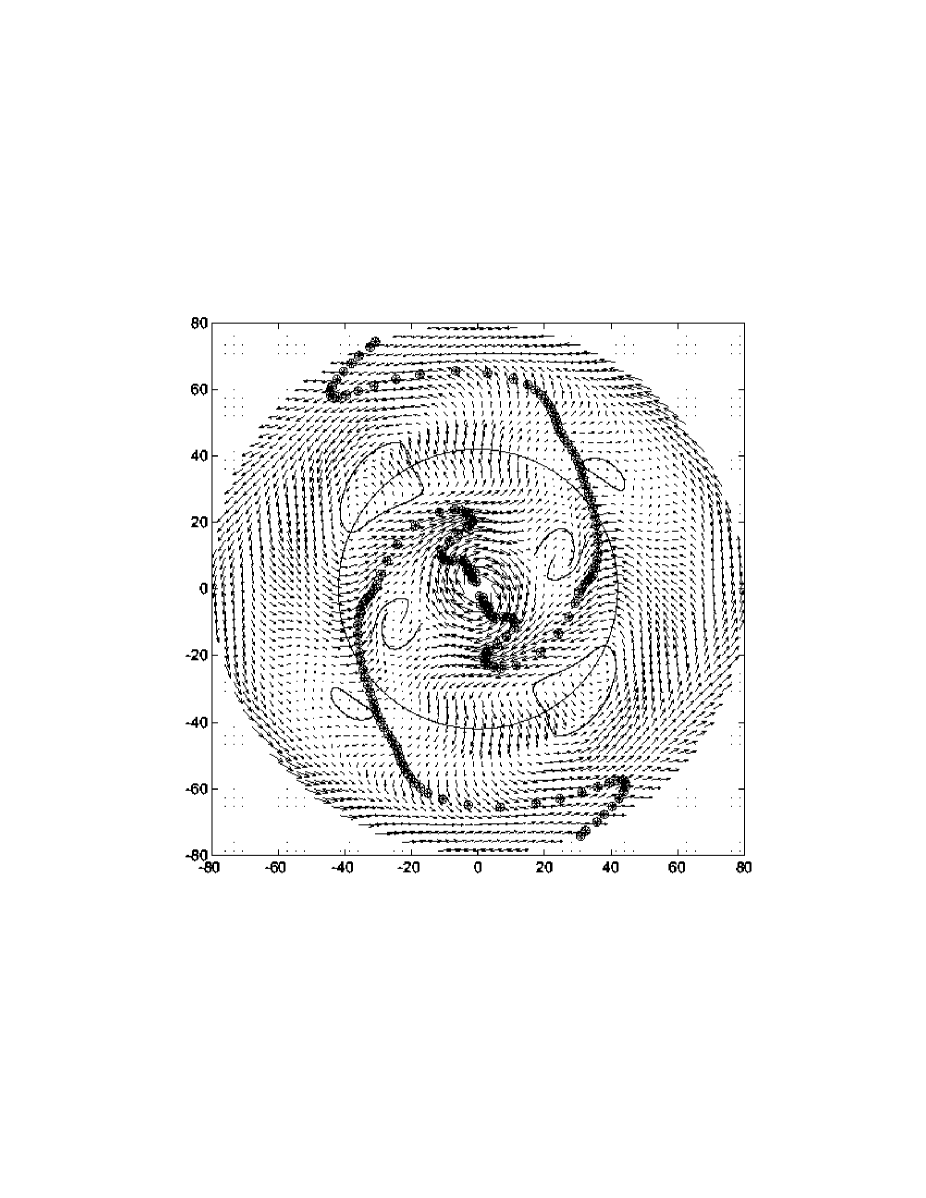
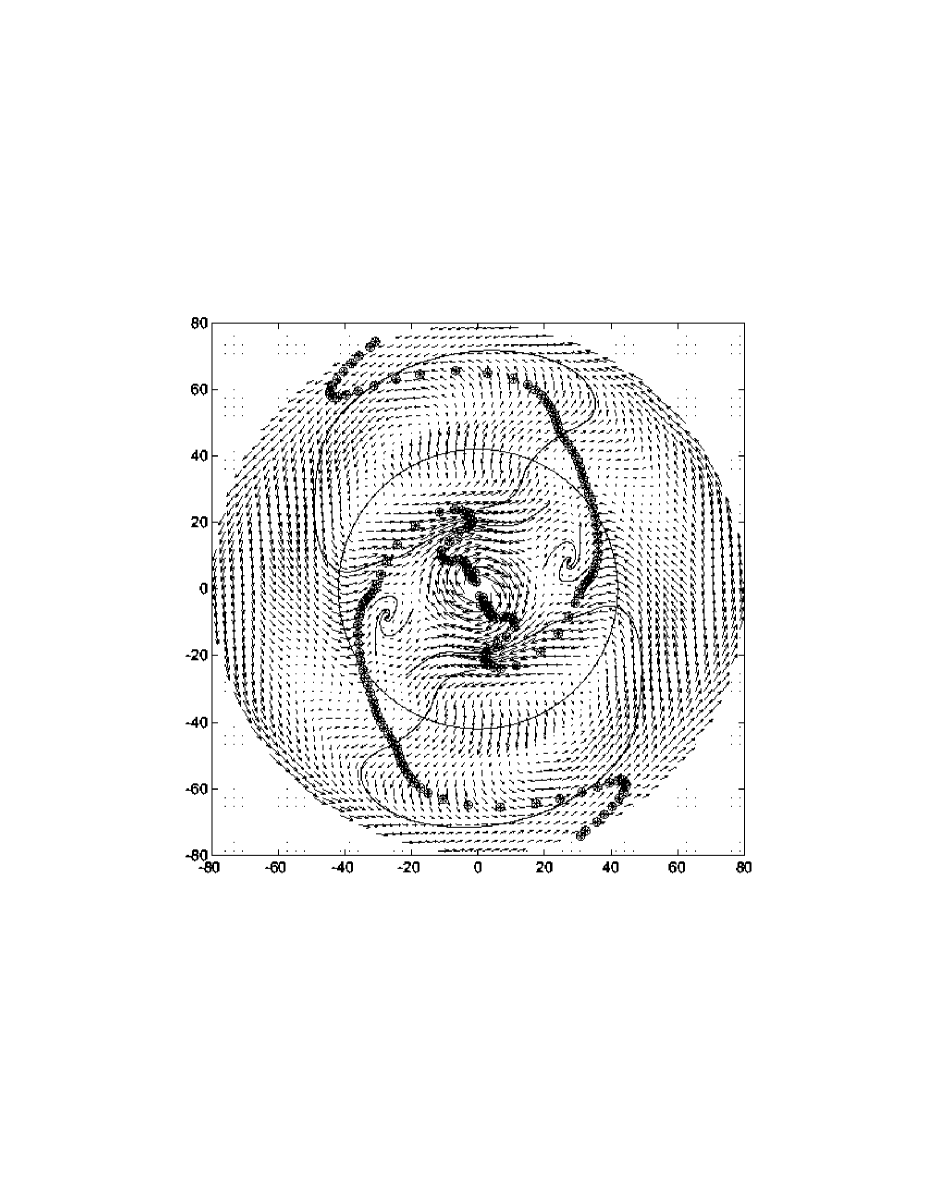
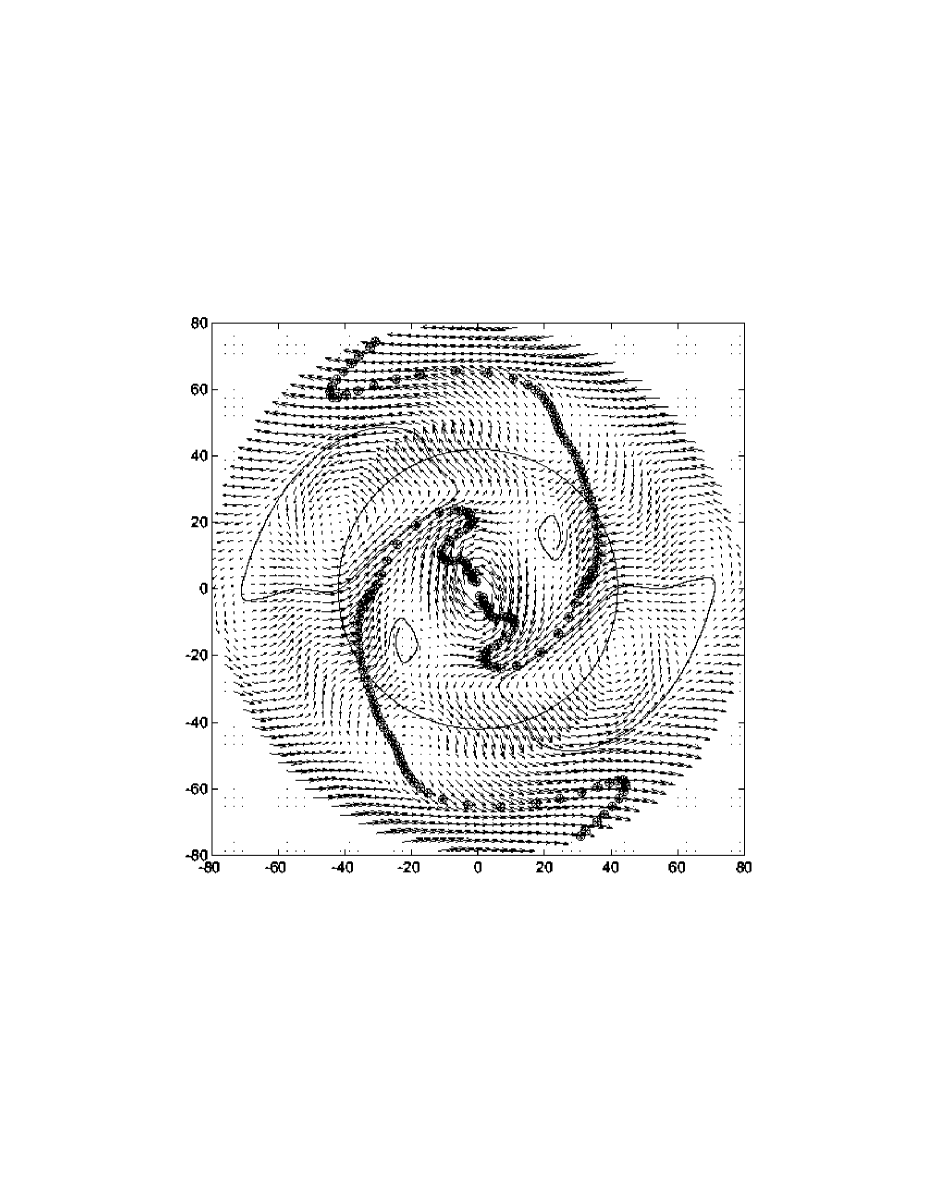
Fig. 12 shows four examples of the restored velocity field of NGC 3631, in the plane of the disc, and in a reference frame rotating with the spiral pattern. Positions of the maxima of the second Fourier harmonic of the -band surface brightness map are overlaid to indicate the relative location of spiral arms and structures in the velocity field.
It is clearly seen that, in spite of broad variations in , the general structure of the velocity field changes only slightly. In all cases this structure demonstrates the presence of two anticyclones, located on the corotation circle, and between spiral arms. Variations of the rotation curve only lead to small changes in the basic quantitative features of the anticyclones. In all cases, the maximum noncircular velocity in the vortices is about 60 km/s, their radial width is about 20′′, and the variation of the azimuthal position of the centres of anticyclones is less than 10∘. This proves that the exact shape of the rotation curve does not impact on the basic conclusion of the existence of giant anticyclones in the gaseous disc of NGC 3631. These anticyclones are similar to those revealed earlier in the velocity field of NGC 157 (Fridman et al. 1997).
Another new result is that regions of cyclonic shear are seen in Fig. 12. As a consequence of the relatively high amplitude of the density wave in NGC 3631, a cyclonic shear is produced by the density wave in some regions, which dominates the anticyclonic shear caused by differential rotation. The appearance of cyclones in gaseous galactic discs with a strong density wave was predicted earlier by Fridman et al. (2000).
To choose between the velocity fields presented in Fig. 12 the field which is closest to the real velocity field of the galactic disk of NGC 3631, we use the following criterion. In the course of many revolutions the growth of the density wave amplitude is stopped by the saturation of a corresponding instability. Thus in the reference frame corotating with spiral arms the velocity field of the galactic disk should be stationary. In such a field the vortices should have closed separatrices (lines dividing two families of trajectories: trapped and transit ones). According to the criterion stated above, the velocity field presented in Fig. 12 c is distinct in that sense that it is only case where cyclones have close separatrices. It is an argument in favour of choosing just this example as the closest to the real velocity field of the NGC 3631 gaseous galactic disk. At the same time that means that the curve ”c” in Fig. 11 is close to the real rotation curve of the disk. The relative position of the vortices and spiral arms in Fig. 12 c is in a good agreement with theoretical predictions (Fridman et al. 1999).
5 Conclusions
We can briefly summarize our main conclusions from this paper as follows:
-
1.
Based on an analysis of line-of-sight velocity fields of gaseous emission lines for the spiral galaxy NGC 3631 we confirm observationally the theoretical conclusions from our previous work about the wave nature of its two-armed spiral structure, and discuss its origins and properties in light of this theoretical framework.
-
2.
Using two independent methods, we find that the corotation radius in this galaxy is at about 42′′ or 3.2 kpc.
-
3.
The projection of the restored three-dimensional vector velocity field of gas in the plane of the galaxy, and in a reference frame corotating with the spiral pattern, reveals the presence of two anticyclonic vortices near corotation. We thus confirm the theoretical prediction foreseen earlier on the basis of a study of the general principles of the wave nature of spiral structure in galaxies.
-
4.
We show the existence of cyclonic vortices in NGC 3631, apart from that of anticyclones, as mentioned above. Such cyclonic vortices are a consequence of a high amplitude of the density wave in this galaxy.
Acknowledgements This work was performed with partial financial support of RFBR grant N 99-02-18432, “Leading Scientific Schools” grant N 00-15-96528, and “Fundamental Space Researches. Astronomy” grants: N 1.2.3.1, N 1.7.4.3. The Jacobus Kapteyn Telescope is operated on the island of La Palma by the Isaac Newton Group in the Spanish Observatorio del Roque de los Muchachos of the Instituto de Astrofísica de Canarias. Data were retrieved from the ING archive.
References
- [1] Arp, H., 1966, ApJS, 14, 1
- [2] Binney, J., Tremaine, S., 1987, Galactic Dynamics, Princeton University Press, Princeton
- [3] Boeshaar, G., Hodge, P.W., 1977, ApJ, 213, 361
- [4] Bonnarel, F., Boulesteix, J., Georgelin, Y.P., Lecoarer, E., Marcelin, M., Bacon, R., Monnet, G., 1988, A&A, 189, 59
- [5] Canzian, B., 1993, ApJ, 414, 487
- [6] Considère, S., Athanassoula, E., 1988, Astron. Astrophys. Suppl. Ser, 76, 365
- [7] Fridman, A.M., Polyachenko, V.L., 1984, Physics of gravitating systems, v.1,2, Springer-Verlag, New York, Berlin, Heidelberg, Tokyo
- [8] Fridman, A.M., Khoruzhii, O.V., Lyakhovich, V.V., Avedisova, V.S., Sil’chenko, O.K., Zasov, A.V., Rastorguev, A.S., Afanasiev, V.L., Dodonov, S.N., Boulesteix, J., 1997, Astroph. and Space Sci., 252, 115
- [9] Fridman, A.M., Khoruzhii, O.V., Zasov, A.V., Sil’chenko, O.K., Moiseev, A.V., Burlak, A.N., Afanasiev, V.L., Dodonov, S.N., Knapen, J.H., 1998, Astron. Lett., 24, 764 (Paper I)
- [10] Fridman, A.M., Khoruzhii, O.V., Polyachenko, E.V., Zasov, A.V., Sil’chenko, O.K., Afanasiev, V.L., Dodonov, S.N., Moiseev, A.V., 1999, Physics Letters A, 264, 85
- [11] Fridman, A.M., Khoruzhii, O.V., Lyakhovich, V.V., Sil’chenko, O.K., Zasov, A.V., Afanasiev, V.L., Dodonov, S.N., Boulesteix, J., 2000, A&A, submitted
- [12] García Gómez, C., Athanassoula, E., 1993, Astron. Astrophys. Suppl. Ser, 100, 431
- [13] Hodge, P.W., 1982, ApJ, 256, 447
- [14] Kent, S.M., 1984, Astrophys. J. Suppl. Ser., 56, 105
- [15] Kent, S.M., 1985, Astrophys. J. Suppl. Ser., 59, 115
- [16] Knapen, J.H., 1997, MNRAS, 286, 403
- [17] Lyakhovich, V.V., Fridman, A.M., Khoruzhii, O.V., Pavlov, A.I., 1997, Astronomy Report, 41, 447
- [18] Rozas, M., Beckman, J.E., Knapen, J.H., 1996, A&A, 307, 735
- [19] Sakhibov, F.Kh., Smirnov, M.A., 1987, Astron. Zh., 64, 255
- [20] Sakhibov, F.Kh., Smirnov, M.A., 1989, Astron. Zh., 66, 921
- [21] Sakhibov, F.Kh., Smirnov, M.A. 1990, Astron. Zh., 67, 690
- [22] Schoenmakers, R.H.M., Franx, M., de Zeeuw, P.T., 1997, MNRAS, 292, 349
- [23] Sempere, M.J., García-Burillo, S., Combes, F., Knapen, J.H., 1995, A&A 246, 45
- [24] Sumin, A.A., Fridman, A.M., Haud, V.A., Pis’ma Astron. Zh., 1991, 17, 698
- [25] Vaucouleurs, G.de, Vaucouleurs, A.de, Corwin, H.G., et.al., Buta, R.J., Paturel, G., Fouque, P., 1991. Third Reference Catalogue of Bright Galaxies. Springer, New York (RC3)
- [26] Westpfahl, D.J., 1998, ApJS 115, 203
- [27] Yuan, C., 1969, Ap.J., 158, 871