X-ray emission in the direction of the SNR G318.2+0.1
We report the discovery of three X-ray sources within the radio shell G318.2+0.1, one of which may be extended. Two of the sources were detected during the BeppoSAX Galactic Plane Survey and one was found in archival ROSAT data. The fainter BeppoSAX source is coincident with an ultra-compact galactic H ii region, and we discuss the possibility that it can be a flaring young stellar object, while the other BeppoSAX source has no obvious counterpart. The PSPC source is consistent with emission from a foreground star. The hard spectrum of the brighter BeppoSAX source is consistent with a non-thermal origin, although a thermal nature cannot be formally excluded. If this source is associated with G318.2+0.1, then its hard spectrum suggests that it may be site of non-thermal electron acceleration.
Key Words.:
supernovae: general; ISM: individual object: G318.2+0.1; ISM: supernova remnants; X-rays: ISM1 Introduction
G318.2+0.1 is a large () radio shell discovered by Whiteoak & Green (1996) in the MOST 843 MHz survey. The remnant was identified by means of the criterium of the ratio of 60 m to radio flux density, but Whiteoak & Green (1996) have also reported of additional polarization measurement which seems to confirm its nature. This object is mainly composed of two non-thermal filaments at the North-West and South-East which form two sections of the shell, plus a central region and a bright clump to the South-West, which are thermal and correspond to two H ii regions. Moreover, the ultra-compact (UC) H ii region IRAS14498–5856, reported in Walsh et al. (1997), is also located towards the radio shell; this UC H ii region is a methanol, OH and H2O maser (GAL318.05+0.08, Gaylard & MacLeod (1993)). As many other newly discovered radio shells, very little is known about G318.2+0.1. In particular, we do not know its age and its distance, and the relation between the SNR and H ii region detected in radio is still to be studied.
The X-ray band offers a unique opportunity to confirm the detection of newly discovered radio SNRs. In fact, SNRs may be strong X-ray emitters since their initial evolutionary stage, and several SNRs have been discovered, or rediscovered, in large area surveys or in pointed observations by X-ray satellites (see e.g., Aschenbach et al. (1991); Pfeffermann & Aschenbach (1996)). The detection of radio SNRs in other bands is important in order to properly assess the nature of these objects, as well as to provide a secure identification in cases where this is uncertain. Among other things, X-ray studies may provide information about the distance, which is a key parameter for SNRs, measured with difficulty in the radio band.
In this paper we report the discovery of three X-ray sources within the radio shell G318.2+0.1. Two are sources discovered during the BeppoSAX Galactic Plane Survey (GPS), one of which is positional coincident with the UC H ii region, and one was found in archival ROSAT data. In Sect. 2 we describe the observations, in Sect. 3 we introduce the detected sources and in Sect. 4 we discuss their possible nature and relation to G318.2+0.1.
2 Observations
The BeppoSAX GPS consisted of 14 pointed observations of a region of the galactic plane between approximately to within about from the plane. Due to a lack of suitable guide stars the region between to could not be observed. The prime instruments for the survey were the Medium-Energy Concentrator Spectrometer (MECS; 1.8–10 keV; Boella et al. (1997)) and the Low-Energy Concentrator Spectrometer (LECS; 0.1–10 keV; Parmar et al. (1997)). The MECS consists of two grazing incidence telescopes with imaging gas scintillation proportional counters in their focal planes. The LECS uses an identical concentrator system as the MECS, but utilizes an ultra-thin entrance window and a driftless configuration to extend the low-energy response to 0.1 keV. The fields of view (FOV) of the LECS and MECS are circular with diameters of 37′ and 56′, respectively. In the overlapping energy range, the position resolution of both instruments is similar and corresponds to 90% encircled energy within a radius of 25 at 1.5 keV. In addition, the BeppoSAX payload includes two high energy instruments - the High Pressure Gas Scintillation Proportional Counter (HPGSPC; 5–120 keV; Manzo et al. (1997)) and the Phoswich Detection System (PDS; 15–300 keV; Frontera et al. (1997)). The non-imaging HPGSPC consists of a single unit with a collimator that remained on-source during the GPS observations. The non-imaging PDS consists of four independent units arranged in pairs each having a separate collimator. Each collimator was alternatively rocked on- and 210′ off-source every 96 s during the observations.
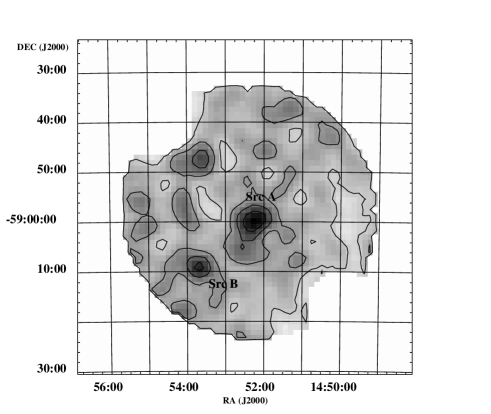
The region of sky containing G318.2+0.1 was observed between 1999 July 21 16:58 and July 22 06:56 UTC. The (J2000) pointing direction was R.A.=, Dec=. In order to avoid solar scattered emission and other contaminating effects, data were screened retaining intervals when the elevation angle above the Earth’s limb was and when the instrument configurations were nominal. The screened exposures in the LECS and MECS are 10.9 ks and 25.9 ks, respectively. The MECS 0.5-10 keV image is shown in Fig. 1. The image was smoothed using a Gaussian filter with a of 15.
Inspection of PDS data after having subtracted a contaminating source present in one of the offset collimator positions does not reveal the presence of any excess signal above background. The 3 confidence upper limit to any 15–30 keV count rate is cts s-1. For a Crab-like spectrum this corresponds to 2 mCrab. As for the HPGSPC, we have derived a 3 confidence upper limit of 0.25 s-1 in the 10–20 keV band, which correspond to 3.5 mCrab.
In addition, we have used two ROSAT Position Sensitive Proportional Counter (PSPC) archival observations (RP500096 and RP500192 with exposures of 1.3 and 4.5 ks, respectively) both pointed at R.A.=, Dec= (J2000) which partially overlaps the radio shell of G318.2+0.1. The PSPC, which covers the 0.1–2.4 keV energy range, has a circular FOV of and a spatial resolution of full width half-maximum (FWHM) on-axis and 25 at off-axis, near the location of one of the source discussed below. The PSPC spectral resolution is at 1 keV. The FOVs of the BeppoSAX and ROSAT observations used here do not overlap.
3 X-ray sources inside G318.2+0.1
3.1 Source detection
| Source | Inst | R.A. | Dec | Uncertainty | Count rate | Significance |
|---|---|---|---|---|---|---|
| (J2000) | radius (′) | (s-1) | ||||
| A | MECS | 1 | ||||
| B | MECS | 1 | ||||
| C | PSPC | 1.3 | ||||
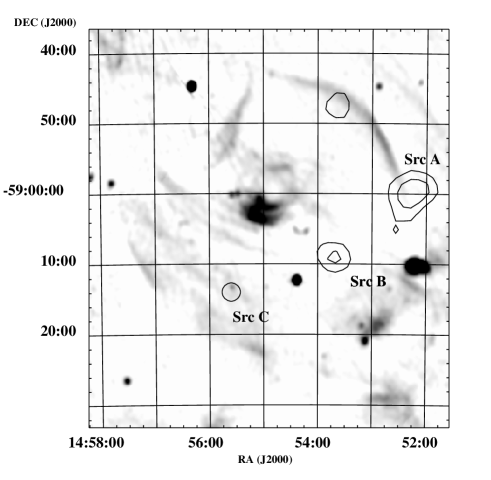
Inside the radio boundary of G318.2+0.1, we have detected the three X-ray sources which are listed in Table 1 together with their positions, count rates and significances. In Fig. 2, we reproduce the Whiteoak & Green (1996) radio map of G318.2+0.1 with the position of the X-ray sources superimposed. Sources A and B were detected using the sliding-cell method of the ximage software package (Giommi et al. (1992)) on the 32′′ pixel BeppoSAX MECS image. Some fainter X-ray emission is also present in the North-Western part of the radio shell but it is not detected above the level and we will not discuss it further. Source A is the brightest and is located at the rim of the shell, between the North-West shell filament and the bright thermal radio clump at , discussed in Whiteoak & Green (1996). The 80% (i.e., the innermost), 60% and 40% contour levels around Source A show some evidence of source elongation from the North-West to the South-East which is not shown in the corresponding image of Cyg X-1, a bright point source used as a template for the instrumental Point Spread Function (PSF). We therefore suggest that Source A may be extended. Source B is positioned roughly halfway between the shell and the core, with no obvious radio counterpart at 843 MHz, and it is consistent with being point-like. No sources were detected in the LECS image, with a upper limit of cts s-1 in a radius circle. This may be due to the much lower LECS exposure time and/or to high X-ray absorption, which supress X-rays below 2 keV, the only energy band where the LECS is more sensitive than the MECS.
Source C was detected in the ROSAT All-Sky Survey (RASS, 1RXS J145540.4-591320, Voges et al. (1999)) and it is also present in the WGACAT (1WGA J1455.5-5912 and 1WGA J1455.7-5912, White et al. (1994)). The count rates measured in different ROSAT observations are , and cts s-1 in the RASS (October 1990), RP500192 (March 1992) and RP500096 (February 1993), respectively. The source has a shape severely distorted by mirror blurring since it is located at off-axis, but its extension is compatible with the size of the PSPC PSF at that off-axis angle.
In order to investigate the nature of the detected X-ray source (and therefore the relation with G318.2+0.1), we have performed source cross-identifications with catalogues using SIMBAD and a search radius of . Sources A and B are coincident with very weak IRAS sources at 12 . However, this band is heavily confused by the galactic background. Source B is the only one which has a strong counterpart at 25, 60 and 100 and is also coincident with the UC H ii region IRAS14498–5856 reported by Walsh et al. (1997). As for Source C, the star GSC08693-00036, with B and V falls inside its error circle, at offset. We also inspected the Digital Sky Survey image within from the positions of the sources and we did not find any other obvious counterparts (except those already found with SIMBAD).
3.2 Spectral analysis
Since the sources are weak, the analysis of their hardness ratios is a very good method to constrain the X-ray emission process. For the MECS sources, we defined two hardness ratios in the following way:
| (1) |
where is the number of counts in the 1.0–2.0 keV band, in the 2.0–10 keV band, in the 2.0–5.0 keV band and 5.0–10 keV band. The counts are collected in circular area with and radius for Source A and B, respectively, and they were background subtracted using the MECS standard background maps, because we have verified that the background collected in the short exposure observations of G318.2+0.1 is statistically poor. Errors in the H and S quantities are computed propagating the Poissonian errors. The uncertainties on the ratios are computed using the maximum and minimum values that the denominators and the numerators can assume considering their respective uncertainties. The values of and for Source A and Source B and their uncertainties are graphically represented in Fig. 3. In the same figure, we have also plotted the expected and values for a power-law and an optically thin thermal plasma (mekal) emission model with many different values of the power-law photon index (), the plasma temperature () and the intervening absorbing column (), computed with simulations using xspec.
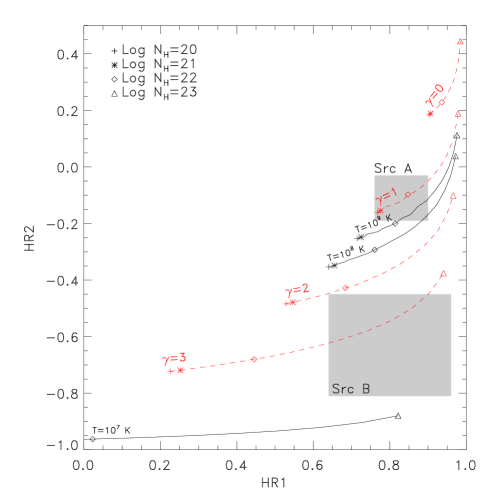
Source A is located in a region of the and plane which correspond to very hard spectra. In particular, the non-thermal power law seems to be preferred over the thermal plasma model, since for Source A to be of thermal origin its temperature should be K, which seems unreasonable high. The of Source A is poorly constrained by this analysis, since we have only an upper limit between and cm-2. We recall however, that MECS is not the best suited instrument to measure low values of accurately, because its effective area drops quickly to zero below 1 keV. This is shown in Fig 3 by the proximity of the symbols corresponding to and cm-2. As for Source B, the associated hardness ratios show that it is significantly softer than Source A. It could be a non-thermal source with , or a thermal source with a temperature of a few K. In any case, it seems to be very absorbed, with cm-2.
We have also attempted to extract the spectrum of Source A, using the same extraction region and background used for hardness ratios. We have used the LECS even in absence of Source A detection in order to provide a more stringent lower limit to the value of interstellar absorption. In fact, as the hardness ratio scatter plot suggests, MECS data yields only an upper limit to the , while the inclusion of LECS yields also a lower limit to this parameter. The spectra were rebinned to oversample the FWHM of the energy resolution by a factor 3 and to have additionally a minimum of 30 counts per bin to allow use of the statistic. Data were selected in the energy range 0.1–4 keV for the LECS and 1.8–10 keV for the MECS. The number of LECS and MECS counts in the spectra after background subtraction is 20 and 307. The photo-electric absorption cross sections of Morrison & McCammon (1983) and the solar abundances of Anders & Grevesse (1989) are used throughout.
Absorbed optically thin thermal plasma (mekal in xspec), power-law, thermal bremsstrahlung and black-body models were tried. At first, we used a free normalization constant between LECS and MECS. Since the fitted values of the constant were between 0.7 and 2.0, we fixed its value to 1. All models provide an adequate description of the spectrum. In agreement to the findings obtained with hardness ratios, the best-fit temperature of the mekal fit is very high and indicates that the power-law model may provide a more reasonable representation of the spectrum. Fig. 4 shows the observed count spectrum together with the best-fit power-law model, and Table 2 summarizes the fit results. We have verified that the HPGSPC count-rate predicted by the best-fit models is a factor of 5 below the upper limit given in Sect. 2.
| Model | Parameter | Flux | /dof | |
| (cm-2) | (erg cm-2 s-1) | |||
| Source A (LECS and MECS) | ||||
| Power-law | 13/20 | |||
| mekal | kT | 12/20 | ||
| Bremss | kT | 13/20 | ||
| Black-body | kT | 18/20 | ||
| Source C (PSPC) | ||||
| Power-law | 23/17 | |||
| mekal | kT= | 26/17 | ||
| Bremss | kT | 19/17 | ||
| Black-body | kT | 27/17 | ||

For the Source C, we extracted the spectrum from a circular region of radius, which corresponds to the 90% encircled energy radius of the PSPC PSF at off-axis. The background was extracted from an annulus between and . The spectrum was rebinned into 10 channels to oversample the energy resolution of the instrument and was fit with the same emission models as before using the appropriate response matrix and the ancillary file created with the task pcarf of FTOOLS 5.0. The background subtracted spectrum has 466 counts. The fit results are summarized in Table 2. Both thermal and non-thermal models are formally acceptable, but the mekal model systematically underestimates the flux below 0.8 keV, while the Bremsstrahlung model provide the best value.
4 Discussion
The X-rays emission we have detected in the direction of G318.2+0.1 is not well correlated with the radio shell: essentially, we have failed to reveal the thermal X-ray emission which should trace the interaction between the remnant and the interstellar medium. We have already noted that we see an enhancement at which is located almost on top of the radio filament, but further and deeper observations are needed to confirm this detection. On the other hand, we have detected three X-ray sources in the direction of the SNR G318.2+0.1, which are rather compact and loosely correlated with the position of the radio shell.
We have investigated whether the X-ray emission of Sources A and C could be due to stars within the uncertainty regions. We extracted lists of stars from the USNO-A2.0 catalog (Monet (1998)) within from Sources A and C, and considered the brightest star in each list. For Source A, there is an object with R and B which implies an M2 main sequence star. However, using the relation (Predehl & Schmitt (1995)) with the observed cm-2 (Table 2), we estimate a , and the correction to is certainly as large. Therefore, the star has an unabsorbed , which correspond to an F star. Since the unabsorbed V magnitude should be around 14 and the unabsorbed 0.3–3.5 keV flux is 0.8–2.3 erg cm-2 s-1, we calculate that the ratio of X-ray to optical flux () is at least a factor of 10 higher than expected for a F star (see e.g., Maccacaro et al. (1988)). Similarly, from the observed of the star GSC08693-00036 in the uncertainty region of Source C, we infer a K0 main sequence star at 90 pc. This is in agreement with the parallax measured by Hipparcos (ESA (1997)), which yields a lower limit of 11 pc to the distance to GSC08693-00036. The observed 0.3–3.5 keV flux is erg cm-2 s-1, therefore, following Maccacaro et al. (1988), its is consistent with a K star. The plasma temperature derived by the fit is in agreement with the temperature expected in a stellar corona. Thus, while Source C may be identified with emission from a foreground star, Source A appears unlikely to be so.
Source B is a very interesting object since it is probably the X-ray counterpart of the IRAS14498-5856 UC H ii region and, to our knowledge, no other similar cases have been yet reported in the literature. Walsh et al. (1997), using the methanol maser velocity, reported a kinematic distance to IRAS14498-5856 of 4.3 or 11.1 kpc (depending on whether the source is on the near, or the far side, of the Galaxy). Using a thermal plasma emission model with a temperature of few K (the model compatible with the hardness ratio analysis, Fig. 3), the MECS Source B has a flux of erg cm-2 s-1, corresponding to erg s-1 at a distance of 4.3 kpc and erg s-1 at a distance of 11.3 kpc. The former luminosity is high even for a young intermediate (2–5 M⊙) or high mass ( M⊙) star, but flares can increase luminosity. Ozawa et al. (1999) detected a quiescent X-ray emission of erg s-1 from SSV63, a 2-5 M⊙ object in the dark cloud L1630, and a flare of erg s-1. Hamaguchi et al. (2000) detected a flare from a more massive Herbig Be star of erg s-1. In all the cases, the measured temperature are between 1 and 10 keV, in agreement with the one inferred for Source B, and the flare timescale is larger than s. Therefore, it may be the case that we have detected a flaring young massive star, even if the light-curve we have extracted in our 26 ksec observation do not show particular evidence of variability. The large absorption we measure toward Source B is also in agreement with the explanation in terms of an embedded massive star, since the typical value for this kind of objects is above cm-2. If Source B is really the hard X-ray counterpart of the young massive star of the UC H ii region, then we favor the lowest distance, because at 11 kpc its luminosity would be higher than the one expected even in case of flare.
Alternatively, a population of low mass pre-main sequence stars can also produce hard X-rays. For instance, Hofner & Churchwell (1997) propose this last explanation for the hard X-ray emission from the H ii region W3 observed with ASCA with luminosity of erg s-1 in the 2–10 keV energy range, similar to the luminosity of Source B. However, since the typical X-ray luminosity of low mass protostars are in the range to erg s-1, a large number of objects are required inside the BeppoSAX positional error circle of (2.5 pc at 4.3 kpc) to account for the luminosity of our source. Unfortunatly, it is not clear if IRAS14498-5856 is embedded in a larger star forming region. Further radio and X-ray observations are needed to study the environment of IRAS14498-5856 and to better locate Source B, and therefore remove this ambiguity.
An independent hint about the nature of Source B comes from its IR flux. Using the flux densities at 60 and 100 m of 1133 and 2208 Jy listed in the IRAS Point Source Catalog for this source and the relation F erg cm-2 s-1, adapted from Rice et al. (1988), we derive a far infrared luminosity of erg s-1, and an Fir /Fx well above 100, in agreement with the value expected from a star forming region (Vogler et al. (1997)).
The association between SNRs and UC H ii regions may be very common and, if established, supports a Type II SN progenitor (Becker & Helfand (1987)). If G318.2+0.1 is associated with IRAS14498-5856, then its diameter is 50 pc, and using the revised relation given by Case & Bhattacharya (1998) we estimate an expected radio surface brightness of 1–2 W m-2 Hz-1 sr-1 at 1 GHz. The observed surface brightness is W m-2 Hz-1 sr-1 and therefore this SNR is underluminous with respect to the relation. This may imply an expansion into a low density medium, which in turn implies a strongly reduced contribution of the thermal X-ray emission due to the main shock, and a higher probability of observing non-thermal X-ray emission due to accelerated electrons. This may explain why we do not see extended thermal emission along the shell. If Source A indeed has a hard non-thermal spectrum, it may be site of non-thermal electron acceleration. Similar hard point sources have been found inside IC443 and are interpreted as evidence of slow shocks propagating into molecular clouds (Bocchino & Bykov (2000)). This scenario is very probable since Gaylard & MacLeod (1993) and Green et al. (1997) have observed 1720 GHz line emission inside this remnant at several locations, suggesting an OH maser due to shock excitation of neutral gas of molecular clouds. We strongly suggest further deep X-ray observations of this shell, in order to confirm the non-thermal nature of the emission, detect any diffuse emission at other locations in the shell, and to study the X-ray properties of the UC H ii region coincident with Source B.
The interstellar absorption provides additional information about the distance. The absorption toward Source A is cm-2 (Table 2), which implies a distance of kpc, where is the mean interstellar density in atoms cm-3. If the mean density is cm-3, than the distance estimated in this way is in agreement with an association between Source A, Source B, the UC H ii region and the SNR. On the other hand, the upper limit to the NH is greater than the galactic absorption in this direction. As for Source C the low NH implies a distance of 1 kpc, which is consistent with the association with the K0 star located in the local cavity at pc studied by Sfeir et al. (1999).
Acknowledgements.
BeppoSAX is a joint Italian-Dutch program. F. Bocchino acknowledges an ESA Research Fellowship. The MOST is operated by the University of Sydney with support from the Australian Research Council and the Science Foundation for Physics within the University of Sydney. This research has made use of data obtained through the High Energy Astrophysics Science Archive Research Center Online Service, provided by the NASA/Goddard Space Flight Center, and of data obtained through SIMBAD, provided by the Centre de Données astronomiques de Strasbourg.References
- Anders & Grevesse (1989) Anders E., Grevesse N. 1989, Geochim. Cosmochim. Acta.53, 197
- Aschenbach et al. (1991) Aschenbach B., Brinkmann W., Pfeffermann E., Fuerst E., Reich W. 1991, A&A246, L32
- Becker & Helfand (1987) Becker R. H., Helfand D. J. 1987, ApJ316, 660
- Bocchino & Bykov (2000) Bocchino F., Bykov A. M. 2000, A&A362, in press
- Boella et al. (1997) Boella G., Butler R. C., Perola G. C., et al., 1997, A&AS122, 299
- Case & Bhattacharya (1998) Case G. L., Bhattacharya D. 1998, ApJ504, 761
- ESA (1997) ESA 1997, ESA SP-1200
- Frontera et al. (1997) Frontera F., Costa E., dal Fiume D., et al., 1997, A&AS122, 357
- Gaylard & MacLeod (1993) Gaylard M. J., MacLeod G. C. 1993, MNRAS262, 43
- Giommi et al. (1992) Giommi P., Angelini L., Jacobs P., Tagliaferri G. 1992, in ASP Conf. Ser. 25: Astronomical Data Analysis Software and Systems I, Vol. 1, 100
- Green et al. (1997) Green A. J., Frail D. A., Goss W. M., Otrupcek R. 1997, AJ114, 2058
- Hamaguchi et al. (2000) Hamaguchi K., Terada H., Bamba A., Koyama K. 2000, ApJ532, 1111
- Hofner & Churchwell (1997) Hofner P., Churchwell E. 1997, ApJ486, L39
- Maccacaro et al. (1988) Maccacaro T., Gioia I. M., Wolter A., Zamorani G., Stocke J. T. 1988, ApJ326, 680
- Manzo et al. (1997) Manzo G., Giarrusso S., Santangelo A., et al., 1997, A&AS122, 341
- Monet (1998) Monet D. E. A. 1998, in The PMM USNO-A2.0 Catalog. (1998), http://www.nofs.navy.mil
- Morrison & McCammon (1983) Morrison R., McCammon D. 1983, ApJ270, 119
- Ozawa et al. (1999) Ozawa H., Nagase F., Ueda Y., Dotani T., Ishida M. 1999, ApJ523, L81
- Parmar et al. (1997) Parmar A. N., Martin D. D. E., Bavdaz M., et al., 1997, A&AS122, 309
- Pfeffermann & Aschenbach (1996) Pfeffermann E., Aschenbach B. 1996, in Roentgenstrahlung from the Universe, eds. Zimmermann, H.U., Trumper, J., and Yorke, H.; MPE Report 263, p. 267
- Predehl & Schmitt (1995) Predehl P., Schmitt J. H. M. M. 1995, A&A293, 889
- Rice et al. (1988) Rice W., Lonsdale C. J., Soifer B. T., et al., 1988, ApJS68, 91
- Sfeir et al. (1999) Sfeir D. M., Lallement R., Crifo F., Welsh B. Y. 1999, A&A346, 785
- Voges et al. (1999) Voges W., Aschenbach B., Boller T., et al., 1999, A&A349, 389
- Vogler et al. (1997) Vogler A., Pietsch W., Bertoldi F. 1997, A&A318, 768
- Walsh et al. (1997) Walsh A. J., Hyland A. R., Robinson G., Burton M. G. 1997, MNRAS291, 261
- White et al. (1994) White N. E., Giommi P., Angelini L. 1994, IAU Circ.6100, 1
- Whiteoak & Green (1996) Whiteoak J. B. Z., Green A. J. 1996, A&AS118, 329