The Cosmological Evolution of BL Lacertae Objects
Abstract
We review the main results from several radio, X-ray and multi-frequency surveys on the topic of cosmological evolution of BL Lacertae objects. Updated findings on BL Lac evolution following the recent identification of many sources in the ”Sedentary Multi-Frequency survey” are also discussed. By means of extensive Monte Carlo simulations we test some possible explanations for the peculiar cosmological evolution of BL Lacs. We find that a dependence of the relativistic Doppler factor on radio luminosity (as expected within the beaming scenario) may induce low values of and that both edge effects at the low luminosity end of the BL Lacs radio luminosity function, and incompleteness at faint optical magnitudes may be the cause of the low found for extreme HBL sources in X-ray selected samples.
Agenzia Spaziale Italiana, Viale Liegi 26, 00198 Roma, Italy
BeppoSAX Science Data Center, Via Corcolle 19, 00131 Roma, Italy
Dipartimento di Fisica, Università di Roma “La Sapienza”, P.le A. Moro 2, 00185 Roma, Italy
Space Telescope Science Institute, 3700 San Martin Dr., Baltimore, MD, 21210, USA
Affiliated to the Astrophysics Division Space Science Department, European Space Agency
On leave from Dipartimento di Fisica, II Università di Roma “Tor Vergata”, Via della Ricerca Scientifica 1, 00133 Roma, Italy
1. Introduction
BL Lacertae objects, like quasars, were discovered in the late sixties as unexpected extragalactic counterparts of bright radio sources. Soon after their discovery the number of known QSOs (radio loud, and especially the radio quiet ones) grew rapidly thanks to the detection of many new objects at optical and radio frequencies. Very few BL Lacs could instead be found due to their peculiar characteristics which include lack of strong emission lines and absence of the “big blue bump”. The strong optical variability and polarization properties that are typical of BL Lacs turned out not to be sufficiently strong features to allow the discovery of many new objects of this class at optical frequencies. The number of known BL Lacs remained very low for a long time. When the first generation of X-ray satellites (UHURU, ARIEL V) established that emission line AGN are strong X-ray emitters also BL Lacs were detected as powerful X-ray sources. Shortly afterwards the HEAO1 all sky X-ray surveys discovered many new AGN including a few BL Lacs (Piccinotti et al. 1982). The small number of BL Lacs compared to QSOs (both at radio and X-ray frequencies), together with their extreme properties, nicely fitted into the picture where these objects are the fraction of relativistically beamed sources that happens to be viewed at a small angle with respect to our line of sight (Blandford & Rees 1978). The total number of beamed sources pointing in any direction (the parent population of BL Lacs) would then be much larger.
When the Einstein observatory detected X-ray emission form nearly all known AGN and discovered many new ones as serendipitous sources, the number of X-ray discovered BL Lacs was expected to grow in proportion to that of QSOs. Surprisingly instead (although some BL Lacs were indeed found as X-ray serendipitous sources establishing that the X-ray selection is one of the main methods for the selection of new BL Lacs) the fraction of BL Lacs was found to sharply decrease at faint X-ray fluxes. The strong increase of space density or luminosity at earlier cosmic epochs (cosmological evolution) that was found in the radio, optical and X-ray counts of QSOs was clearly not present in the population of BL Lac objects (Stocke et al. 1982; Maccacaro et al. 1983). The Einstein Medium Sensitivity Survey (EMSS) convincingly showed that X-ray selected BL Lacs display negative cosmological evolution, that is either there were less objects or they were less luminous in the past (Morris et al. 1991; Wolter et al. 1991; Rector et al. 2000).
In the following paragraphs we review the main results on the cosmological evolution of BL Lacs as obtained from several surveys in different energy bands.
2. BL Lac surveys
BL Lacs are intrinsically rare objects, therefore it is necessary to select them amongst a much larger number of other ’contaminating’ sources. Historically this has been done by means of two main techniques:
-
1.
BL Lacs are searched for in flux limited samples by means of optical spectroscopy of all the candidates detected above the survey limit. This approach can be afforded only if the number of candidates is of the order of 1000 or less. In the following we will refer to these surveys as ’classical surveys’.
-
2.
The search makes use of a pre-selection achieved through a cross-correlation of sources detected in surveys carried out in different energy bands, sometimes combined with multi-band spectral restrictions. The candidate BL Lacs can then be identified through optical spectroscopy as in ’classical surveys’ or through statistical identification techniques. The big advantage of this method is that the pre-selection can reduce the number of candidates from several thousands or even millions to much smaller samples including only a few hundreds objects or less.
| Survey | No. of | Radio flux | X-Ray flux l. | |
|---|---|---|---|---|
| BL Lacs | limit (mJy) | erg cm-2s-1 | ||
| Early radio surveys | 1000 | - | - | |
| 1Jy complete sample | 34 | 1000 | - | |
| S4/S5(incomplete) | 7,11 | 500,250 | - | - |
| Einstein EMSS | 41 | 1 | ||
| Einstein Slew Survey | 66 | 1 | - | |
| RASS HBX BL Lacs | 35 | 2 |
| Survey | En. Band | No. of | Vmag | Radio fl | X-Ray flux l. | |
| limits | objects | limit | limit | erg cm-2s-1 | ||
| (mJy) | ||||||
| RGB | R/O/X | 127 | 18 | 25 | - | |
| REX | R/O/X | 44 | 20 | 5 | ||
| DXRBS | R | 30 | 25 | 50 | ||
| Sedentary | R | 162 | 21 | 3.5 |
Table 1 lists the most important classical radio and X-ray surveys together with the main parameters and results on the cosmological evolution of BL Lacs. These surveys select different types of BL Lacs (High energy peaked or HBL, Low energy peaked or LBL, and intermediate objects IBL, see Padovani & Giommi 1995) depending on the energy band and the flux limits. Given the very limited number of objects in each survey it is not possible to study the cosmological evolution comparing luminosity functions built in different redshift shells. The estimator, expected to be 0.5 for a non evolving population of objects (Schmidt 1968), however provides a suitable tool to study cosmological evolution in BL Lacs. Table 1 shows that indicates positive evolution (i.e. ) for bright radio sources and negative evolution for X-ray selected samples (where radio fluxes are rather low). In all cases the statistical significance is about 2 sigma. In the case of the RASS HBX sample decreases and the significance improves if only the extreme HBL objects are considered (Bade et al. 1998). This effect is also present in the EMSS sample (Rector et al. 2000). In both cases less extreme objects are consistent with no cosmological evolution.
Table 2 lists a number of BL Lac samples selected by means of surveys with flux limits in more than one energy band, or where a multi-frequency preselection has been applied to define a sample that is flux limited in one band. Again the different flux limits tend to select different types of BL Lacs. The results range from consistency with no evolution to strong negative evolution for extreme HBL ( ) (Giommi, Menna & Padovani 1999). In the latter survey is significantly below 0.5 only at radio fluxes below 10 mJy.
Strong negative evolution seems to be confined to extreme HBL sources, probably at low radio fluxes.
First results on the REX survey (Caccianiga et al. 2000) however do not seem to confirm this trend, although the radio flux limit (5 mJy) in this case is somewhat higher than that of the other X-ray surveys.
The sedentary survey is the most peculiar among those listed above since it does not rely on direct optical spectroscopy identification of the candidates. In the next paragraph we briefly summarize the main characteristics of this survey and we give an update on the status of the identification process.
3. The Multi-frequency Sedentary Survey: an update
The Multi-frequency Sedentary Survey (Giommi, Menna & Padovani 1999) makes use of a very efficient multi-frequency selection technique to define a large (radio flux limited) sample of extreme ( ) High Energy Peaked BL Lacs (HBL, Padovani & Giommi 1995). In the original paper the sample included 155 objects 58 of which were known BL Lacs and the remaining 97 were still unidentified (but with chance of being BL Lacs). Using this first version of the sedentary survey Giommi et al. (1999a) found evidence for strong negative evolution at fluxes lower than 10-20 mJy. In order to use the best possible estimate of the cosmological evolution of BL Lacs from this survey we have updated it by adding about 40 new identifications obtained partly through our own optical identification program and (mostly) from the recent publication of the results of massive identification campaigns of X-ray sources discovered in the Rosat All Sky Survey (Bauer et al. 2000; Schwope et al. 2000). As expected a very large fraction of the new identifications are indeed BL Lacs. To give an example, of the 27 candidates in the sedentary survey that are in the list of Schwope et al. (2000) 24 are BL Lacs, 1 is a cluster of galaxies (or a BL Lac in a cluster) and only 2 are emission line AGN.
The updated sample now includes 162 objects resulting from the inclusion of a few extra sources that have been identified as BL Lacs just below the limit that was used to avoid contamination with Seyfert Galaxies (see Giommi et al. 1999a) and the removal of the few candidates identified with emission line AGN. Of the 108 identified sources (67% of the sample) 104 are BL Lacs and 4 have been classified in the literature as clusters of galaxies (although these could well be BL Lacs in a cluster). The remaining 54 candidates are still unidentified but, given the very successful identification rate obtained so far, we are confident that these sources are in very large percentage (85%-90%) BL Lacs.
The application of the test, a variant of for surveys with more than one flux limit (see Avni & Bachall 1980), gives the results reported in table 3.
| Radio flux limit | No. of objects | |
|---|---|---|
| (mJy) | in sample | |
| 3.5 | 162 | |
| 5.0 | 140 | |
| 10.0 | 87 | |
| 20.0 | 45 |
The strong indication for negative cosmological evolution ( ) at low radio fluxes found by Giommi et al. 1999a is confirmed. The updated radio logN-logS (not shown here for reasons of space) is also very similar to that derived with the original sample of 155 objects. The source counts fall sharply below the ‘Euclidean’ slope at low fluxes consistently with negative cosmological evolution.
4. Possible interpretations
The most direct explanation of the low values of BL Lacs calls for a cosmological evolution of these objects that is considerably less than that of emission line AGN which have been found to be either more numerous or brighter in the past than now. The space density of BL Lacs (or their luminosity) could instead be approximately constant or even decrease at high redshifts. A model that predicts a lower amount of cosmological evolution in BL Lacs compared to QSO’s as a result of changes in the values of fundamental parameters in the fueling mechanism of the central engine in AGN is described by D’Elia & Cavaliere (2000).
In the following we explore a different hypothesis, namely that the low values of might be caused (at least in part) by geometrical and relativistic effects expected in the beaming scenario. These effects influence the position of the synchrotron peak in the broad-band spectral energy distribution of blazars, and hence the composition of flux limited samples selected in energy bands above the position of .

It is commonly accepted that the broad band electromagnetic spectrum of BL Lacs is dominated by synchrotron emission, up to a peak frequency (in a representation) followed at higher energies by Inverse Compton radiation produced in a relativistically moving plasma seen at a small angle with respect to the line of sight (e.g. Urry and Padovani 1995). Within this scenario the position of the synchrotron peak is determined by the strength of the magnetic field (), the maximum energy of the electron spectrum () and by the beaming Doppler factor () which depends on the bulk motion and on the viewing angle:
| (1) |
The observed range of is extremely wide spanning from for the large majority of BL Lacs selected in radio surveys, to (and possibly higher) for X-ray discovered HBL sources (Pian et al. 1998; Giommi et al. 1999b). Since radio selection is not expected to influence the position of objects showing low frequency peaks are thought to be much more common than HBLs (Padovani & Giommi 1995). Emission line Blazars (also known as Flat Spectrum Radio Quasars FSRQ) also show a variety of values but without reaching very high frequencies as BL Lacs (Padovani 2000; Perlman et al. 2000).
BL Lacs (like all Blazars) are thought to be the fraction of intrinsically much fainter sources that happen to have the beaming axis oriented close to our line of sight. In this framework the luminosity function of BL Lacs can be estimated starting from that of their parent population (Urry & Padovani 1995). Figure 1 shows the observed radio luminosity function (LF) together with that obtained by ”beaming” the LF of FRI radio galaxies, the assumed parent population of BL Lacs. In the beaming scenario the high luminosity end of the beamed LF is built combining the highest luminosities in the parent population with the highest Doppler amplification factors (). Equation (1) then implies that, on average, brighter objects will have higher synchrotron peak frequencies ( ). At the other end of the LF the opposite occurs, namely the low luminosity beamed objects will be characterized by lowest factors, and consequently by lower frequencies. The contributions to the beamed LF of low, intermediate and high Doppler factors are shown in figure 1 as short-dashed, dotted and dashed-dotted lines respectively.
Figure 2 shows the SEDs of two sources at the bright and faint end of the radio luminosity function. Since the factor is on average fairly large in high luminosity objects, eq (1) implies that also is on average located at higher energies in bright sources. The brightness in the X-ray band (marked by the dashed lines) compared to radio intensity ( ) is then larger in high radio luminosity objects than in low power radio sources. This difference favors the inclusion of powerful BL Lacs in surveys of extreme HBLs where the ratio is by definition very high. Near the flux limit of a deep radio survey (where an increasing fraction of the BL Lacs comes from the low luminosity part of the LF) the number of HBLs does not grow as fast as the rest of the population because gets smaller and smaller. This effect could flatten the logN-logS of extreme HBLs and bias their towards low values.

5. Monte Carlo Simulations of BL Lac Surveys
In order to study in a quantitative way the effects of the - radio luminosity dependence described in the previous section we have carried out extensive simulations of surveys with flux limits at radio, optical and X-ray frequencies. In particular we have reproduced the major surveys listed in table 1 and 2, and we have applied to them the same tests that have been applied to real data.
Our procedure can be summarized as follows. We start by simulating a redshift value assuming a standard Friedman cosmological model with and ; then we assign a luminosity to our simulated source by drawing it from the radio luminosity function of BL Lacs shown in figure 1, which was obtained by beaming the luminosity function of FRI galaxies (Urry & Padovani 1995). No cosmological evolution is applied, i.e. the evolution parameter is set to 0. The source intensities at other frequencies (optical and X-ray in this case, but any other energy band can be simulated) are calculated through a Synchrotron Self Compton (SSC) model that produces Spectral Energy Distributions similar to that shown in figure 2. The simulated source is then accepted if its radio, optical and X-ray fluxes are all above the limits chosen for the simulation. In calculating the broad band spectrum from the SSC model the value of the Doppler factor () (which determines the position of in the SED, see figure 2) was correlated to the radio luminosity function so that high luminosity sources have higher probability to have a large as predicted by the beaming model (figure 1). All other SSC parameters (maximum Lorenz factor , magnetic field (), the electron spectral slope etc.) were chosen so that the prediction of the model are consistent with the observed BL Lac SEDs available in the literature.
5.1. Simulations results
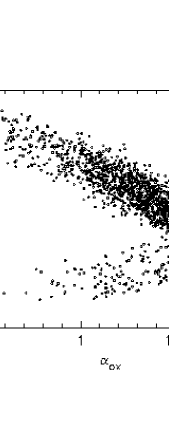
Figure 3 shows the - plane of a simulated radio flux limited survey with (left panel) and of an X-ray survey limited by erg cm-2s-1 and by radio flux (right panel).
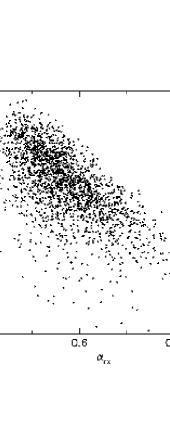
This last simulation reproduces the subset of BL Lacs in the Rosat all sky survey (RASS) that have radio flux high enough to be included in the NVSS survey (Condon et al. 1998). Thick circles to the left of the diagonal line represent those objects with and that make a radio flux limited sample of extreme HBLs as in the ‘sedentary survey’. A sample of 2000 sources was produced in each simulation run. We have then analyzed the distribution in all simulated surveys and compared the results with those of the ‘sedentary’ and EMSS surveys.
The results of the analysis applied to the ‘sedentary survey’ give = for the case of a radio flux limit of 3.5 mJy and = 0.50 for a 20 mJy flux limit. This increase of the with radio flux reproduces very well the observational results reported in table 3 demonstrating that a dependence of the beaming Doppler factor on radio luminosity can induce a bias in the estimation of at low fluxes. However we note that these results can be obtained only within a narrow range of the parameters that determines how the Doppler factor depends on radio luminosity. This mechanism works in BL Lacs and not in emission line blazars because the distribution of synchrotron peak energies is different in the two classes, with reaching X-ray and possibly higher frequencies in BL Lacs (Giommi et al. 1999b) and at most the optical/UV band in other blazars (Padovani 2000).
| limits | No. of objects | |
|---|---|---|
| in sample | ||
| All values | 2000(1900) | |
| 852(749) | ||
| 348(279) | ||
| 204(160) |
We have next considered the case of a ‘classical’ X-ray flux limited survey like the EMSS. To keep things simple we have chosen a single X-ray flux limit equal to erg cm-2s-1 rather than a sky coverage with multiple flux limits. We do not expect significant differences between the two cases. The that we obtained for the total sample is 0.49, only slightly lower than the expected value of 0.5 in case of no dependence between and luminosity. We have then verified whether our simulated survey shows the strong dependency of on the ratio (or, equivalently on ) found by Rector et al. 2000. Table 4 shows the values for increasing values of . A clear dependency of the on is confirmed. This dependence, however is still present even if is set to be constant for all simulated sources. The decrease of at high values in our simulation is due to the fact that high sources close to the X-ray survey limit must be weak radio sources near the low luminosity end of the radio luminosity function. At even higher values the radio luminosity becomes lower than the low luminosity limit of our LF and the number of sources drops. Another, possibly more important, reason for the observed dependency on could be incompleteness of the sample at very faint optical magnitudes. In a X-ray flux limited sample high (low ) sources tend to have faint optical magnitudes as shown in the left part of figure 4 where the is plotted against mV. A small incompleteness, possibly arising from the misclassification of optically very faint BL Lacs with cluster of galaxies or radio galaxies, introduces a spurious correlation between and . We have simulated this incompleteness by removing 5% of the sources at the optically faint end of the simulated survey. The results are reported in parenthesis in table 4 where we can see that the decrease of with becomes considerably higher than in the complete sample. The right plot in figure 4 shows a clear correlation between redshift and showing that extreme HBL sources are expected to be on average at higher redshift that less extreme BL Lacs as found by Bade et al. (1998).
6. Conclusions
Various surveys at radio and X-ray frequencies show that the amount of cosmological evolution in BL Lacs is significantly lower than that found in other types of AGN. The results however vary from no evolution (or slightly positive evolution) at high flux values to strong negative evolution at faint fluxes, especially for extreme objects with very high .
By means of extensive Monte Carlo simulations we have explored various causes that might contribute to explain these findings. The following results were obtained.
-
•
A dependency of the beaming Doppler factor on radio luminosity (expected in the relativistic beaming scenario) can at least partially explain the low values found in some X-ray and radio flux limited samples.
-
•
Edge effects due to the flattening at the low luminosity end of the radio luminosity function of BL Lacs can be one of the reasons for the correlation of and X-ray loudness ( ).
-
•
Even small amounts of incompleteness at very faint optical fluxes induce a correlation between and similar to that seen in the EMSS and RASS HBX Surveys.
References
Avni, Y., & Bachall, J. N. 1980, ApJ, 235, 694
Bade, N., Beckmann, V., Douglas, N. G., et al. 1998, A&A, 334, 459
Bauer, F.E., Condon, J.J., Thuan, T.X., Broderick, J.J. 2000, ApJS, 129, 547
Blandford, R. D. & Rees, M. J. 1978, in Pittsburgh Conference on BL Lac Objects, ed. A.N. Wolfe (Pittsburgh: University of Pittsburg Press), 328
Caccianiga, A., Maccacaro, T., Wolter, A., Della Ceca, R., & Gioia, I. M. 2000, these proceedings
Condon, J. J., Cotton, W. D., Greisen, E. W., Yin, Q. F., Perley, R. A., Taylor, G. B., Broderick, J. J. 1998, AJ, 115, 1693
D’Elia, V., & Cavaliere A. 2000, these proceedings
Giommi, P., Menna, M.T., & Padovani, P. 1999a, MNRAS, 310, 465
Giommi, P., Ghisellini G., Padovani, P. & Tagliaferri, G. 1999b Proc of ”X-Ray Astronomy 1999, Bologna, in press, astro-ph/0003021
Morris, S. L., Stocke, J. T., Gioia, I. M., Schild, R. E., Wolter, A., Della Ceca, R. 1991, ApJ, 380, 49
Maccacaro, T., et al. 1983, ApJ, 266, 73
Padovani, P. & Giommi, P. 1995, ApJ, 444, 567
Padovani, P. 2000, these proceedings
Perlman, E. et al. 2000, these proceedings
Piccinotti, G., Mushotzky, R. F., Boldt, E. A., et al. 1982, ApJ, 253, 485
Pian, E., et al. 1998 ApJ, 492, L17
Rector, T.A., Stocke, J. T., Perlman, E. S., Morris, S. L., Gioia, I. M. 2000, AJ, 120, 1626
Schmidt, M. 1968, ApJ, 151, 393
Schwope A., et al. 2000 Astronomische Nachrichten, 321, 1
Stocke, J., Liebert, J., Stockman, H., Danziger, J., Lub, J., Maccacaro, T., Griffiths, R., Giommi, P. 1982, MNRAS, 200, 27p
Urry, C.M., & Padovani, P. 1995, PASP, 107, 803
Wolter, A., Gioia, I. M., Maccacaro, T., Morris, S. L., Stocke, J. T. 1991 ApJ, 369, 314