Terapixel Surveys for Cosmic Shear \toctitle—- 11institutetext: Institut d’Astrophysique de Paris, 98 bis Bd Arago, 75014 Paris, France 22institutetext: Obs. de Paris, DEMIRM, 77 av. Denfert Rochereau, 75014 Paris, France 33institutetext: CITA, 60 St. George Street, Toronto M5S 3H8, Canada 44institutetext: OAC, via Moiariello 80131 Napoli, Italy 55institutetext: CFHT, P.O. Box 1597, Kamuela Hawaii 96743, USA 66institutetext: LAS, 13376 Marseille Cedex 12, France 77institutetext: SAp, CE Saclay, 91191 Gif-sur-Yvette Cedex, France 88institutetext: Dipartimento di Fisica, Università di Roma “La Sapienza”, Italy 99institutetext: MPA, Karl-Schwarzscild Str. 1, 85748 Garching, Germany 1010institutetext: SPhT, CE Saclay, 91191 Gif-sur-Yvette Cedex, France 1111institutetext: Universitaet Bonn, Auf dem Huegel 71, 53121 Bonn, Germany 1212institutetext: John Hopkins University, Dept. of Physics, Baltimore MD21218, USA
*
Abstract
The recent detections of cosmic shear signal announced by several groups have demonstrated the feasibility of this challenging program and convinced astronomers of its potential for cosmology. Cosmic shear analysis demands to handle Gigabytes of data in order to probe several square degrees in subarcsecond deep imaging mode. The success of these surveys is sensitive to the designs of the observation strategy, the organization of the data reduction pipelines and the links of the data base with surveys like X-ray or spectroscopic follow up. We describe the cosmic shear surveys we have carried out at the VLT and at CFHT and the way we handle this huge data set in a more general context including the VIRMOS and the XMM-LSS surveys, and the future CMB surveys.
1 Cosmology with weak lensing
Large-scale structures of the universe induce gravitational
lensing effects which accumulate on
photons emitted by distane sources. On deep CCD images,
they revealed themselves as a weak modification of the shape of
galaxies which adds to their intrinsic ellipticity
to produce a cosmological shear signal, called
the cosmic shear. The light beam deformation
witnesses the history of mass density fluctuations
from the emitting (lensed) sources to the observer. Therefore,
it is a signature
of the cosmological scenario of structure formation and its
study should provide
interesting clues on several cosmological quantities,
like the cosmological parameters, the
power spectrum of density fluctuations and the biasing111http://www.iap.fr/LaboEtActivites/ThemesRecherche/Lentilles/LentillesTop.html.
The cosmological potential of cosmic shear has been
pointed out by a decade of theoretical studies.
Since most of the condensations crossed by photons
are extended large-scale structures, their cumulative
lensing effects can be computed by applying the
perturbation theory to low mass density contrast lenses.
In the case of a single lens plane and assuming the
shape of the power spectrum of density fluctuations
is a power law (ie ), perturbation theory
applied to weak cosmological lensing provides interesting
insights on the sensitivity of
the gravitational convergence, (ie the projected
mass density of lenses), and the gravitational
shear, (ie the distortion), to
cosmological models:
-
•
For small perturbations, the variance of the convergence averaged over an angular scale , depends on cosmological quantities in a simple way:
(1) where is the normalization of the power spectrum, the redshift of sources.
-
•
Likewise, the skewness of the convergence on angular scale , , writes:
(2) (Bernardeau et al [1]). Hence, when they are used jointly, the variance and the skewness can constrain simultaneously and .
-
•
The gravitational convergence can be easily related to the gravitational shear, :
(3) Since in the weak lensing regime is measured directly from the gravity-induced ellipticity of galaxies, the cosmic shear can be estimated almost directly from the measurement of galaxy ellipticities.
-
•
The amplitude of the weak lensing signal is not beyond the reach of present-day instruments. Jain & Seljak [2] or van Waerbeke et al [3] (2000b) explored the non-linear regime of mass density fluctuations which mostly changes the convergence on small scales. The non-linear evolution of the power spectrum increases the amplitude of the cosmic shear by a factor of two as compared to the linear prediction. Hence, on angular scales below 10’, the cosmic shear is already measurable with current ground-based telescopes.
2 Definition of the cosmic shear survey
Cosmological distortion only increases the ellipticity of lensed
galaxies by a few percents. Its detection, which is hampered
by artificial distortions of similar amplitude,
can only be recovered statistically from the morphological study of
thousands of galaxies
spread over several degrees of the sky. Hence, in order to recover
the cosmic shear signal it is necessary to carry out
a deep wide field survey and to handle a huge amount of data.
Van Waerbeke et al [4] used
extensive simulations in order to design the survey
and to infer its minimum angular coverage to recover
cosmological quantities. It turns out that a shallow survey covering
a large field of view is a better strategy than a deep
cone. An optimal design seems to be a survey
covering 10 10 deg2 up
to . At this depth, the redshift distribution of the sources
can be constrained from photometric and spectroscopic
redshifts with enough accuracy to separate most realistic cosmological models
with a good significance level. This is the
strategy we are preparing for the MEGACAM survey.
We can also use these simulations in order to design a more modest
cosmic shear survey feasible on a short time scale. The
results listed in Table 1
show that the variance of can be
measured with a good significance if the survey size
covers at least one deg2, whereas
about 10 deg2 are needed to estimate its skewness. This can
already be done with present-day instrumentation, like the UH8K, the
CFH12K or WFI and CFHT or at ESO.
| , Top Hat Filter , gal.arcmin-2 | ||||
| FOV | S/N Variance | S/N Skewness | ||
| (deg.deg.) | ||||
| 1.251.25 | 7 | 5 | 1.7 | 2 |
| 2.52.5 | 11 | 10 | 2.9 | 4 |
| 55 | 20 | 20 | 5 | 8 |
| 1010 | 35 | 42 | 8 | 17 |
| Reference | Telescope | Lim. Mag. | FOV | Nb. fields |
|---|---|---|---|---|
| van Waerbeke et al [5] | CFHT | I=24 | 1.7 deg2 | 5 |
| Wittman et al [7] | CTIO | R=26 | 1.5 deg2 | 3 |
| Bacon et al [8] | WHT | R=24 | 0.5 deg2 | 13 |
| Kaiser et al [9] | CFHT | I=24 | 1.0 deg2 | 6 |
| Maoli et al [6] | VLT-UT1 | I=24 | 0.5 deg2 | 45 |
3 Detection and analysis of first cosmic shear signals
The four teams which carried out a cosmic shear survey
used different instruments, observed different fields
of view and used different
techniques to analyze the data and correct for the PSF anisotropy.
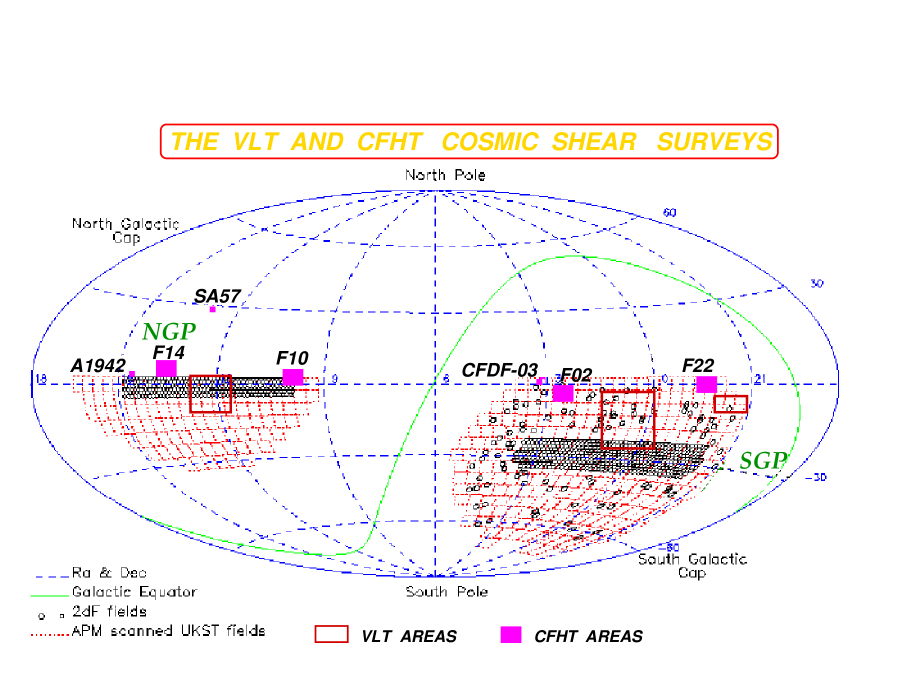
The CFHT and VLT surveys reported in van Waerbeke et al
[5] and Maoli et al
[6] respectively (see Fig. 1)
consist in two independent
data sets, which enable us to cross-check
our results and to explore the reliability of our
corrections of systematics. The 45 VLT are of special interest
because the data were obtained in service mode which permits
to get an homogeneous sample of data obtained in very similar
depth and seeing
conditions. The VLT targets are spread over more than 1000 squares degrees,
each
of them being separated from the others by at least 5 degrees. These
uncorrelated fields provide a direct measurement of the cosmic variance,
without need of simulations.
The results of the four surveys are summarized in Table 2 and in Fig. 2. The most striking feature on this plot is the remarkable similarity of the results in the range 1’ to 10’ . This is a very strong point which validates the detection and guarantees that they are reliable and robust, despite concerns about systematics.
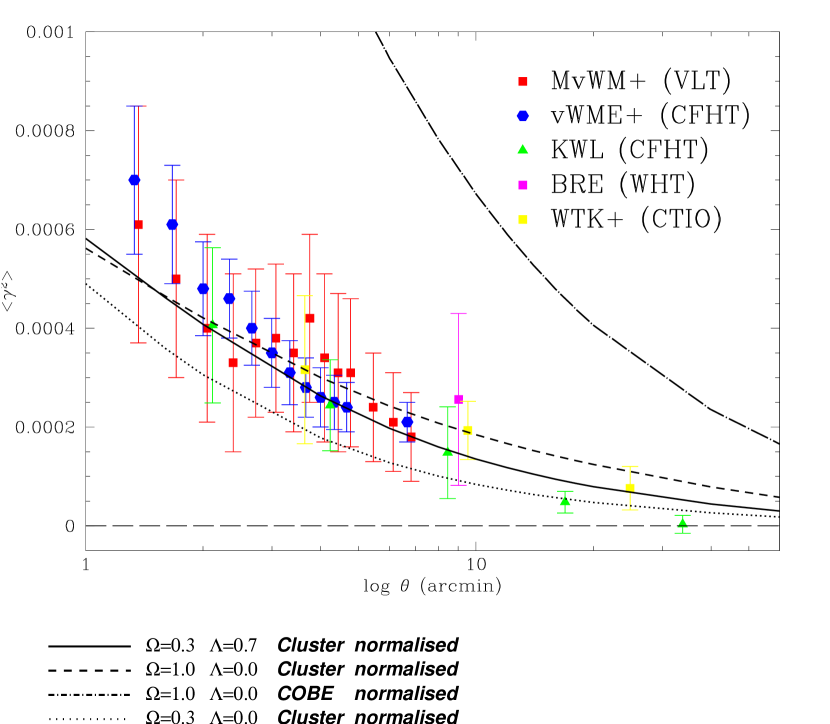
The comparison of the measurements with some typical cosmological models displayed in Fig. 2 (the non-linear evolution of the power spectrum is computed with the coefficient given in Peacock [10], which seems to provide lower amplitudes of the variance of the shear than previous coefficients) leads to the following conclusions:
-
•
The simultaneous use of independent data provided by the five groups permits to rule out some models with a very high significance. In particular, the SCDM COBE-normalized model is rejected to at least a 5- level.
-
•
In contrast, most popular cluster-normalized models fit the data reasonably well and the discrimination between them is not possible. This illustrates that error bars are still too large and also that the variance of the shear is not enough to break the degeneracy (). Only once the skewness of the convergence will be measured we will be in much better position to constrain cosmological scenarios.
The depth of these surveys corresponds to sources at redshift of about
. The typical efficiency function, which describes the
lensing strength of the lenses as function of the redshift
distributions of the lenses and the sources,
should therefore peak at redshift .
On angular scales between 1’ and 10’, since the non-linear structures
dominate
the signal, most of the cosmic shear is produced by structures having
physical sizes of about Mpc. Hence,
these cosmic shear surveys
mainly probe weak cosmological lensing produced by
clusters of galaxies and compact groups.
The constraints provided by cosmic shear are formally similar to
those from cluster abundances obtained from
counts of clusters in optical or X-ray surveys (Eke et al [11],
Eke et al [12],
Bridle et al [13]). Depending on the angular scales,
the variance of the cosmological convergence writes:
| (4) |
whereas, for cluster abundances the constraints have formally the following dependences:
| (5) |
The cosmic shear has the advantage of being a direct measurement of the
lensing
effects produced by dark matter. In contrast, the cluster abundances
measures the fraction of massive clusters from the light
distribution, which implies, either empirical relation
between light and mass (like emissivity-temperature relation), or
assumptions
of the geometry and the physical state of the baryonic and
non-baryonic components.
4 Massive data processing for cosmic shear surveys
The estimations of the survey size done by van Waerbeke et al (1999)
provide the minimum angular size needed to measure both the variance
and the skewness of the convergence. However,
we ultimately plan to produce a projected mass map of the sky
and to deproject the power spectrum of the mass
density fluctuations over physical sizes as large as 100 Mpc. We
therefore need to probe at least 100 square-degrees and to
get informations on the redshifts of the lenses and the sources.
The CFHT cosmic shear survey we are currently carrying out covers
the sky area of
the VIRMOS imaging survey which will
cover an angular size of 16 square degrees in BVRI at CFHT, plus
the U-band and a fraction in J and K at the ESO telescopes. In total, more
than 256 CFH12K pointings in four colors are expected. Including the
calibration files, it corresponds to about 3 Terabytes of data and more than
40, 000 FITS files. This huge amount of data prefigures the
complexity of data handling in future surveys, like those that will be done
at CFHT with the 20K18K MEGACAM camera [14].
The TERAPIX data center installed at IAP is designed in order to
provide facilities to MEGACAM users but is already widely used to
process UH8K and CFH12K images. Its role is to develop softwares and
pipelines and to provide hardware and technical assistance to astronomers
who are using wide field cameras like UH8K, CFH12K, WFI and, later,
MEGACAM and OMEGACAM.
Many softwares commonly used by observers or in other pipelines
are actually developed, updated or validated at the TERAPIX data center
(This is for instance the case of SExtractor, WEIGHTwatcher or
FLIPS which is currently developed at CFHT). TERAPIX is also developing
new softwares/pipelines/interfaces for astrometric corrections, co-addition
of images, new image display and preprocessing tools, like
the PANORAPIX image display, (see Radovich et al’ poster in these proceedings). In
addition, it is
preparing a new Object Oriented Data Base which will drive and will organize
the future MEGACAM survey in the perspective of the enlarged
MEGACAM/VIRMOS/XMM survey.
Regarding the hardware side, the TERAPIX data center has 3 COMPAQ EV5,
EV6 and EV67 XP1000 computers,
4 LINUX PCs, 3 X-terminals, more than 2 Tb of RAID-5 disk space and
usual DDS3/DLT4000/DLT7000 tape drives. This is not the final
configuration of the data center, but its size matches well the
needs for WFI, UH8K and CFH12K images.
TERAPIX has processed 1.7bytes the VIRMOS/WL
of images from December 1999 to August 2000, corresponding to more than
22, 000 FITS files. This survey turns out to be very
helpful to prepare the pipelines for MEGACAM and to foresee the
potential problems we could face on in the future.
At the end of the survey, more than
4 Terapixels will have been processed by TERAPIX.
One important issue
is the organization of the data base which in principle should
control the pipeline and keep track of the complete history of the
processing and of the archiving. Since our weak lensing surveys
should be coupled with the VIRMOS redshift surveys222http://www.astrsp-mrs.fr/virmos/, the XMM
large scale structure survey333http://vela.astro.ulg.ac.be/themes/spatial/xmm/LSS/, as well as the
VLA and SZ follow up, we expect to provide a data base
which will be easily handled by the consortium. These wishes
have not yet any concrete impact on TERAPIX. At this stage we are
still trying to provide some specifications on the basis of the
scientific objectives we have in mind, as those we summarize in the
next section, which will certainly demand multi wavelength data bases.
5 Cosmic shear in a virtual observatory context
The detection of a cosmic shear signal is a first step toward a comprehensive investigation of the dark matter of the universe and its role on formation and evolution of structures and galaxies. Since a complete understanding of the cosmological scenario implies both the baryonic and non-baryonic contents of the universe, cosmic shear data only is not enough and the survey should be completed by additional data from optical/NIR, X-ray and radio surveys or even CMB surveys. The issues addressed below summarize some important goals which need multiple data sets coming from several surveys and concerning data of different nature.
-
•
Redshift distribution of the sources: as shown by Eq. (1) and (2), both the variance and the skewness of the convergence depend on the source redshift. We therefore do need spectroscopic follow up and calibration of photometric redshifts of the galaxies used in the cosmic shear sample.
-
•
The source clustering problem: Due to galaxy clustering, the amplitude of the gravitational shear may strongly vary from one line-of-sight to another. The average redshift distribution of the sources can be biased by the galaxies located within the massive structure, which affect the value of the convergence in a similar way. The recent simulations done by Hamana et al [15] and (Thion et al [16]) show that source clustering significantly perturb the signal by 20%. A simple way to avoid this problem is to reduce the redshift range of the selected sources. Hamana et al [15] demonstrated that the uncertainty can be reduced to 1% if one uses sources within a redshift range of . So, in principle deep surveys like the imaging+spectroscopic VIRMOS will enable us to solve this issue.
-
•
Test on the linear biasing: Schneider [17] and van Waerbeke [18] (2000c) pointed out that the cross correlation of galaxy distribution with the aperture mass statistics only depends on the cosmological models and the linear biasing factor. When the cross correlations on two different angular scales are compared, one can probe the evolution of the linear biasing with angular scale and with redshift. This estimator, which may be of crucial importance to constrain the scenario of galaxy formation, is insensitive to cosmological parameters which makes this tool very attractive. In practice, it means that one need to couple multiple data sets: photometric, redshift and shear catalogues averaged on various angular/physical scales.
-
•
Baryonic vs. non-baryonic matter distribution: part of the cosmic shear surveys we are carrying out maps the dark matter distribution in the sky area which will be also covered by the XMM large scale structures survey. The common area will provide simultaneously, the stellar light, the hot-gas and the dark matter distributions on scales ranging from 1 arc-minutes to one degree. At least a complete sample of clusters and groups of galaxies will be investigated in detail in order to recover the baryonic to non-baryonic fraction of matter, the mass profiles of each distribution in clusters and groups of galaxies and the large-scale filamentary distributions of both components.
Alternatively, the XMM X-ray selected sample of clusters of galaxies will provide a fairly accurate estimate of the cluster abundances up to . From this, one can infer the normalization of the power spectrum and therefore break the degeneracy between and which is expressed in Eq. (1). -
•
Relation between Large-scale structures and AGNs/EROs: as for clusters and groups, the XMM surveys will probe the large-scale distributions of X-ray point sources emitted by AGNs. The most recent Chandra and XMM deep surveys seem to show that a significant fraction of EROs are indeed X-ray sources as well. Cosmic shear, X-ray and deep photometric catalogues can therefore be used jointly to explore the relation between AGNs, EROs and large-scale structures detected by weak lensing mass reconstruction.
-
•
Cross correlating galaxy and CMB weak lensing signal: likewise galaxies, the temperature fluctuations of the CMB map can be distorted by foreground lenses along the line of sights. In principle, the distortion pattern of the CMB map does contain similar informations as galaxies, but with the advantage that the redshift of the source is well known (ie !). Bernardeau [19] explored this idea but concluded that the weak lensing signal produced on the CMB will be marginal. A better strategy is to analyze the gravitational shear simultaneously on both the CMB temperature maps and the galaxies. Van Waerbeke et al [20] (2000d) pointed out that the correlation of these signals will significantly improve the detection of lensing on CMB maps produced by the Planck Surveyor mission.
-
•
Coupling real data set with mock catalogues: this is an important point which should not be neglected in a survey. The real data set must be compared to mock catalogues illustrating realistic universes and analyzed in exactly the same conditions as the real data. This enables to estimate accurately the cosmic variance and the sources of systematics. Mining the sky does necessarily imply to make mock catalogues available.
-
•
Intrinsic correlated polarization of galaxies If the intrinsic orientations of galaxies are not randomly distributed, their coherent alignment may correlate to the geometry of large scale structures in which they are embedded. If so, the coherent alignment produced by weak lensing will be corrupted by the intrinsic alignment of the galaxies and a mass reconstruction based on the shear pattern will be strongly contaminated by spurious weak lensing signal. Recent analyses carried out by Croft & Metzler [21] and Heavens et al. [22] conclude that on scales smaller than 10 arcminutes the intrinsic correlation should not contaminate the weak lensing signal, provided the survey is deep enough in order to probe distant lensed galaxies. In contrast for shallow survey the conclusions are more pessimistic and the intrinsic correlation could even dominate the signal.
The intrinsic ellipticity problem is an issue that can be addressed by using different surveys. For instance, the nearby galaxy sample provided by the SDSS can easily check whether such correlations exist and up to which angular scales it dominates the cosmic shear signal.
6 Conclusions
Thanks to the recent detections of cosmic shear signal, we know that
weak lensing surveys can now provide reliable informations on the
large-scale dark matter distribution in the universe which
would be inaccessible otherwise. The scientific impact
of these surveys should increase rapidly. On going
wide field cosmic shear surveys are going to produce the first measurements
of the variance, the skewness of the convergence in less than
one year and we expect to infer
the properties of the power spectrum of mass density fluctuations
and the linear biasing up
to degree scales within the next 5 years.
These exciting perspectives contrast with the worrysome technical
issues we may face on regarding data handling. Besides the
hundreds of Terabytes of data which have to be processed, we
also have to think about archiving and data mining.
The optimal use of weak lensing statistics demands to handle
simultaneously the baryonic and non baryonic content of the universe.
Optical/NIR and X-ray/SZ surveys dealing with the baryon content
and its
evolution with look back time must be analyzed together with the
dark matter distribution and interpreted in cosmological contexts
which can be described by numerical simulations. The complexity
of the joint data analyses is certainly a challenge for the
future. The solution we are preparing for MEGACAM is a joint
multi-wavelength survey which is designed in advance in order to
optimize the strategy and the archiving. In the future, we hope that
the MEGACAM/VIRMOS/XMM/VLA program will provide an
easy-to-use and homogeneous database which will
include for the first time the dark matter content for multipurposes
cosmological projects.
Acknowledgements
We thank M. Pierre, T. Hamana and A. Thion for fruitful discussions. YM thanks the organizers of the meeting for travel support. This work was supported by the TMR Network “Gravitational Lensing: New Constraints on Cosmology and the Distribution of Dark Matter” of the EC under contract No. ERBFMRX-CT97-0172.
References
- [1] Bernardeau, F., van Waerbeke, L., Mellier, Y. 1999, A&A 322, 1.
- [2] Jain, B., Seljak, U. 1997, ApJ 484, 560.
- [3] van Waerbeke, L., Hamana, T., Scoccimaro, R., Colombi, S., Bernardeau, F. 2000, submitted (2000b).
- [4] van WaerbeKe, L., Bernardeau, F., Mellier, Y. 1999, A&A 342, 15.
- [5] van Waerbeke, L., Mellier, Y., Erben, T. et al 2000, A&A 358, 30.
- [6] Maoli, R., Mellier, Y., Van Waerbeke, L. et al 2000, Astro-ph/0008179.
- [7] Wittman, D.M., Tyson, A.J.,, Kirkman, D. et al 2000, Nature 405, 143..
- [8] Bacon, D., Réfrégier, A., Ellis, R.S. 2000, Astro-ph/0003008.
- [9] Kaiser, N., Wilson, G., Luppino, G. 2000, Astro-ph/0003338.
- [10] Peacock, J.A. 1999. “Cosmological Physics”. Cambridge.
- [11] Eke, V.R., Cole, S., Frenk, C.S. 1996, ApJ 282, 263.
- [12] Eke, V.R., Cole, S., Frenk, C.S., Henry, P.J. 1998, ApJ 298, 1145.
- [13] Bridle, S.L., Eke, V.R., Lahav, O. et al 1999, MNRAS 310, 565.
- [14] Boulade, O., Charlot, X., Abbon, P. et al 2000. SPIE’s ”Astronomical Telescopes and Instrumentation 2000”, Munich, 2000 .
- [15] Hamana, T., Colombi, S., Mellier, Y. 2000, Proceedings of the XXth Rencontres de Moriond. ”Cosmological Physical with Gravitational Lensing”. Y. Mellier, J.-P. Kneib, M. Moniez, J. Tran Thanh Van eds. Astro-ph/0009459.
- [16] Thion, A., Mellier, Y., Bernardeau, F., Bertin, E., Erben, T., van Waerbeke, L. 2000, Proceedings of the XXth Rencontres de Moriond. ”Cosmological Physical with Gravitational Lensing”. Y. Mellier, J.-P. Kneib, M. Moniez, J. Tran Thanh Van eds. Astro-ph/0008180.
- [17] Schneider, P. 1998. ApJ 498, 43.
- [18] van Waerbeke, L. 2000c, A&A 334, 1.
- [19] Bernardeau, F, 1998. A&A 338, 767.
- [20] Van Waerbeke, L.; Bernardeau, F.; Benabed, K. 2000d, ApJ, 540, 14.
- [21] Croft, R.A.C., Metzler, C. 2000, Astro-ph/0005384.
- [22] Heavens, A., Réfrégier, A., Heymans, C. 2000, Astro-ph/0005269.