Sunyaev-Zel’dovich Effect Imaging of
Massive Clusters of Galaxies at Redshift
Abstract
We present Sunyaev-Zel’dovich Effect (SZE) imaging observations of three distant () and highly X-ray luminous clusters of galaxies, Cl J1226.9+3332, Cl J0152.71357 and MS 1054.40321. Two of the clusters, Cl J1226.9+3332 and Cl J0152.71357, were recently discovered in deep ROSAT x-ray images. Their high X-ray luminosity suggests that they are massive systems which, if confirmed, would provide strong constraints on the cosmological parameters of structure formation models. Our Sunyaev-Zel’dovich Effect data provide confirmation that they are massive clusters similar to the well studied cluster MS 1054.40321. Assuming the clusters have the same gas mass fraction as that derived from SZE measurements of eighteen known massive clusters, we are able to infer their mass and electron temperature from the SZE data. The derived electron temperatures are , , and keV, respectively, and we infer total masses of M⊙ within a radius of 65″ (340 kpc) for all three clusters. For Cl J0152.71357 and MS 1054.40321 we find good agreement between our SZE derived temperatures and those inferred from X-ray spectroscopy. No X-ray derived temperatures are available for Cl J1226.9+3332, and thus the SZE data provide the first confirmation that it is indeed a massive system. The demonstrated ability to determine cluster temperatures and masses from SZE observations without access to X-ray data illustrates the power of using deep SZE surveys to probe the distant universe.
1 Introduction
The existence of galaxy clusters at high redshift can place powerful constraints on the physical and cosmological parameters of structure formation models (Bahcall & Cen (1992); Luppino & Gioia (1995); Oukbir & Blanchard (1997); Donahue et al. (1998); Eke et al. (1998); Haiman et al. (2000)). The greatest leverage is provided by the most massive and distant clusters (e.g., Viana & Liddle (1996)). Two distant and highly x-ray luminous clusters were recently discovered in deep ROSAT x-ray images: Cl J1226.9+3332, a cluster at redshift , was discovered in the WARPS survey (Ebeling et al. 2001; Scharf et al. 1997). Cl J0152.71357, at redshift , was detected in the RDCS, SHARC, and WARPS surveys (Della Ceca et al. 2000; Romer et al. 2000; Ebeling et al. 2000). Based on their x-ray luminosities ( erg s-1), these clusters are thought to be highly massive which, if confirmed, will provide significant constraints on cosmological models (Bahcall & Fan 1998).
In this paper, we present interferometric imaging of the Sunyaev-Zeldovich Effect (SZE) in these clusters, which provides a measure of the gas pressure integrated along the line of sight (Sunyaev & Zel’dovich 1972; Birkinshaw 1999). The change in the observed brightness temperature of the Cosmic Microwave Background (CMB) radiation that results from passage through the thermally ionized gas permeating a galaxy cluster is given by
where is the microwave background temperature (2.7 K); is the Thomson scattering cross section; and , , and are the electron mass, density, and temperature. The frequency dependence of the SZE is represented by ; in the Rayleigh-Jeans limit, . We use the SZE to determine the mass of Cl J1226.9+3332 and Cl J0152.71357 using the methods developed by Grego et al. 2001; in addition, we present interferometric SZE data on MS 1054.40321, a cluster of known temperature and mass at (Gioia & Luppino 1994; Donahue et al. 1998; Hoekstra et al. 2000), which provides a standard against which the WARPS clusters can be compared.
The SZE observations and data analysis are described in section II, and the conclusions drawn from these data will be found in section III. Throughout this Letter we parameterize the Hubble constant in terms of , where km s-1 Mpc-1, and we use the cosmological parameters =0.3 and =0.7 unless otherwise stated. Uncertainties are reported at the confidence level.
2 Interferometric Imaging of the Sunyaev-Zel’dovich Effect
2.1 Observations
To image the Sunyaev-Zeldovich Effect in these distant clusters, we outfitted the Owens Valley Radio Observatory (OVRO) and Berkeley-Illinois-Maryland-Association (BIMA) millimeter interferometers with sensitive centimeter-wave receivers optimized for SZE measurements (Carlstrom et al. 1996). Our receivers use cryogenically cooled 26-36 GHz high electron mobility transistor (HEMT) amplifiers (Pospieszalski et al. 1995), with characteristic receiver temperatures of 11-20 K at the 28.5 GHz frequency used for these observations. The cluster pointing centers and on-source integration times are given in Table 1.
The interferometric measurements of Cl J1226.9+3332, and Cl J0152.71357 were made at the BIMA interferometer in 1998 and 2000 with nine 6.1 meter antennas in a closely packed configuration to maximize sensitivity to the SZE, with a FWHM primary beam and baselines ranging from 0.6 to 14.3 k ( 6-140 m). Typical system temperatures, scaled to above the atmosphere, are 40-45 K in an 800 MHz band centered at 28.5 GHz. Observations of a bright phase calibrator were interleaved with cluster measurements every 25 minutes, and Mars was used for amplitude calibration (Rudy 1987; Grego et al. 2000). The MIRIAD software package (Sault et al. 1995) was used to calibrate and edit the visibility data and to output the reduced data in UVFITS format for subsequent analysis.
The interferometric measurements of MS 1054.40321 were made at the OVRO millimeter array in June 1996 with six 10.4 meter antennas in a closely packed configuration, with a FWHM primary beam and baselines ranging from 1.0 to 12.0 k ( 10-120 m). Typical system temperatures, scaled to above the atmosphere, are 45 K in two 1 GHz channels centered at 28.5 and 30.0 GHz (2 GHz total bandwidth). Observations of a bright phase calibrator were interleaved with cluster measurements every 24 minutes. The MMA software package (Scoville et al. 1993) was used to calibrate and edit the visibility data and to output the reduced data in UVFITS format for subsequent analysis.
We flagged data from baselines when one of the telescopes was shadowed by another telescope in the array, cluster data that were not bracketed in time by phase calibrator data (mainly at the beginning or end of a track), data for which the phase calibrator indicated poor atmospheric coherence, and, rarely, data with spurious correlations.
2.2 Data Analysis
In order to properly model the cluster, we must account for any point sources in the field. To identify these point sources, we used DIFMAP (Pearson et al. 1994) to produce a high resolution image, using only data from baselines longer than 20 meters. The resulting synthesized beam sizes, RMS noise levels, and point source detections are given in Table 2.
We perform a quantitative analysis of the observed SZE profiles by fitting isothermal models (Cavaliere & Fusco-Femiano 1976, 1981) and point source profiles to the interferometric data directly in the Fourier (u,v) plane, where the noise characteristics and the spatial filtering of the interferometer are well understood. The spherical isothermal model density is described by
| (1) |
where the core radius and are shape parameters, and is the central electron number density. With this model, the SZ Effect temperature decrement is
| (2) |
where , , is the angular diameter distance, and is the temperature decrement at zero projected radius.
We determine the best-fit point source positions and fluxes, as well as the cluster centroid, using a simplex algorithm which minimizes the chi-squared statistic (Reese et al. 2000). We fix the cluster centroid and the point source positions and fluxes at their best-fit values, and calculate the chi-squared statistic over a large range of , , and values. For a given electron temperature, , the model then yields the gas density profile ) at each (, , ) point. The gas mass and the total cluster mass can be calculated directly from ), assuming that the intracluster medium (ICM) is in hydrostatic equilibrium with the cluster potential. Following the methods outlined in Grego et al. 2001, we calculate the gas mass, total mass, and gas mass fraction over the (,, ) grid, and report the total mass values for which the statistic is within the 68% confidence interval (). We evaluate these quantities at an angular radius of 65″, where our observational techniques best constrain the cluster gas mass fraction (Grego et al. 2001). For clusters at , this angular radius corresponds to a physical radius of 340 kpc for an =0.3, =0.7 cosmology.
We can estimate the electron temperature directly from the SZE data by finding the range of values that yield a cluster gas mass fraction, , consistent with the mean value measured by Grego et al. (2001) for a sample of eighteen clusters. To determine the gas mass fraction at for Cl J1226.9+3332, Cl J0152.71357, and MS 1054.40321 , we scale the gas mass fractions measured at 65″ to using relations derived from numerical simulations (Evrard et al. 1996; Evrard 1997), as discussed in Grego et al. (2001). This calculation is repeated for a number of different temperatures ranging from 4-18 keV, and we report the values that are consistent with a mean value of (Grego et al. 2001) within the sample standard deviation of 0.04. To determine how sensitive the derived mass and temperature are to the adopted cosmological model, we repeated the calculations above for =0.3 and =0.0. The SZE derived mass and temperature are reduced by 3%; the overall change is small because the effects of decreased distance are offset by a compensating change in the scaling relation.
3 Results and Conclusions
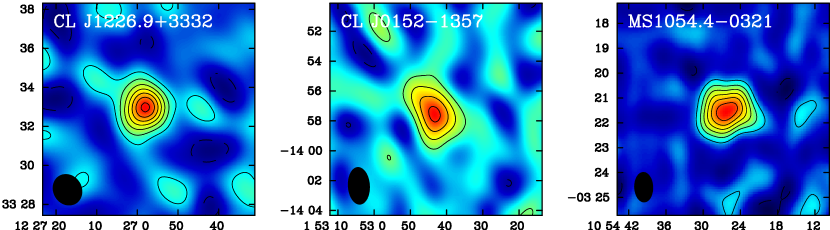
Synthesized images of the SZ Effect toward Cl J1226.9+3332, Cl J0152.71357, and MS 1054.40321 are shown in Fig. 1. The SZE decrement is detected with high significance in all of these distant clusters, and the locations of the SZE and X-ray centroids are consistent (Tables 1 and 3). Using the SZE data and the analysis techniques described in Section 2.2, we determine the temperature and mass of each cluster (Table 3). X-ray temperature measurements for Cl J0152.71357 (Della Ceca et al. 2000) and MS 1054.40321 (Donahue et al. 1998) are also shown in Table 3, and we find that these X-ray temperature measurements are consistent with the values inferred from the SZE data within the stated uncertainties.
From the SZE data, we infer a total mass of M⊙ within a radius of 65″ (340 kpc) for each of the clusters shown in Table 3. These mass calculations can be checked against values derived from gravitational lensing, X-ray, and optical observations of MS 1054.40321 (Donahue et al. 1998; van Dokkum et al. 2000; Hoekstra et al. 2000). Hoekstra et al. (2000) infer a total mass of M⊙within an aperture of radius 94″ . To compare the SZE and gravitational lensing results, we calculate the gas mass within a 94′′ radius aperture, for an electron temperature of 10.4 keV: M⊙, where the uncertainties reflect the statistical 68% confidence interval in modelling the SZE data. The total mass is estimated by scaling this value by the mean gas mass fraction (Section 2.2), from which we obtain an SZE estimate of the total mass within a 94″radius: M⊙. We find that the total mass estimated from the SZE data is consistent with the lensing measurements of Hoekstra et al. (2000).
Based on the SZE data we conclude that the newly-discovered clusters Cl J1226.9+3332 and Cl J0152.71357 are highly massive, with a total mass of M⊙ within a radius of 65″ (340 kpc). These values are comparable to the mass inferred from SZE imaging of the cluster MS 1054.40321, which has been confirmed by X-ray, optical, and gravitational lensing studies. These results demonstrate the ability to determine cluster temperatures and masses from SZE data without access to X-ray data, and illustrate the power of using deep SZE surveys to probe the distant universe. More precise measures of the temperature and mass of Cl J1226.9+3332 and Cl J0152.71357 will be possible with deep X-ray imaging and spectroscopy, which will be obtained within the coming year by the Chandra and XMM X-ray observatories; with these data in hand, the SZE measurements can be used to measure the distance to each cluster (Reese et al. 2000) and to further constrain their density, mass, and gas mass fraction (Grego et al. 2001). Additional, independent constraints on the mass distribution in Cl J1226.9+3332 will be obtained from a weak-lensing analysis of wide-field imaging data taken with HST and the Subaru 8.3m telescope.
References
- Bahcall & Cen (1992) Bahcall, N. A. & Cen, R. 1992, ApJ, 398, L81
- Bahcall & Fan (1998) Bahcall, N. A. & Fan, X. 1998, ApJ, 504, 1
- Birkinshaw (1999) Birkinshaw, M. 1999, Physics Reports, 310, 97
- Carlstrom et al. (1996) Carlstrom, J. E., Joy, M., & Grego, L. 1996, ApJ, 456, L75
- Cavaliere & Fusco-Femiano (1976) Cavaliere, A. & Fusco-Femiano, R. 1976, A&A, 49, 137
- Cavaliere & Fusco-Femiano (1981) —. 1981, A&A, 100, 194
- Della Ceca et al. (2000) Della Ceca, R., Scaramella, R., Gioia, I. M., Rosati, P., Fiore, F., & Squires, G. 2000, A&A, 353, 498
- Donahue et al. (1998) Donahue, M., Voit, G. M., Gioia, I., Lupino, G., Hughes, J. P., & Stocke, J. T. 1998, ApJ, 502, 550
- Ebeling et al. (2001) Ebeling, H., Jones, L. R., Fairley, B. W., Perlman, E., Scharf, C., & Horner, D. 2001, ApJ, in press
- Ebeling et al. (2000) Ebeling, H., Jones, L. R., Perlman, E., Scharf, C., Horner, D., Wegner, G., Malkan, M., Fairley, B. W., & Mullis, C. R. 2000, ApJ, 534, 133
- Eke et al. (1998) Eke, V. R., Cole, S., Frenk, C. S., & Patrick Henry, J. 1998, MNRAS, 298, 1145
- Evrard (1997) Evrard, A. E. 1997, MNRAS, 292, 289
- Evrard et al. (1996) Evrard, A. E., Metzler, C. A., & Navarro, J. F. 1996, ApJ, 469, 494
- Gioia & Luppino (1994) Gioia, I. M. & Luppino, G. A. 1994, ApJS, 94, 583
- Grego et al. (2001) Grego, L., Carlstrom, J., Reese, E., Holder, G., Holzapfel, W., Joy, M., Mohr, J., & Patel, S. 2001, ApJ, in press
- Grego et al. (2000) Grego, L., Carlstrom, J. E., Joy, M. K., Reese, E. D., Holder, G. P., Patel, S., Cooray, A. R., & Holzapfel, W. L. 2000, ApJ, 539, 39
- Haiman et al. (2000) Haiman, Z., Mohr, J. J., & Holder, G. P. 2000, ApJ, submitted
- Hoekstra et al. (2000) Hoekstra, H., Franx, M., & Kuijken, K. 2000, ApJ, 532, 88
- Luppino & Gioia (1995) Luppino, G. A. & Gioia, I. M. 1995, ApJ, 445, L77
- Neumann & Arnaud (2000) Neumann, D. M. & Arnaud, M. 2000, submitted
- Oukbir & Blanchard (1997) Oukbir, J. & Blanchard, A. 1997, A&A, 317, 1
- Pearson et al. (1994) Pearson, T. J., Shepherd, M. C., Taylor, G. B., & Myers, S. T. 1994, BAAS, 185, 0808
- Pospieszalski et al. (1995) Pospieszalski, M. W., Lakatosh, W. J., Nguyen, L. D., Lui, M., Liu, T., Le, M., Thompson, M. A., & Delaney, M. J. 1995, IEEE MTT-S Int. Microwave Symp., 1121
- Reese et al. (2000) Reese, E. D., Mohr, J. J., Carlstrom, J. E., Joy, M., Grego, L., Holder, G. P., Holzapfel, W. L., Hughes, J. P., Patel, S. K., & Donahue, M. 2000, ApJ, 533, 38
- Romer et al. (2000) Romer, A. K., Nichol, R. C., Holden, B. P., Ulmer, M. P., Pildis, R. A., Merrelli, A. J., Adami, C., Burke, D. J., Collins, C. A., Metevier, A. J., Kron, R. G., & Commons, K. 2000, ApJS, 126, 209
- Rudy (1987) Rudy, D. J. 1987, PhD thesis, California Inst. of Tech., Pasadena.
- Sault et al. (1995) Sault, R. J., Teuben, P. J., & Wright, M. C. H. 1995, ASP Conf. Ser. 77: Astronomical Data Analysis Software and Systems IV, 4, 433
- Scharf et al. (1997) Scharf, C. A., Jones, L. R., Ebeling, H., Perlman, E., Malkan, M., & Wegner, G. 1997, ApJ, 477, 79
- Scoville et al. (1993) Scoville, N. Z., Carlstrom, J. E., Chandler, C. J., Phillips, J. A., Scott, S. L., Tilanus, R. P. J., & Wang, Z. 1993, PASP, 105, 1482
- Sunyaev & Zel’dovich (1972) Sunyaev, R. A. & Zel’dovich, Y. B. 1972, Comments Astrophys. Space Phys., 4, 173
- van Dokkum et al. (2000) van Dokkum, P. G., Franx, M., Fabricant, D., Illingworth, G. D., & Kelson, D. D. 2000, ApJ, 541, 95
- Viana & Liddle (1996) Viana, P. T. P. & Liddle, A. R. 1996, MNRAS, 281, 323
| Cluster | Pointing Center (J2000) | On-source Integ. | ||
|---|---|---|---|---|
| Name | redshift | time (hours) | ||
| Cl J1226.9+3332 | 0.89 | 12h26m58s.0 | 33∘32′45 | 41.6 |
| Cl J0152.71357 | 0.83 | 01h52m43s.0 | –13∘57′29 | 27.8 |
| MS 1054.40321 | 0.83 | 10h56m59s.5 | –03∘37′28 | 43.0 |
| Cluster | Synth. Beam | Observed | RMS noise | ||
|---|---|---|---|---|---|
| Name | () | (arcsec) | (arcsec) | Flux (mJy)aaUncorrected for primary beam attenuation. | (mJy/beam) |
| Cl J1226.9+3332 | 14.1″16.1″ | 260.0 | 39.3 | 1.73 | 0.152 |
| Cl J0152.71357 | 13.7″23.1″ | – | – | – | 0.221 |
| MS 1054.40321 | 17.4″23.3″ | 0.1 | 1.4 | 0.98 | 0.092 |
| 161.0 | 1.9 | 0.63 | ” | ||
| 25.5 | 86.9 | 0.35 | ” |
| Cluster | Cluster PositionaaOffsets from radio pointing center (Table 1) | 65″] | |||
|---|---|---|---|---|---|
| Name | (keV) | (keV) | M⊙) | ||
| Cl J1226.9+3332 | 02 | 123 | – | ||
| Cl J0152.71357 | 18 | 92 | |||
| MS 1054.40321 | 78 | 53 | |||