Warm Molecular Gas in Dwarf Starburst Galaxies: CO(3-2) Observations
Abstract
Eight dwarf starburst galaxies have been observed with the Caltech Submillimeter Observatory (CSO) telescope in the CO J= 3 - 2 transition. The galaxies observed are He 2-10, NGC 5253, NGC 1569, NGC 3077, Haro 2, Haro 3, II Zw 40 and Mrk 86; all but the last two are detected. The central regions of He 2-10 and NGC 5253 were mapped and a CO(2-1) spectrum of NGC 5253 was obtained. The error weighted mean CO(3-2)/CO(1-0) ratio of the detected galaxies is 0.600.06, which is virtually identical to what is found for starbursts in the nuclei of nearby spirals, and suggests that the molecular gas is optically thick, warm (T20 K), and moderately dense (). The CO(3-2)/CO(1-0) ratio peaks at or close to the starburst in all cases. CO emission does not appear to be optically thin in these dwarfs, despite the low metallicity and intense radiation fields, which is probably because in order for CO to exist in detectable amounts it must be self-shielding and hence optically thick. Physical properties of the molecular clouds in these dwarf starbursts appear to be essentially the same as nearby spiral nuclei, with the possible exception that CO is more confined to the cloud cores.
1 Introduction
Dwarf galaxies differ in many characteristics from large star-forming spirals. Typically they are much smaller (3 kpc), have lower rotation velocities (30 km/s), generally warmer ISMs (TK), solid body rotation, and lack density waves, presenting less complicated star forming environments than spiral galaxies (eg. Hodge, 1971; Gallagher and Hunter, 1984; Thronson and Telesco, 1986). Also, dwarf galaxies are compositionally different, appearing to have relatively high HI and dark matter fractions (Thuan and Martin, 1981), relatively little dust, and lower metallicities. The molecular content in dwarf galaxies is particularly difficult to study, since CO(1-0) is usually quite weak due to the low metallicities, and therefore probably not a good tracer of H2 (Israel et al., 1986; Verter and Hodge, 1995; Wilson, 1995).
The relatively weak CO(1-0) emission in dwarf galaxies leads us to search for a stronger line with which to study molecular gas. The J=3-2 transition of CO may be more easily detected in dwarf starbursts since it is relatively easily excited in warm gas (E/k = 33.2 K). Due to its higher characteristic temperature and critical density (), the CO(3-2) transition may be more sensitive to warm, dense gas directly involved in the starburst. It also has a higher optical depth than the CO(1-0), which can make it easier to detect if CO(1-0) is optically thin.
A sample of nearby dwarf starbursts have been observed in the CO(3-2) transition with the Caltech Submillimeter Observatory (CSO). Among the questions addressed are: do molecular clouds in dwarf galaxies have different physical properties than their higher metallicity counterparts? Is the CO(1-0) line weak in dwarf galaxies because it is optically thin? Is the CO conversion factor in dwarf starbursts different from large spirals because of these physical conditions?
1.1 The Galaxy Sample
A sample of eight nearby (20 Mpc) dwarf starburst galaxies was observed. The galaxies are He 2-10, NGC 5253, NGC 1569, NGC 3077, Haro 2, Haro 3, II Zw 40 and Mrk 86. The sample is heterogeneous and illustrative, but not complete or unbiased. Galaxies were selected based on the following criteria: they have been previously observed and detected in either the CO(1-0) or CO(2-1) transition (Wiklind and Henkel, 1989; Becker, Schilke and Henkel, 1989; Sage et al., 1992; Baas, Israel and Koornneef, 1994; Greve et al., 1996), have IRAS 100m fluxes greater than 5 Jy (Thronson and Telesco, 1986; Melisse and Israel, 1994), are fainter than M and have undergone a recent burst of intense star-formation. All the galaxies except NGC 3077 and Mrk 86 have Wolf-Rayet (WR) emission features (eg. Conti, 1991; Steel et al., 1996; Gonzalez Delgado et al., 1997; Schaerer, Contini and Pindao, 1999). Some of these galaxies contain super star-clusters (SSCs) (He 2-10, NGC 5253, NGC 1569 and Haro 3)(Conti and Vacca, 1994; Meurer et al., 1995; Arp and Sandage, 1985; Steel et al., 1996). A number of these dwarfs show signs of interaction (He 2-10, NGC 5253, NGC 1569, NGC 3077 and II Zw 40). The properties of the galaxies in the sample are shown in Table Warm Molecular Gas in Dwarf Starburst Galaxies: CO(3-2) Observations.
2 Observations
We observed the 12CO(3-2) line (345.796 GHz) towards the galaxies He 2-10, NGC 5253 and II Zw 40, on 1997 February 24 & February 25, and the remaining five galaxies on 1999 January 14 & January 15 using the 10.4m Caltech Submillimeter Observatory (CSO). The beamsize of the CSO at 345 GHz is 22. Facility SIS receivers were used together with a 1024 channel 500 MHz AOS spectrometer. System temperatures ranged from 600 K - 1100 K for the 1997 data and 700 K - 900 K in 1999 ( 0.08 - 0.15). Pointing was checked using IRC+10216, Ori, (1997 observations) Saturn, and Mars (1999). Absolute pointing uncertainty was 6, and repeatable to . Reported temperatures are main beam temperatures, which is the brightness temperature a source would have if it uniformly filled the main beam and was zero elsewhere. The main beam efficiencies used to convert the antenna temperature to the main beam temperature were determined from observations of Mars and found to be = 0.6 (1997) and 0.62 (1999). Since no published CO(2-1) spectrum exists for NGC 5253, G. Serabyn kindly obtained one for us on 1997 May 28. At 230 GHz, the CSO beamsize is 30, and = 0.65 as determined from observations of Mars. System temperatures for this spectrum are 400 K. Second order or lower polynomials were removed from the each scan to give a flat baselines. The scans were then averaged, using 1/T weights. The spectra were Hanning smoothed to a resolution of 8.0 km s-1 (1997) and 6.6 km s-1 (1999). Reduction of the spectra were done in CLASS. For He 2-10, the maps were made and analyzed using the NRAO AIPS package.
2.1 The CO(3-2) Spectra
CO(3-2) spectra of the central positions of each of the galaxies are displayed in Figure 1. We detected CO(3-2) in all the galaxies except Mrk 86 and II Zw 40. Line intensities, uncertainties, and gaussian fits are tabulated in Table 2. For some of the spectra gaussians may not represent the true line profile but given the weakness of the signal, fitting anything more complicated is unwarranted. The details of each galaxy are discussed in §6.
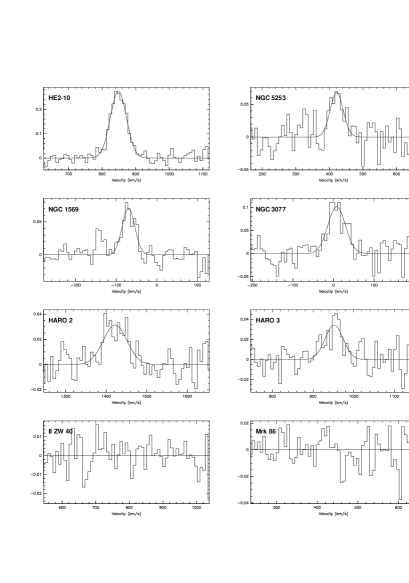
In general CO(3-2) is very weak (T 0.05 K) over our projected beamsizes of 0.25 - 2 kpc. This is not surprising; dwarf galaxies are known to be weak in the other low J CO lines (Young, Gallagher and Hunter, 1984; Israel, 1986; Tacconi and Young, 1987; Arnault et al., 1988; Sage et al., 1992). However, CO(3-2) is strong relative to CO(1-0) and CO(2-1). Only one of the six detected galaxies has CO(3-2)/CO(1-0) ratio as low as 0.4, which is typical of the Galactic disk. Comparing the CO(3-2)/CO(1-0) line ratio with the CO(2-1)/CO(1-0) line ratio, we find that galaxies with high 2-1/1-0 ratios tend to have high 3-2/1-0 ratios. There is one notable exception, II Zw 40. II Zw 40 has a high CO(2-1)/CO(1-0) ratio (Sage et al., 1992), but its CO(3-2)/CO(1-0) ratio is 0.43 (1).
3 Line Ratios: Physical Properties of the Molecular Gas
CO line ratios can be used to investigate molecular gas properties in these starbursts. CO(3-2)/CO(1-0) ratios are more sensitive to gas temperature than CO(2-1)/CO(1-0) ratios because of the larger separation in J. Thanks to the fortuitous matching of the CO(1-0) beam at the IRAM 30m (21) and the CO(3-2) beam at the CSO (22), CO(3-2)/CO(1-0) line ratios can be estimated without assumptions about source structure. Only the two southern galaxies, He 2-10 and NGC 5253, do not have IRAM CO(1-0) spectra. For these two galaxies, the source has been mapped at CO(3-2) or with an interferometer at CO(2-1) or both (Meier and Turner, 1998).
Along with the CO(3-2)/CO(1-0) line ratios, Table 3 includes CO(2-1)/CO(1-0) line ratios. The CO(2-1) observations do not have matching beams. Therefore Table 3 indicates what ratio would be predicted in the point-source limit (source much smaller than either beam) and in the uniform filling limit (source much larger than both beams). These line ratios are calculated using (eg. Rohlfs and Wilson, 1996, page 362):
where , and are the source solid angle and the solid angle of the beams at the respective transitions, and and are their observed line intensities. For sources which have been mapped a deconvolved ratio based on the measured is also included. In all cases, with the possible exception of the CO(2-1)/CO(1-0) in NGC 1569, the uniform filling ratios are unrealistically high, implying the sources are small. This is consistent with the low filling factor found for these galaxies (§3.1)
The CO(3-2)/CO(1-0) ratios in the dwarf starbursts range from 0.37 - 1.1. The error weighted mean CO(3-2)/CO(1-0) line ratio for the sample is 0.6 0.06. (We have estimated the uncertainty in the line ratio as the noise error in each spectrum added in quadrature with 20% absolute calibration uncertainties.) This error weighted ratio is identical, within the uncertainties, to what is found for a sample of non-dwarf starburst nuclei (0.64; Devereux et al., 1994) and for nearby luminous IR galaxies (0.7; Mauersberger et al., 1999). The value is higher than the value obtained for Galactic GMCs, 0.4, and closer to the value obtained for star-forming cores in the Galaxy (0.6; Sanders et al., 1993).
3.1 LTE Modeling: Optically Thick CO Emission
Comparing CO(3-2) to the other CO transitions (CO(3-2)/CO(1-0) line ratio is used unless otherwise stated) can, in principle, be used to constrain gas excitation temperatures and optical depths. The ratio of the CO(3-2) intensity to the CO(1-0) intensity, under the LTE assumption is:
where , with and being the optical depth and filling factor of each transition, respectively (eg. Hurt et al., 1993). To increase the signal-to-noise ratio (SNR), we have used the ratio of integrated intensities instead of the peak main-beam temperatures. This requires that the CO(3-2) and CO(1-0) line profiles be similar. For most of the galaxies this is a good approximation (§6). For the LTE approximation, ratios greater than unity indicate warm, optically thin gas, while ratios less than unity indicate optically thick molecular gas.
In practice, non-LTE effects such as different source sizes for the CO(3-2) and CO(1-0) transitions or different Tex for each transition due to temperature gradients and differential optical depth effects in externally heated clouds may affect the ratio. This dataset cannot address such details. A discussion of these details would require higher resolution or observations of rare CO isotopomers. The 13CO isotopomers, whose transistions will be less optically thick, can be helpful in better constraining the properties of these galaxies, but unfortunately these galaxies are too weak in 13CO to detect with current telescopes (except He 2-10).
Previous studies indicate that variations in Tex become important in localized regions of high column density, where optical depths of order unity are reached over very small physical distances (eg. Turner, Hurt and Hudson, 1993; Meier, Turner and Hurt, 2000). When averaged over large single-dish beams, the potential error associated with such effects appear to be minor. (For example, in the case of the nucleus of the nearby metal-rich starburst, IC 342, a comparison of the physical conditions derived using single-dish 12CO observations (Eckart et al., 1990) are similar to those obtained with higher resolution, even with the presence of strong local temperature gradients (Meier, Turner and Hurt, 2000). Similar results have been found from studies of Galactic star-forming regions (eg. Wilson, Howe and Balogh, 1999).
Nearly all of the galaxies we observe have ratios 1.0 which indicate optically thick emission. NGC 3077 (1.1) and the one velocity component of Haro 3 (1.3) have ratios that are larger than one, but only marginally so. In the case of NGC 1569 and NGC 3077, some portion of the high line ratios are due to a slightly larger linewidth of the CO(3-2) line relative to the CO(1-0) lines, indicating that there maybe some regions off line center that have CO(3-2)/CO(1-0) ratios greater than 1.0. But in both cases the SNR is too low to say with certainty. It appears that optically thick gas dominates the CO emission in these dwarf galaxies.
We estimate the gas excitation temperatures of the six detected galaxies, assuming the molecular gas is optically thick. Derived Tex range from 6 K (Haro 2) to 50 K (NGC 1569, NGC 3077, Haro 3). For the high ratio galaxies a specific excitation temperature cannot be obtained because the CO(3-2)/CO(1-0) ratio ceases to differentiate temperatures well for 30 K. As a result of beam dilution, TMB/Tex gives an estimate of the areal filling factor for each of the galaxies. Rather low filling factors are found, with values ranging from 0.02 to 0.001 (Table 4).
3.2 LVG Modeling: Molecular Cloud Densities


Additional constraints on the physical conditions of the molecular gas can be obtained using a Large Velocity Gradient (LVG) model (Goldreich and Kwan, 1974; De Jong, Chu and Dalgarno, 1975). Due to the relatively large Doppler shifts within the cloud, the emergent intensity can be related to its local sources of excitation, Tk and . As a result, LVG models can be used to get an indication of the gas kinetic temperature and density, given observations of several line ratios or antenna temperatures. While filling factors do not strongly effect the line ratios for our matched beam observations, they do sensitively effect the brightness temperatures. The molecular clouds in these galaxies are unresolved. Therefore, only line ratios provide useful constraints. Detailed LVG modeling is not possible with the two line ratios, CO(3-2)/CO(1-0) and CO(2-1)/CO(1-0), since there are three unknowns, the gas density, , the kinetic temperature, TK and /. As mentioned earlier, temperature gradients can also contribute; however, for a reasonable assumption of the abundance per velocity gradient it is possible to provide rough constraints on the physical parameters. Given our limited knowledge of the physical conditions in dwarf starbursts, even rough constraints are important.
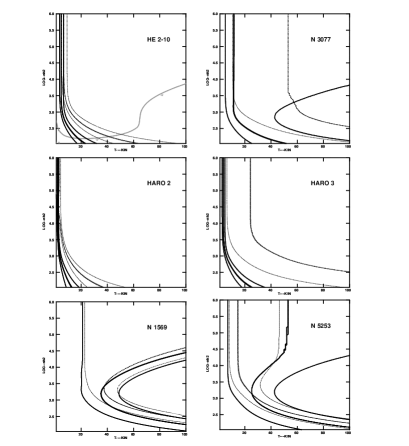
The LVG models were run for gas densities ranging from and kinetic temperatures T K, for a CO abundance per velocity gradient, /, ranging between and . Given that we only have two lines to constrain three variables, model solutions are displayed for only one choice of /. Figure 2 displays the best fit solutions for TK and with an / estimated in the following manner. The CO abundance is assumed to be the solar CO abundance scaled relative to the galaxies’ metallicity and a constant velocity gradient of 1 km s-1pc-1, which should roughly account for metallicity effects (Verter and Hodge, 1995; Wilson, 1995). The solutions obtained are relatively insensitive to / as long as it is within a factor of 4-5 times the displayed value. For different assumed values of /, the best fit solutions shift slightly towards higher (lower) densities, for lower (higher) values of /, due to the rise of the effective critical density caused by decreased radiative trapping.
Sage et al. (1992) argue that CO(2-1)/CO(1-0) line ratios obtained by approximating the source size as a point source are closer to reality because of the small CO source sizes expected for dwarf galaxies. The low derived CO(3-2) filling factors appear to confirm this. Therefore, the “point-source” ratio approximations are used for galaxies with no mapping information (Table 3). The details of the LVG solutions for each galaxy are addressed in §6, but the basic results can be understood in simple terms. In order to excite a bright CO(3-2) line the gas must either be warm or have a relatively high density. At high densities the lower J transitions of CO will be thermalized and the CO(2-1)/CO(1-0) and CO(3-2)/CO(1-0) values will just reflect the Rayleigh-Jeans temperature corrections. At low densities, CO(3-2) weakens faster than CO(2-1) because of its higher critical density. Therefore, galaxies with similar CO(2-1)/CO(1-0) and CO(3-2)/CO(1-0) values indicate thermalized, high density gas (the larger the ratios the higher the temperature), while in galaxies with CO(3-2)/CO(1-0) CO(2-1)/CO(1-0) lower density gas is indicated.
The galaxies with low to moderate CO(3-2)/CO(1-0) and CO(2-1)/CO(1-0) values (He 2-10, Haro 2 and Mrk 86) are best fit by molecular gas that is dense () and cold (T 5 - 10 K). The galaxies with high CO(3-2)/CO(1-0) and CO(2-1)/CO(1-0) values (NGC 1569, NGC 3077 and NGC 5253) have a large range of parameter space that fit the observed values. There is a warm, low density solution (T 40 K; ; NGC 5253) or a warm, high density solution (; NGC 1569, NGC 3077). For the remaining galaxies, Haro 3 and II Zw 40, no constraints can be made (see §6 for details). “Point-source” ratios preferentially bias the ratios downward, ie. towards cooler temperatures or lower densities, so these derived values reflect lower limits to the density and temperature if the true source sizes are larger than .
Table 4 summarizes the excitation conditions for the eight galaxies. The derived temperatures and densities of the molecular clouds in these dwarf starburst galaxies are different from those found in the Galactic disk and non-starburst dwarf galaxies, but similar to those found in other, higher metallicity, starburst nuclei (eg. Young and Scoville, 1991; Braine and Combes, 1992; Wild et al., 1992; Devereux et al., 1994; Aalto et al., 1995; Petitpas and Wilson, 1998). Sage et al. (1992) come to a similar conclusion based on CO(2-1).
Despite the low metallicity, strong radiation fields and weak CO, CO appears not to have become optically thin in the low J transitions of dwarf starbursts. A likely explanation for this is that if the CO column density is high enough to shield itself against photodissociation and hence maintain a detectable amount of CO (NCO ; Lequeux et al., 1994), then that column density is high enough for the low J transitions of CO to be optically thick (Pak et al., 1998). Over the region of the starburst where CO can survive, CO might be expected to be optically thick and resemble the physical conditions of higher metallicity starbursts, with the difference between the two environments (the weakness of CO in the low metallicity systems) reflecting, predominately, increased beam dilution due to smaller “CO cloud size” (eg. Maloney and Black, 1988; Lequeux et al., 1994; Maloney and Wolfire, 1997).
The large optical depths, the relatively high densities derived from LVG modeling plus the small molecular cloud filling factor estimates indicate that the CO cloud size may be smaller in these dwarf starbursts than in spiral starbursts. A similar effect is observed for the LMC and SMC (Israel et al., 1986; Rubio, Lequeux and Boulanger, 1993; Mochizuki et al., 1994). However, since none of the molecular clouds are resolved here, we cannot say whether this is due to photodissociated CO or is just a reflection of the gas “traced by CO(3-2)” with its larger critical density.
3.3 Distribution of Warm, Dense Molecular Gas in Dwarf Starbursts
Since bright CO(3-2) emission requires warmer temperatures and higher densities than CO(1-0), it is expected that CO(3-2)/CO(1-0) would peak on regions of active star formation. There has been some evidence for this in nearby spirals (Garcia-Burillo, Guelin and Cernicharo, 1993; Wilson, Walker and Thornley, 1997, eg.), as well as some of the nearby, less active dwarfs (Petitpas and Wilson, 1998; Mauersberger et al., 1999).
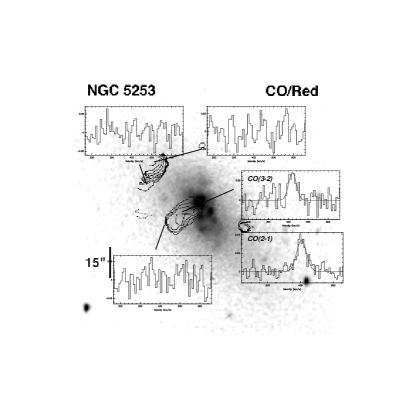
For the two galaxies in the sample with spatial information, He 2-10 and NGC 5253, we investigate the spatial variation in the CO(3-2)/CO(1-0) ratio. In these two galaxies, CO(3-2)/CO(1-0) peaks toward the starburst (Table 5). In the case of the fully mapped galaxy, He 2-10, the CO(3-2) emission is more strongly peaked towards the starburst than is CO(1-0), and the tidal features seen in CO(1-0) (peak C) are less pronounced or “missing” all together . Baas, Israel and Koornneef (1994) also find indications that the CO(1-0) source size is slightly larger than the CO(3-2). Likewise for NGC 5253, the CO(2-1)/CO(1-0) value obtained from interferometric data indicates that the ratios along the dust lane peak closest to, although not at the starburst (Meier and Turner, 1998). The CO(3-2) observations demonstrate a similar trend. While the three offset positions are not deep enough to detect CO(3-2), the limits show that CO(3-2) is weaker relative to CO(1-0) further from the starburst.
To further test the result that CO(3-2) is stronger in the central starburst regions of the sample, we compared the observed line ratios with the physical size covered on the galaxy. The findings are plotted in Figure 5. Note that the beamsizes of He 2-10 and NGC 5253 for the measured line ratios are larger than 22 and reflect the CO(1-0) beam size of 40 and 44, respectively. There is a weak trend (correlation coefficient of r = -0.83) that the line ratio decreases as the distance of the starburst galaxy increases, which implies that including gas in the beam from farther out in the galaxy lowers the ratio. (Haro 3 appears to be somewhat of an exception, but the line ratio of this galaxy appears “contaminated” by an optically thin velocity component [§6].) This is consistent with the notion that the highest temperatures and densities are concentrated towards the starburst, with lower temperature and density gas over the rest of the galaxy. We conclude that this is a general feature among dwarf starbursts, and the properties derived using the higher J transitions of CO probably better represent the region directly associated with the star formation.
4 Masses, Column Densities and Conversion Factors
Estimating molecular gas masses in dwarf galaxies can be a particularly tricky business. Dwarf galaxies seem to have a higher standard conversion factor (, where ) than do large metal-rich spirals (Israel, 1986; Maloney and Black, 1988; Eckart et al., 1990; Verter and Hodge, 1995; Wilson, 1995; Arimoto, Sofue and Tsujimoto, 1996). Several methods are used to obtain molecular mass estimates. One is to assume that the molecular clouds are in virial equilibrium, and that the linewidth is representative of the cloud mass. However, with the large beamsizes of single-dish observations, galaxy rotation contributes significantly to the linewidth. In fact, it is more likely that the mass measured in this fashion represents an estimate of the dynamical mass over the beam. A second method for estimating molecular mass is to assume CO is optically thin and “count molecules”, using (including He; eg. Rohlfs and Wilson, 1996, page 191):
where the value is scaled relative to the Galactic [CO/H2] abundance ratio of (Frerking, Langer and Wilson, 1982). This method underestimates the total molecular mass, both because the CO emission is optically thick (§3.1), and the CO abundances, [CO/H2], are probably lower than the Galactic value for most of the dwarf galaxies. Thirdly, molecular masses can be estimated using a metallicity scaled conversion factor. We use (Wilson et al., 1988; Petitpas and Wilson, 1998):
where = (Strong et al., 1988), is the CO(3-2) flux in Jy km s-1 (where a conversion factor of 47.3 Jy/K is assumed), and R is the CO(3-2)/CO(1-0) line ratio. The scaling for the conversion factor is quite uncertain due to the few data points, but we estimate it based on the relationship derived from single-dish data (Arimoto, Sofue and Tsujimoto, 1996).
Collected in Table 6 are the masses derived for each galaxy by the three different methods. We also compare the derived masses with the dust mass estimated from the 100 IRAS fluxes (Thronson and Telesco, 1986; Melisse and Israel, 1994). The virial theorem gives a much larger mass than any of the other methods, consistent with it tracing dynamical mass. It should give a firm upper limit to the molecular mass present. The mass estimates obtained by assuming the CO(3-2) emission is optically thin are more than 100 times lower than what is estimated from the conversion factor method. The Mthin estimate gives a firm lower limit to the amount of molecular gas. The conversion factor method is intermediate between the other two. Therefore, even with its large uncertainty, the best estimate is probably still the conversion factor based estimate. Since none of the molecular clouds are resolved spatially or in velocity, a detailed investigation of the must await higher resolution. The CO(3-2) data does, however, appear consistent with the ICO vs. metallicity relationship found from CO(1-0) for dwarf and spiral galaxies (Figure 3 Verter and Hodge, 1995; Wilson, 1995; Arimoto, Sofue and Tsujimoto, 1996).
5 CO and Dust: Preferential CO Depletion?
A correlation between CO and IR luminosity for large starbursts has been known for some time (see the Young and Scoville, 1991, review and there references therein). In Figure 4, the infrared luminosity of this sample plus the Mauersberger et al. (1999) sample of non-dwarf nuclei are plotted versus their CO(3-2) luminosity. The CO(3-2) data for the dwarf starbursts also show a tight correlation between LCO32 and LIR, with a relation of:
(correlation coefficient of r=-0.94). This can be compared to the correlation we calculate using the Mauersberger et al. (1999) dataset:
In dwarf starbursts, CO emission appears weaker relative to the infrared emission than in the high metallicity galaxies. The slope of this relationship is substantially steeper than what is found from nearby, high metallicity, starburst spirals. The most metal-rich galaxies in this sample follow the relationship found for non-dwarfs, but the lower metallicity sources are weaker in LCO32 relative to dust than would be extrapolated from non-dwarfs. While the sample of dwarf galaxies is too small to prove this fact conclusively, it indicates that there may be a break in the slope of LCO32 vs. LIR at the faint, low metallicity end. Taylor, Kobulnicky and Skillman (1998) also suggest a rapid fall off in LCO at metallicities of about 1/10 Z⊙ based on a different line of reasoning. Further observations are key to investigating the validity of this trend.
The weakening of LCO relative to LIR is not necessarily unexpected because of the strong radiation field and low metallicity of these dwarf starbursts. These simultaneously lead to higher dust temperatures and hence LIR and to increased CO photodissociation. Dust survives longer than CO in strong radiation fields, so CO should disappear faster than dust.


6 Notes on the Individual Galaxies
He 2-10: In Figure 6, the channel maps of He 2-10 are presented. A 14-point map of He 2-10 was made on a 10 grid in RA and Dec. around the brighter optical starburst component (Vacca and Conti, 1992). The () = 0,0 position of He 2-10 was reobserved on February 25 to confirm its line strength. Pointings were extended towards the southeastern portion of the galaxy where a bar-like tidal feature is seen in the CO(1-0) interferometer map (Kobulnicky et al., 1995). We detect emission in every position except (20,0). The peak Tmb occurs at the central position and has a value of 0.27 K. This value is about 80% of the value Baas, Israel and Koornneef (1994) find for CO(3-2) after we convolve to the same beamsize. The CO(3-2) emission at this position has a V 57 km s-1 centered at 849 km s-1, with detectable emission spanning a velocity range of 810 - 890 km s-1 (LSR).
We do not detect any obvious emission to a level of 40 mK associated with the kinematically distinct feature labeled by Kobulnicky et al. (1995) with the letter “C”. There is some hint of a southeastern extension seen at 853 km s-1 and 861 km s-1, but this is separated by better than two channels (16 km s-1) from their velocity and is not likely to be the same source. On the other hand, we do detect emission that matches both in position and velocity space with the weak detached feature seen in the Kobulnicky et al. (1995) interferometric CO(1-0) map. Kobulnicky et al. (1995) interpret this detached feature questionably as noise, but since we see indications of emission in CO(3-2) at the same location and velocities, this feature may be real. This feature is weak, with a T 0.08 K, and centered at and .
Figure 7 shows the integrated CO(3-2) intensity map of the nuclear region of He 2-10. The emission from the central peak is more dominant than in CO(1-0). Within pointing uncertainties, the peak of the integrated intensity coincides with the position of the brighter optical starburst component. Of the three extensions seen, one extends to the northeast along a p.a. , while the other two extend to the southeast. We interpret the two extensions to the SE as one feature along a p.a. of 130o and attribute the apparent split into two features to the lack of a pointing at (20,-20). This extension matches what is observed in the interferometric CO(1-0) and CO(2-1) maps and is near the site of an offset star cluster (Kobulnicky et al., 1995; Beck and Kovo, 1998; Meier and Turner, 1998).
The centrally peaked component has a FWHM of 26. When deconvolved from the beam, we estimate that the source size is 13 (560110 pc at 9 Mpc). Since the observations of Baas, Israel and Koornneef (1994) are at a different resolution than ours, we can compare the observed main-beam temperatures to get a second estimate of the source size. Again, 13 is obtained. Because both methods agree, and are consistent with the size estimated from the high resolution interferometer CO(2-1) map (Meier and Turner, 1998), we conclude that this is a good representation of the CO(3-2) source size.
Assuming a source size of 13 for He 2-10, we obtain CO(3-2)/CO(2-1), CO(3-2)/CO(1-0), and CO(2-1)/CO(1-0) line ratios of 1.00.2, 0.610.1 and 0.590.1 respectively. These are slightly lower than the previous results of Baas, Israel and Koornneef (1994). CO(3-2)/CO(2-1) 1.0 combined with a high 12CO/13CO isotopic ratio led them to conclude that the CO emission is optically thin. With the advantage of a fully sampled map and CO(3-2) observations with beam matched to their J=2-1 observations, these observations do not necessarily require optically thin gas. LVG modeling yields a best fit solution of and T 5 - 10 K, however the on the solution is high. These gas temperatures are slightly cooler than the 20 K estimated from LTE modeling. The 12CO(1-0)/13CO(1-0) line ratio was also modeled. A model with [12CO/13CO] = 40 and and a 13CO depleted model with [12CO/13CO] = 120 were run (Figure 2). Both CO abundance models are inconsistent with the solution found from the 12CO transitions. The 13CO line in He 2-10 is too weak (12CO(1-0)/13CO(1-0) 22) relative to what is predicted from the 12CO lines, as Baas, Israel and Koornneef (1994) noted. In order to have 12CO(1-0)/13CO(1-0) 22, the 12CO lines must be optically thin, unless the abundance is severely depleted. However nowhere over the CO(3-2) solution space is the modeled 12CO optically thin. Therefore, given the high on the 12CO solution and that the 13CO observations are not consistent with the simple LVG modeling, the solution should be considered uncertain. 13CO is probably preferentially photodissociated or that source sizes are much smaller in 13CO than 12CO. As far as the high isotopic ratios obtained are concerned (Baas, Israel and Koornneef, 1994; Kobulnicky et al., 1995), the optically thinner 13CO lines are less capable of self-shielding than 12CO, and are likely to be preferentially photo-dissociated by the intense radiation fields. So the abundance and spatial extent of 13CO may be greatly diminished with respect to 12CO (eg. van Dishoeck and Black, 1988; Lequeux et al., 1994; Warin, Benayoun and Viala, 1996).
NGC 5253: The four pointings for NGC 5253 were chosen based on the CO(1-0) interferometric map made at Owens Valley Millimeter Observatory (OVRO) (Turner, Beck and Hurt, 1997). We observed two pointings associated with the central dust lane, and two toward a possible molecular cloud at the edge of the OVRO primary beam. In Figure 8, the four CO(3-2) and one CO(2-1) spectra are overlaid on the OVRO CO(1-0) map (Figure 2 of Turner, Beck and Hurt, 1997). The measured CO(3-2) intensity is about 5 - 6 , and both the velocity centroid (V km s-1) and the line width ( km s-1) match published single-dish CO(1-0) detections (Wiklind and Henkel, 1989; Taylor, Kobulnicky and Skillman, 1998). For the three other spectra there are no detections to 3. LVG modeling yields densities of , and T 40 K, with the best fit solutions obtained for the lower densities.
NGC 1569: We detect CO(3-2) in this galaxy with ICO=2.2 K km s-1 (TMB = 63 mK) towards the HII region C (Waller, 1991). This corresponds to the central position observed by Greve et al. (1996) in CO(1-0) and CO(2-1). The line width of CO(3-2) is slightly larger (32.3 km s-1) than that of the CO(1-0) observations (23.6 km s-1). The line center is shifted to slightly higher velocities than the CO(1-0) (-69 relative to -81 km s-1 for CO(1-0)). The CO(2-1) line center is intermediate between the two, 78.4 km s-1. Therefore, while the velocity centroids are roughly consistent, there is a marginal trend that the emission from the higher J transitions tend towards increasing velocity. Comparing these higher velocities with the velocity field obtained from HI (Reakes, 1980; Stil and Israel, 1998) indicates that CO(3-2) peaks slightly closer to the super-star cluster, A, than does CO(1-0), and is probably associated with GMC 2 of Taylor et al. (1999).
Interestingly, there is a secondary peak seen at -140 km s-1. This peak is at the 4 level, and the line profile is similar to the main peak. HI is also present at this velocity, giving more evidence this feature may be real. We have inspected the CO(1-0) and CO(2-1) spectra of Young, Gallagher and Hunter (1984), Taylor, Kobulnicky and Skillman (1998) and Greve et al. (1996) for similar features. Unfortunately, the spectra of Greve et al. (1996) does not extend that far in velocity, and while the Young, Gallagher and Hunter (1984) spectrum shows indications of a feature at this velocity, it does not seem to be confirmed by the more sensitive observations of Taylor, Kobulnicky and Skillman (1998). Therefore, until further observations can be obtained, we assume it is not real. Since both the CO(3-2)/CO(1-0) and the CO(2-1)/CO(1-0) line ratios are , a large region of parameter space is acceptable to the LVG models. The best fits represent an arch running from T 100 K and down to T 40 K and and back over to T 100 K and .
NGC 3077: Observations were centered on the location of the interferometer CO(2-1) peak (Meier and Turner, 1998). This is equivalent to the (-10,0) position of Becker, Schilke and Henkel (1989). The CO(3-2) line width of 51 km -1 is slightly wider than observed by Becker, Schilke and Henkel (1989) in CO(1-0) (34 km s-1), while the centroid is consistent with what is observed in the lower transitions. Based on the CO(2-1)/CO(1-0) line ratio discussed in Becker, Schilke and Henkel (1989), we estimate a CO(3-2)/CO(1-0) line ratio of 1.1. Becker, Schilke and Henkel (1989) obtain a CO(2-1)/CO(1-0) line ratio of 0.82. For NGC 3077, the best fit LVG solution corresponds to T 30 K and , with an acceptable range of solutions covering T K and .
Haro 2: We observed CO(3-2) at the same position as CO(1-0) and CO(2-1) of Sage et al. (1992). The fitted line width is 69 km s-1, but the line appears distinctly non-gaussian. The SNR of the spectrum is to low to warrant any multi-component fit, but the spectrum is consistent with two roughly equal intensity gaussians separated by about 40 km s-1. For Haro 2, the best fit solution obtained from LVG modeling is and T 5 K, but the are high, similar to what is found for He2-10. However, the low ratios obtained for both transition require that Tk be low and be high.
Haro 3 (NGC 3353): CO(3-2) observations are centered on the starburst region B (Steel et al., 1996). The fitted gaussian yields a line width of 53 km s-1 which is slightly narrower than CO(1-0) ( = 64 km s-1; Sage et al., 1992). The CO(3-2) spectrum shows a narrow brighter component at 960 km s-1 ( = 950 km s-1). The same peak is seen in both the CO(1-0) and CO(2-1) spectra of Sage et al. (1992), and matches the velocity of H at the starburst region, B1, of Steel et al. (1996). Therefore, we conclude this feature is real. Inspecting the spectra of Sage et al. (1992) a main-beam temperature ratio of 1.3 is estimated for this component. The large CO(3-2)/CO(1-0) line ratio is inconsistent with any region of parameter space indicated by the CO(2-1)/CO(1-0) line ratio, so no LVG solutions is found. This component is potentially optically thin and may be causing an overestimate of the global CO(3-2)/CO(1-0) ratio in Haro 3.
II Zw 40: The beam was centered on the star-formation peak and is within an arcsecond of the observed CO(2-1) and CO(1-0) position of Sage et al. (1992). The line is not detected. Our limit for the CO(3-2) main-beam temperature is 7 mK. There appears to be no hint of a line at the level in either of the previously published CO(1-0) velocity centroids, 770 km s-1 (Sage et al., 1992) or 850 km s-1 (Tacconi and Young, 1987). LVG modeling does not provide a useful constraint on the gas properties because CO(3-2) is not detected. The low CO(3-2)/CO(1-0) ratio implies that the molecular gas must not be very warm and dense.
Mrk 86 (NGC 2537): We do not detect any CO(3-2) emission to a limit of 11 mK. Sage et al. (1992) detected weak CO(1-0) and CO(2-1) at a VLSR of 460 km s-1. There is a hint of a very weak line at VLSR = 428 km s-1, but only at 1.5. The low CO(3-2)/CO(1-0) ratio limit and the low CO(2-1)/CO(1-0) ratio imply LVG fits quite similar to those of Haro 2.
7 Conclusions
We have observed CO(3-2) in a sample of eight dwarf galaxies with very intense recent star formation. The galaxies range in metallicity from 1 Z⊙ to 0.1 Z⊙. CO(3-2) was detected in six of the eight galaxies. The galaxies are all quite weak (T mK), with the exception of He 2-10, which was mapped. The two galaxies not detected (II Zw 40 and Mrk 86) are two of the lowest metallicity galaxies.
The CO(3-2)/CO(1-0) line ratio ranges from 0.37 - 1.1 for the six detected galaxies. With the possible exception of one velocity component in Haro 3, all the galaxies appear dominated by optically thick CO emission, even though they have low metallicity and strong radiation fields. This is consistent with the fact that the only place that CO can survive intense radiation fields is where it is self-shielded, and thus optically thick.
The error weighted mean CO(3-2)/CO(1-0) line ratio is 0.600.06. This is virtually identical to what is seen in high metallicity starbursts. While CO(3-2) is very weak on an absolute scale, it is as bright relative to CO(1-0) as in high metallicity starbursts. In general, in terms of the physical properties of the molecular gas, dwarf starbursts appear not to be particularly unusual examples of the starburst family. They appear to be similar to their high metallicity counterparts, with the exception that CO has a smaller filling factor and hence weaker intensities.
LVG models from the CO line ratios imply that for He 2-10, Haro 2 and Mrk 86, the molecular gas traced by CO is cool (T10 K) and dense ( ). For NGC 5253, the molecular gas appears warm (T K) and moderately dense (). The molecular gas in NGC 1569 and NGC 3077 are also warm but somewhat more dense ().
For the two galaxies that have been observed with multiple pointings, He 2-10 and NGC 5253, we find that the CO(3-2)/CO(1-0) line ratio decreases away from the starburst. The entire sample shows a trend where the ratio is lower for the galaxies where the beam includes more “non-starburst” gas (ie. covers larger fractions of the galaxy). This is interpreted as due to a drop in gas temperature and density away from the starburst.
The combination of low filling factors derived from the CO(3-2) emission, the fact that CO(3-2) systematically remains optically thick in spite of low metallicities and strong radiation fields, and a trend found between LCO and LIR implies the lower metallicity galaxies are more strongly depleted in CO relative to dust than higher metallicity galaxies.
References
- Aalto et al. (1995) Aalto, S., Booth, R. S., Black, J. H. & Johansson, L. E. B. 1995, A&A, 300, 369
- Arimoto, Sofue and Tsujimoto (1996) Arimoto, N., Sofue, Y. & Tsujimoto, T. 1996, PASJ, 48, 275
- Arnault et al. (1988) Arnault, P., Casoli, F., Combes, F., & Kunth, D. 1988, A&A, 205, 41
- Arp and Sandage (1985) Arp, H. & Sandage, A. 1985, AJ, 90, 1163
- Baas, Israel and Koornneef (1994) Baas, F., Israel, F. P. & Koornneef, J. 1994, A&A, 284, 403
- Beck and Kovo (1998) Beck, S. C. & Kovo, O. 1998, AJ, 117, 190
- Becker, Schilke and Henkel (1989) Becker, R., Schilke, P. & Henkel, C. 1989, A&A, L211, 19
- Braine and Combes (1992) Braine, J. & Combes, F. 1992, A&A, 264, 433
- Conti (1991) Conti, P. S. 1991, ApJ, 377, 115
- Conti and Vacca (1994) Conti, P. S. & Vacca, W. D. 1994, ApJ, 473, L97
- Cottrell (1976) Cottrell, G. A. 1976, MNRAS, 174, 455
- De Jong, Chu and Dalgarno (1975) De Jong, T., Chu, S.-I. & Dalgarno, A. 1975, ApJ, 199, 69
- Devereux et al. (1994) Devereux, N., Yoshiaki, T., Sanders, D. B., Nakai, N. & Young, J. S. 1994, AJ, 107, 2006
- Eckart et al. (1990) Eckart, A., Downes, D., Genzel, R., Harris, A. I., Jaffe, D. T.,& Wild, W. 1990, ApJ, 348, 434
- Elmegreen (1989) Elmegreen, B. G. 1989, ApJ, 338, 178
- Frerking, Langer and Wilson (1982) Frerking, M. A., Langer, W. D. & Wilson, R. W. 1982, ApJ, 262, 59
- Gallagher and Hunter (1984) Gallagher, J. S. & Hunter, D. A. 1984, ARA&A, 22, 37
- Garcia-Burillo, Guelin and Cernicharo (1993) Garcia-Burillo, S., Guelin, M. & Cernicharo, J. 1993, A&A, 274, 123
- Garnett (1990) Garnett, D. R. 1990, ApJ, 363, 142
- Goldreich and Kwan (1974) Goldreich, P. & Kwan, J. 1974, ApJ, 189, 441
- Gonzalez Delgado et al. (1997) Gonzalez Delgado, R. M., Leitherer, C., Heckman, T. & Cervino, M. 1997, ApJ, 483, 705
- Greve et al. (1996) Greve, A., Becker, R., Johansson, L. E. B. & McKeith, C. D. 1996, A&A, 312, 391
- Heckman (1980) Heckman, T. M. 1980, A&A, 87, 142
- Hodge (1971) Hodge, P. W. 1971, ARA&A, 9, 35
- Hurt et al. (1993) Hurt, R. L., Turner, J. L., Ho, P. T. P. & Martin, R. N. 1993, ApJ, 404, 602
- Israel (1986) Israel, F. P. 1986, A&A, 168, 369
- Israel (1988) Israel, F. P. 1988, A&A, 194, 24
- Israel and de Bruyn (1988) Israel, F. P., de Bruyn, A. G. 1988, A&A, 198, 109
- Israel et al. (1986) Israel, F. P., De Gwaauw, Th., Van de Stadt, H. & De Vries, C. P. 1986, ApJ, 303, 186
- Israel and van Driel (1990) Israel, F. P., & van Driel, W. 1990, A&A, 236, 323
- Klein, Weiland and Brinks (1991) Klein, U., Weiland, H., & Brinks, E. 1991, A&A, 246, 323
- Kobulnicky et al. (1995) Kobulnicky, H. A., Dickey, J. M., Sargent, A. I., Hogg, D. E. & Conti, P. S. 1995, AJ, 110, 116
- Kobuknicky and Johnson (1999) Kobulnicky, & H. A., Johnson, K. 1999, ApJ, 527, 154
- Kobuknicky, Kennicutt and Pizagno (1998) Kobulnicky, H. A., Kennicutt, R. C., & Pizagno, J. L. 1998, ApJ, 514, 544
- Kobulnicky and Skillman (1995) Kobulnicky, H. A., & Skillman, E. D. 1995, ApJ, L454, 121
- Kobulnicky and Skillman (1997) Kobulnicky, H. A., & Skillman, E. D. 1997, ApJ, 489, 636
- Kunth and Jobert (1985) Kunth, D., & Jobert, M. 1985, A&A, 142, 411
- Lequeux et al. (1994) Lequeux, J., Le Bourlot, J., Pineau Des Forets, G., Roueff, E., Boulanger, F. & Rubio, M. 1994, A&A, 292, 371
- MacLaren, Richardson and Wolfendale (1988) MacLaren, I., Richardson, K. M. & Wolfendale, A. W. 1988, ApJ, 333, 821
- Maloney and Black (1988) Maloney, P. & Black, J. H. 1988, ApJ, 325, 389
- Maloney and Wolfire (1997) Maloney, P., & Wolfire, M. G. 1997, in IAU Symp 170: CO: Twenty-Five Years of Millimeter-Wave Spectroscopy, ed. W. B. Latter et al. (Dordrecht:Kluwer), 299
- Marconi, Matteucci and Tosi (1994) Marconi, G., Matteucci, F., & Tosi, M. 1994, MNRAS, 270, 35
- Mauersberger et al. (1999) Mauersberger, R., Henkel, C., Walsh, W. & Schulz, A. 1999, A&A, 341, 256
- Meier and Turner (1998) Meier, D. S., & Turner, J. L. 1998,in: K.A. van der Hucht, G. Koenigsberger & P.R.J. Eenens (eds.), Wolf-Rayet Phenomena in Massive Stars and Starburst Galaxies, Proc. IAU Symp. No. 193 (San Francisco: ASP), 746
- Meier and Turner (2000) Meier, D. S. & Turner, J. L. 2000, in prep.
- Meier, Turner and Hurt (2000) Meier, D. S., Turner, J. L., & Hurt, R. L. 2000, ApJ, 531, 200.
- Melisse and Israel (1994) Melisse, J. P. M. & Israel, F. P. 1994, A&AS, 103, 391
- Meurer et al. (1995) Meurer, G. R., Heckman, T. M., Leitherer, C., Kinney, A., Robert, C. & Garnett, D. R. 1995, AJ, 110, 2665
- Mochizuki et al. (1994) Mochizuki, K., et al. 1994, ApJ, 430, L37
- Niklas et al. (1995) Niklas, S., Klein, U., Braine, J., & Wielebinski, R. 1995, A&AS, 114, 21
- Pak et al. (1998) Pak, S., Jaffee, D. T., van Dishoeck, E. F., Johansson, L. E. B., & Booth, R. S. 1998, ApJ, 498, 735
- Petitpas and Wilson (1998) Petitpas, G. R. & Wilson, C. D. 1998, ApJ, 496, 226
- Reakes (1980) Reakes, M. 1980, MNRAS, 192, 297
- Rohlfs and Wilson (1996) Rohlfs, K. & Wilson, T. L. 1996, Tools of Radio Astronomy, 2nd Ed., (Springer-Verlag:Berlin)
- Rubio, Lequeux and Boulanger (1993) Rubio, M., Lequeux, J. & Boulanger, F. 1993, A&A, 271, 9
- Sage et al. (1992) Sage, L. J., Salzer, J. J., Loose, H.-H. & Henkel, C. 1992, A&A, 265, 19
- Sandage (1994) Sandage, A. 1994, ApJ, L423, 13
- Sanders et al. (1993) Sanders, D. B., Tilanus, R. P. J., Scoville, N. Z., Wang, Z., & Zhou, S. 1993, in Back to the Galaxy, ed. F. Verter (Kluwer, Dordrecht), 21
- Schaerer, Contini and Pindao (1999) Schaerer, D., Contini, T. & Pindao, M 1999, A&AS, 136, 35
- Skillman, Kennicutt and Hodge (1989) Skillman, E. D., Kennicutt, R. C. & Hodge, P. W. 1989, ApJ, 347, 875
- Steel et al. (1996) Steel, S. J., Smith, N., Metcalfe, L., Rabbette, M. & McBreen, B. 1996, A&A, 311, 721
- Stil and Israel (1998) Stil, J. M. & Israel, F. P. 1998, A&A, 337, 64
- Strong et al. (1988) Strong et al. 1988, A&A, 207, 1
- Tacconi and Young (1987) Tacconi, L. J. & Young, J. S. 1987, ApJ, 322, 681
- Tammann and Sandage (1968) Tammann, G., A., & Sandage, A. 1968, ApJ, 151, 825
- Taylor et al. (1999) Taylor, C. L., Hüttemeister, S., Klein, U., & Greve, A. 1999, A&A, 349, 424
- Taylor, Kobulnicky and Skillman (1998) Taylor, C. L., Kobulnicky, H. A. & Skillman, E. D. 1998, AJ, 116, 2746
- Thronson and Telesco (1986) Thronson, H. A. & Telesco, C. M. 1986, ApJ, 311, 98
- Thuan and Martin (1981) Thuan, T. X. & Martin, G. E. 1981, ApJ, 247, 823
- Turner, Beck and Hurt (1997) Turner, J. L., Beck, S. C. & Hurt R. L. 1997, ApJ, L474, 11
- Turner, Ho and Beck (1998) Turner, J. L., Ho, P. T. P., & Beck, S. C. 1998, AJ, 116, 1212
- Turner, Hurt and Hudson (1993) Turner, J. L., Hurt R. L., & Hudson, D. Y. 1993, ApJ, L413, 19
- Vacca and Conti (1992) Vacca, W. D. & Conti, P. S. 1992, ApJ, 401, 543
- van Dishoeck and Black (1988) van Dishoeck, E. F., & Black, J. H. 1988, ApJ, 334, 771
- Verter and Hodge (1995) Verter, F. & Hodge, P. 1995, ApJ, 446, 616
- Waller (1991) Waller, W. H. 1991, ApJ, 370, 144
- Warin, Benayoun and Viala (1996) Warin, S., Benayoun, J. J., & Viala, Y. P. 1996, A&A, 308, 535
- Wiklind and Henkel (1989) Wiklind, T. & Henkel, C. 1989, A&A, 225, 1
- Wild et al. (1992) Wild, W., Harris, A. I., Eckart, A., Genzel, R., Graf, U. U., Jackson, J. M., Russell, A. P. G. & Stutzki, J. 1992, A&A, 265, 447
- Wilson (1995) Wilson, C. D. 1995, ApJ, L448, 97
- Wilson, Howe and Balogh (1999) Wilson, C. D., Howe, J. E, & Balogh, M. L. 1999, ApJ, 517, 174
- Wilson et al. (1988) Wilson, C. D., Scoville, N. Z., Freedman, W. L., Madore, B. F., & Sanders, D. B. 1988, ApJ, 333, 611
- Wilson, Walker and Thornley (1997) Wilson, C. D., Walker, C. E. & Thornley, M. D. 1997, ApJ, 483, 210
- Wolfire et al. (1990) Wolfire, M. G., Tielens, A. G. G. M. & Hollenbach, D. J. 1990, ApJ, 358, 116
- Young, Gallagher and Hunter (1984) Young, J. S., Gallagher, J. S. & Hunter, D. A. 1984, ApJ, 276, 476
- Young and Scoville (1991) Young, J. S. & Scoville, N. Z. 1991, ARA&A, 29, 581
| Galaxy | RA | Dist. | IRAS 60/100m | log(LFIR) | log(MHI) | References |
|---|---|---|---|---|---|---|
| DEC | (Mpc) | (Jy) | (L⊙) | (M⊙) | ||
| -MB | TDaausing R(60/100)=0.6-4(e-1)/ (e-1), (Thronson & Telesco 1986) | MDbbusing MD=5D2FJy(e-1), (Thronson & Telesco 1986) | [O/H] | |||
| (B1950) | (K) | (M⊙) | ||||
| He 2-10 | 08:34:07.3 | 9.0 | 24.0/26.4 | 9.43 | 8.53 | 1,9,10,11 |
| -26:14:05.9 | 17.4 | 43 | 5.47 | 8.93 | ||
| NGC 5253 | 13:37:05.8 | 4.1 | 30.9/29.0 | 8.98 | 8.3 | 12,15,19,22,23 |
| -31:23:19.0 | 17.2 | 46 | 4.73 | 8.10 | ||
| NGC 1569 | 04:26:02.0 | 2.2 | 46.3/50.7 | 8.65 | 7.93 | 5,6,7,13,22 |
| 64:44:31.0 | 16.9 | 43 | 4.52 | 8.19 | ||
| NGC 3077 | 09:59:20.0 | 3.25 | 14.7/26.9 | 8.70 | 9.00 | 2,4,16,17,21 |
| 68:58:30.0 | 16.1 | 34 | 4.99 | 9.02 | ||
| Haro 2 | 10:29:22.7 | 20.3 | 4.7/5.3 | 9.60 | 8.68 | 1,14,18,22 |
| 54:39:24.0 | 18.4 | 42 | 5.51 | 8.4 | ||
| Haro 3 | 10:42:16.5 | 13.7 | 5.1/6.4 | 9.30 | 8.79 | 8,18,20,22 |
| 56:13:23.0 | 17.5 | 41 | 5.16 | 8.4 | ||
| II Zw 40 | 05:53:04.9 | 9.2 | 6.5/5.7 | 9.04 | 8.3 | 3,8,18,22 |
| 03:23:06.0 | 16.2 | 48 | 4.66 | 8.15 | ||
| Mrk 86 | 08:09:42.8 | 6.3 | 3.2/6.3 | 8.45 | 8.28 | 8,18,22 |
| 46:08:33.0 | 16.6 | 33 | 5.00 | 8.05ccExtrapolated from the absolute magnitude based on the relationship of Skillman, Kennicutt & Hodge 1989 |
References. — (1)Baas et al. 1994; (2)Cottrell 1976; (3)Garnett1990; (4)Heckman 1980; (5)Israel 1988; (6)Israel & de Bruyn 1988; (7)Israel & van Driel 1990; (8)Klein et al. 1991; (9)Kobulnicky et al. 1995; (10)Kobulnicky & Johnston 1999; (11)Kobulnicky et al. 1998; (12)Kobulnicky & Skillman 1995; (13)Kobulnicky & Skillman 1997; (14) Kunth & Jobert 1985; (15)Marconi et al. 1994; (16)Melisse & Israel 1994; (17)Niklas et al. 1995; (18)Sage et al. 1992; (19)Sandage 1994; (20)Steele et al. 1996; (21)Tammann & Sandage 1968; (22)Thronson & Telesco 1986; (23)Turner et al. 1998
| Galaxy | Transition | Offset | VLSR | V | Tmb | Ico |
|---|---|---|---|---|---|---|
| (, ) | (km s-1) | (km s-1) | K | K km s-1 | ||
| He 2-10 | 3-2 | (0,0) | 8491.0 | 56.62.3 | 0.270.018 | 16.60.6 |
| (0,-10) | 8461.6 | 63.83.7 | 0.200.018 | 13.30.7 | ||
| (-10,0) | 8541.5 | 58.83.6 | 0.190.02 | 11.90.6 | ||
| (0,10) | 850 | 63.44.8 | 0.150.022 | 10.30.7 | ||
| (10,0) | 846 | 50.03.4 | 0.240.022 | 12.60.7 | ||
| (10,10) | 8493.0 | 61.7 | 0.120.016 | 7.770.8 | ||
| (10,-10) | 8331.8 | 37.2 | 0.190.023 | 7.470.7 | ||
| (10,-20) | 87214.4 | 14025 | 0.0470.024 | 7.001.4 | ||
| (20,10) | 8263.3 | 22.57.1 | 0.0900.022 | 2.160.6 | ||
| (0,-20) | 8455.6 | 33.04.4 | 0.0720.030 | 2.530.8 | ||
| (-10,-10) | 8512.3 | 59.76.5 | 0.1420.020 | 9.060.8 | ||
| (20,0) | 0.053 | |||||
| (-10,10) | 8553.0 | 73.77.7 | 0.0940.019 | 7.40.6 | ||
| (20,-10) | 8253.9 | 26.710.8 | 0.1030.022 | 2.910.7 | ||
| NGC 5253 | 3-2 | (0,0) | 4214.2 | 45.48.7 | 0.0700.021 | 3.390.6 |
| (10,-10) | 0.073 | |||||
| (20,20) | 0.069 | |||||
| (15,25) | 0.075 | |||||
| 2-1 | (0,0) | 4072.9 | 71.69.0 | 0.0340.006 | 2.580.3 | |
| NGC 1569 | 3-2 | (0,0) | -68.42.0 | 32.34.0 | 0.0630.01 | 2.20.3 |
| NGC 3077 | 3-2 | (0,0) | 7.802.9 | 50.97.0 | 0.100.02 | 5.50.6 |
| Haro 2 | 3-2 | (0,0) | 14224.6 | 68.89.8 | 0.0320.01 | 2.30.3 |
| Haro 3 | 3-2 | (0,0) | 9514.6 | 52.614 | 0.0340.01 | 1.90.4 |
| II Zw 40 | 3-2 | (0,0) | 0.021 | 0.9 | ||
| Mrk 86 | 3-2 | (0,0) | 0.033 | 1.8 |
Note. — Offsets are in arcseconds from the central position listed in Table 1. Errors are 1 from a gaussian fit, based only on the uncertainty in the spectrum. The noise in the gaussian fit for Haro 2 is worse than the actual noise is the spectrum, implying it is not gaussian shaped (see text). For non-detections 3 limits are quoted. The uncertainties in absolute calibration were not included.
| Galaxy | Method | 3-2/1-0 | 3-2/2-1 | 2-1/1-0 |
|---|---|---|---|---|
| He 2-10 | point source (PS) | 0.500.1 | 0.870.2 | 0.480.07 |
| (0,0) | uniform filling (U) | 1.70.3 | 0.960.2 | 1.730.3 |
| deconvolved (D) | ∗0.610.1 | 0.960.2 | ∗0.590.1 | |
| NGC 5253 | PS | 0.650.2 | 0.700.2 | 0.930.2 |
| (0,0) | U | 2.60.7 | 1.30.4 | 2.00.4 |
| D | ∗0.700.2 | 0.730.2 | ∗0.960.25 | |
| NGC 1569 | PS | ∗1.000.2 | 2.50.6 | 0.420.1 |
| U | 1.100.2 | 0.880.2 | 1.100.2 | |
| D | ∗1.100.2 | |||
| NGC 3077 | PS | ∗0.950.2 | 2.10.7 | 0.550.1 |
| U | 1.040.25 | 0.830.2 | 1.20.3 | |
| D | ∗0.820.2 | |||
| Haro 2 | PS | ∗0.340.1 | 1.10.2 | ∗0.310.10 |
| U | 0.370.1 | 0.960.2 | 1.00.1 | |
| Haro 3 | PS | ∗0.890.3 | 1.70.5 | ∗0.500.09 |
| U | 0.970.3 | 0.570.2 | 1.70.3 | |
| II Zw 40 | PS | 0.39 | 0.580.16 | |
| U | 0.43 | 0.24 | 1.780.32 | |
| Mrk 86 | PS | 0.41 | 0.310.11 | |
| U | 0.45 | 0.52 | 1.00.36 |
Note. — See the text for the description of the method for finding each ratio and the estimation of the errors. The slight difference between the IRAM 30m (1-0) beam and the CSO (3-2) beam has been accounted for in the calculations of the ratios. An asterisk denotes which value of the line ratio is used in the LVG modeling. All line ratios are based on a 22 beamsize except He 2-10 and NGC 5253, which are based on a 40 beamsize. The data for the 2-1 & 1-0 emission comes from: He 2-10: Baas et al. 1994; NGC 5253; Wiklind & Henkel 1989 and this paper; NGC 1569: Greve et al. 1996; NGC 3077: Becker et al. 1989; the rest: Sage et al. 1992.
| He 2-10 | NGC5253 | NGC1569 | NGC3077 | Haro2 | Haro3 | IIZw40 | Mrk86 | |
|---|---|---|---|---|---|---|---|---|
| LTE: | ||||||||
| Td | 43 | 46 | 43 | 34 | 42 | 41 | 48 | 33 |
| Tex | 11 | 15 | 50 | 50 | 6 | 50 | 7 | 7 |
| fa | 0.02 | 0.005 | 0.001 | 0.002 | 0.005 | 0.001 | 0.004 | 0.005 |
| aaUsing the “OB association” relationship, LIR of Wolfire, Tielens & Hollenbach 1990, with R = 100 pc which is typical of galactic nuclei. This may be an underestimate of and thus of , since these dwarfs are dust poor and are potentially more “porous” to radiation than metal rich galaxies (Petitpas & Wilson 1998). | ||||||||
| LVG: | ||||||||
| Tk | 10bbThe of this solution are high, also the 13CO observations are inconsistent with these values (Figure 2a; §6), so this solution should be considered uncertain. | 30 | 40 | 20 | 5 | 5 | ||
| n | bbThe of this solution are high, also the 13CO observations are inconsistent with these values (Figure 2a; §6), so this solution should be considered uncertain. | |||||||
| 5.6bbThe of this solution are high, also the 13CO observations are inconsistent with these values (Figure 2a; §6), so this solution should be considered uncertain. | 1.0 | 1.5 | 1.5 | 20 | 20 | |||
| n | bbThe of this solution are high, also the 13CO observations are inconsistent with these values (Figure 2a; §6), so this solution should be considered uncertain. |
| Galaxy | Location | CO(3-2)/CO(1-0) |
|---|---|---|
| He 2-10 | (20,-10) | |
| (D) | (20,10) | |
| (C) | (10,-10) | |
| NGC 5253 | (10,-10) | |
| (20,20) | ||
| (15,25) |
Note. — Ratios are based on the CO(1-0) interferometer maps at 22 resolution, and have been corrected for resolved out flux (He 2-10: 82%; Kobulnicky et al. 1995; NGC 5253: 50%; Turner et al. 1997). Uncertainties for the CO(3-2) data are given in Table 3, while the interferometric data is assumed to have an uncertainty of 20%. In the case of NGC 5253 the ratio is of peak Tmb since these three CO(3-2) pointings are non-detections: quoted values are 3 upper limits.
| Galaxy | Tex | aaUsing the single-dish vs. metallicity relation of Arimoto et al. 1996: | bbUsing: Mvir = 210 , (MacLaren, Richardson & Wolfendale 1988) | Mmol | ccMgas = Mmol + MHI, (see Table 1) | |||
|---|---|---|---|---|---|---|---|---|
| (K) | (106 M⊙) | (106 M⊙) | (106 M⊙) | |||||
| He 2-10 | 11 | 1.0 | 330 | 1.0 | 140 | 0.42 | 475 | 1.4 |
| NGC 5253 | 15 | 7.0 | 94 | 0.004 | 37 | 0.39 | 680 | 2.5 |
| NGC 1569 | 50 | 5.7 | 26 | 0.007 | 4.6 | 0.18 | 140 | 3.1 |
| NGC 3077 | 50 | 0.9 | 93 | 0.04 | 4.4 | 0.05 | 45 | 8.6 |
| Haro 2 | 6 | 3.5 | 1100 | 2.1 | 750 | 0.68 | 2300 | 1.1 |
| Haro 3 | 50 | 3.5 | 430 | 0.25 | 110 | 0.26 | 790 | 1.7 |
| II Zw 40 | 6.1 | 830 | ||||||
| Mrk 86 | 7.7 | 340 |