H. Schild, hschild@astro.phys.ethz.ch
High resolution spectroscopy of symbiotic stars ††thanks: Based on observations obtained at the European Southern Observatory, La Silla, Chile; the observations were granted for the ESO programs 47.7-081, 48.7-083, 49.7-041, 50.7-129, 51.7-093, 52.7-068, 53.7-083, 54.E-061, 55.E-446, 56.E-526
Abstract
We present new dynamical parameters of the AR Pav binary system. Our observations consist of a series of high resolution optical/NIR spectra from which we derive the radial velocity curve of the red giant as well as its rotation velocity. Assuming co-rotation, we determine the stellar radius (130 ) of the red giant. Based on this we derive the red giant’s luminosity and mass (2.0 ) as well as the distance of the system (4.9 kpc). The binary mass function finally yields the companion’s mass (0.75 ) and the binary separation (1.95 AU). We find that the red giant does not fill its Roche lobe. We review the radial velocity data of Thackeray and Hutchings (1974), and compare it with our red giant’s orbit. We find that their RV curves of the blue absorption system and the permitted emission lines are in anti-phase with the red giant, and that the forbidden emission lines are shifted by a quarter of a period. The blue absorptions and the permitted emission lines are associated with the hot companion but not in a straightforward way. The blue absorption system only tracks the hot component’s orbital motion whilst it is in front of the red giant, whereas at other phases line blanketing by interbinary material leads to perturbations. We finally present UV light curves based on IUE archive spectra. We clearly detect eclipses in the continuum at all wavelengths. The eclipse light curves are unusual in that they show a slow and gradual decline prior to eclipse which is followed by a sharp increase after eclipse.
keywords:
binaries: eclipsing — binaries: symbiotic — stars: fundamental parameters — stars: individual: AR Pav — Accretion, accretion disks1 Introduction
AR Pavonis was the first symbiotic star to be recognized as a binary system. Mayall (1937) discovered it as an eclipsing P Cygni type star with a period of 605 days. She pointed out, how remarkable it was to observe an eclipsing star with such a long period. She also warned that its variability was unusual for a P Cygni star. Indeed, the association with P Cygni was only due to the presence of Balmer lines in emission with strong absorption edges toward the violet. As MWC 600 it entered Merrill and Burwell’s (1943) catalogue of Be and Ae stars as type Beq. Although Sahade (1949) extended the list of observed absorption and emission lines, it was Thackeray (1959) who made a first attempt at modelling, breaking away from the idea of a peculiar P Cygni variable. Finally, Thackeray & Hutchings (1974) claimed AR Pav for the symbiotic family. Based on their extended set of spectroscopic observations, covering several eclipses, they proposed a binary model. The strength of the TiO bands suggested an M3 III as secondary. In their opinion the eclipse was not just due to the extinction of stellar radiation, but to the “eclipse of a region whose excitation and density increases towards a central source of light”. They distinguish different radial velocity behaviours in permitted emission, forbidden emission, and absorption lines. Permitted emission lines, e.g. HeII , give the clearest eclipse pattern. They associate it with nebular emission centered on what to them is the hot primary, and they derive a nearly circular orbit and a mass function of =0.14. Based on considerations about the eclipse length and the probable mass of the secondary, they estimate a mass ratio of 2 and suggest a hot ( K) star with a mass of , or more precisely , .
The same mass function was adopted by Skopal et al. (2000) when they analysed the 1889-1998 light curve to arrive at , . Thackeray & Hutchings (1974) do find less clear velocity patterns in the forbidden emission or the absorption lines in the blue continuum. They associate them with gas streams (see Fig. 5 in Thackeray & Hutchings), and do not derive a velocity curve for the cool giant. In this paper we question the assumption of Thackeray & Hutchings (1974) that the allowed emission lines accurately trace the orbit of the hot star.
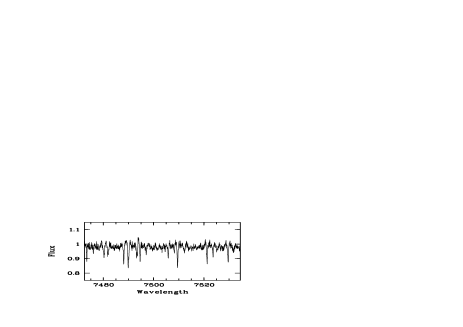
We have observed a set of absorption lines from the red giant (Fig. 1) over 3.5 binary periods. From this we derive an orbital solution, including a revised mass function. Our observations also permit us to extract the rotation velocity of the red giant, and with the assumption of corotation we derive the absolute radius of the red giant, its luminosity, and the distance to AR Pav.
The analysis of Thackeray & Hutchings (1974) as well as our analysis are based on the assumption that the occurence of an eclipse implies an approximate coincidence of the line of sight with the binary orbital plane of AR Pav. However, this has been contested by Hutchings et al. (1983). They claim that IUE (International Ultraviolet Explorer) observations prove that the hot star is not eclipsed. We re-anaylize the IUE data and establish that eclipses are clearly present.
Our orbital analysis of the red giant spectrum follows the same pattern as was already applied to the symbiotic systems SY Mus (Schmutz et al. 1994, Paper I), RW Hya (Schild et al. 1996, Paper II), CD–43.14304 (Schmid et al. 1998, Paper III), BX Mon (Dumm et al. 1998, Paper IV), and FG Ser (Mürset et al. 2000, Paper V).
| Date | JD | RV | O–C | ||||
|---|---|---|---|---|---|---|---|
| d | m | yr | [Å] | [km/s] | |||
| 12 | 9 | 91 | 48511.6 | 7005 | 0.62 | –0.7 | |
| 24 | 10 | 48553.8 | 6565 | 0.69 | –0.2 | ||
| 15 | 5 | 92 | 48757.7 | 6565 | 0.02 | –1.3 | |
| 24 | 5 | 93 | 49131.9 | 6565 | 0.64 | –2.0 | |
| 29 | 10 | 49289.5 | 6565 | 0.90 | –0.8 | ||
| 31 | 10 | 49291.5 | 6825 | 0.91 | 0.1 | ||
| 1 | 11 | 49292.5 | 5880 | 0.91 | –1.4 | ||
| 17 | 7 | 94 | 49550.6 | 6565 | 0.34 | –1.3 | |
| 12 | 8 | 49576.6 | 7505 | 0.38 | 1.1 | ||
| 13 | 8 | 49577.7 | 8170 | 0.38 | –0.9 | ||
| 1 | 11 | 49657.6 | 7005 | 0.51 | –1.2 | ||
| 24 | 5 | 95 | 49861.8 | 6565 | 0.85 | –1.2 | |
| 29 | 5 | 49866.8 | 7453 | 0.86 | 1.2 | ||
| 16 | 11 | 50037.5 | 7005 | 0.14 | –0.8 | ||
| 17 | 11 | 50038.5 | 6825 | 0.14 | 0.2 | ||
| 31 | 3 | 96 | 50173.9 | 6565 | 0.37 | 3.0 | |
| 2 | 7 | 50266.7 | 5007 | 0.52 | –0.4 | ||
| 22 | 7 | 50286.6 | 5007 | 0.55 | –0.1 | ||
| 7 | 8 | 50302.7 | 5007 | 0.58 | 2.0 | ||
| 7 | 8 | 50302.8 | 4363 | 0.58 | –0.6 | ||
| 8 | 8 | 50303.7 | 7005 | 0.58 | –0.5 | ||
| 20 | 7 | 97 | 50649.8 | 5007 | 0.15 | 2.7 | |
2 Observations
During an observational campaign dedicated to symbiotic stars we collected high resolution spectroscopic data of AR Pav over a period of six years. The observations were carried out with the 1.4 m Coudé Auxiliary Telescope (CAT) at ESO’s La Silla Observatory in Chile. The telescope fed a Coudé Echelle spectrograph which was set to provide a spectral resolution of 60 000 – 100 000. The spectral coverage was approximately 60 Å. The data were recorded with CCD detectors that changed as time went by (ESO#9, ESO#30, ESO#34, ESO#38). Most observations were carried out remotely from the ESO headquarters at Garching near Munich. A log of our observations is given in Table 1. We observed at different wavelengths. The red/NIR settings at 6825 Å, 7005 Å, 7505 Å, and 8170 Å were devised to record the red giant absorption spectrum, whereas the optical settings at 4363 Å, 5007 Å, and 6565 Å were meant to record nebular emission line profiles. In all settings the absorption spectrum of the M giant was clearly present and could be used to get radial velocity data. The nebular emission lines are much broader than the M star absorption features, and were removed with a low-pass filter before cross-correlation.
The observations were reduced in a standard way with the Midas software package. Particular attention was paid to the wavelength calibration, because this crucially influences radial velocity measurements. As an example of the resulting data we show in Fig. 1 the normalised spectrum obtained in the night of August 12, 1994.
We also observed the radial velocity standards BS 4763, BS 6973 and BS 8795 with the same instrumentation. Their radial velocities were taken from the Astronomical Almanac for BS 4763, and from Beaver & Eitter (1986), Barnes et al. (1986) and Beavers et al (1979) for the other standard stars. Cross-correlating the spectra of AR Pav with standard stars usually yielded robust correlation peaks with a FWHM of approximately 0.2 Å. Fitting a Gaussian profile to these peaks allowed the center to be determined to an accuracy of about 0.02 Å. This transforms to a radial velocity accuracy of 1 km/sec. In cases where the correlation peak is much broader or weaker than normal, we adopted a larger error of 1.5 km/s. Occasionally we obtained more than one spectrum per night. Combining them yielded RV values with smaller errors (Table 1).
3 The cool giant
3.1 Orbit
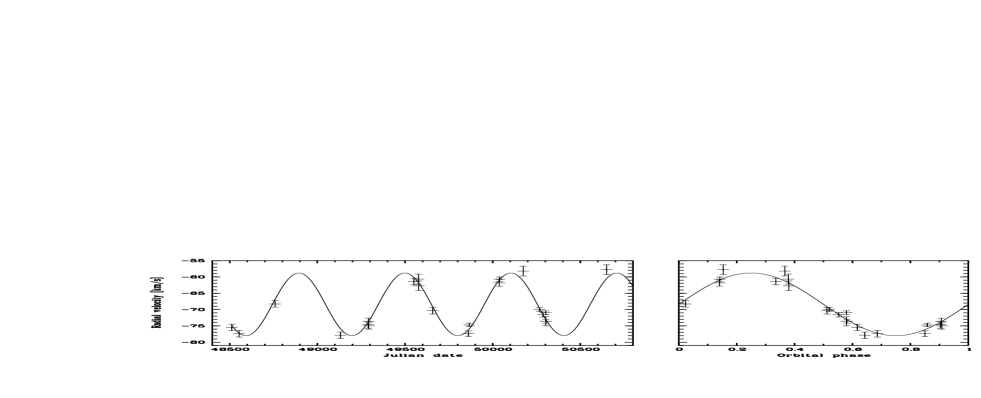
The period of AR Pav of 604.5 d is well established by photometry dating back to the year 1889 (Mayall 1937). A time series analysis of our radial velocity data yields a period of 605 days. We adopt the more precise photometric value of Bruch et al. (1994), and force our orbital solution to a period of 604.5 d. A least squares fit with the remaining orbital parameters left free, leads to a best solution with a slight eccentricity of . The (O-C) residuals for a circular orbit are, however, not significantly larger and, given the fact that a circular orbit requires two fitting parameters less, it provides an even better description of the data. A circular orbit is also in agreement with the tidal theory of Zahn (1977) which predicts a circularisation time of less than 50 000 y. Our adopted orbital solution is plotted in Fig. 2, and the corresponding orbital parameters are listed in Tab. 2. The residuals O–C of the fit are given in Tab. 1.
The fact that the best orbit is close to circular is very satisfactory not only because it is expected theoretically, but also because it demonstrates that our RV measurements are not affected by a phase dependent mass outflow. Such an outflow may well be present in the AR Pav system (see Sect. 5.2), but apparently it is not capable of modifying the spectrum of the red giant because its effect would be to mimic an eccentric orbit. We also note that the cross correlation technique is insensitive to small spectral changes as e.g. irradiation from the companion might produce.
With our new orbit the ephemeris for the lower conjunction of the red giant ( = 0) is
| (1) |
This conjunction phase closely matches the photometric minima (see e.g. Skopal et al. 2000) which proves that the red giant is the eclipsing body.
From the orbital parameters of the cool giant we compute the mass function
| (2) |
is the orbital period, the velocity semi-amplitude, the eccentricity, and the gravitational constant. This mass function is linked via
| (3) |
to and , the masses of the hot and the cool components, respectively. As the system is eclipsing, the orbit inclination is certainly high. From the UV eclipses we estimate that (see Sect. 6).
| \ts\ts | orbital solution |
|---|---|
| \ts\ts [d] | |
| \ts\ts [JD] | 48139 |
| \ts\ts [km\tss-1] | 9.6 |
| \ts\ts [km\tss-1] | –68.4 |
| \ts\ts | |
| \ts\ts [ ] | 0.055 |
3.2 Radius
As outlined in previous papers of this series, it is possible to measure the rotation velocity of the red giant by a line profile fitting procedure (see Paper I). In the case of AR Pav we find a rotation velocity
Since AR Pav is an eclipsing binary system, the projected rotation velocity is close to the real rotation velocity. The error due to the inclination uncertainty is at most a few percent and negligible compared to the measurement error in . We now further assume that the system is co-rotating. In this case the absolute radius immediately follows from
| (4) |
The assumption of co-rotation is theoretically well supported. According to the tidal theory of Zahn (1977), the synchronization time scale for a binary system like AR Pav is very short, and of the order of 104 y.
We note that our measured radius of the red giant is close to the median radius of 120 of giants of spectral type M5 (Dumm & Schild 1998).
3.3 Luminosity, mass and distance
According to Mürset & Schmid (1999) the red giant in AR Pav is of spectral type M5. This corresponds to an effective temperature = 3470 K (Dyck et al. 1996) which, together with our stellar radius from above, yields a luminosity of 2200 1100 . We note that this luminosity does not depend on the distance because it is based on the stellar radius from the measured rotation velocity (assuming co-rotation). The relatively large luminosity error is almost entirely due to the uncertainty in the red giant radius . Plotting the red giant stellar parameters in a HR diagram together with RGB/AGB evolutionary tracks from Bressan et al. (1993) yields for the red giant’s mass = 2.0 0.5 . Due to the fact that the evolutionary tracks are very steep, the large error in the red giants’ luminosity translates into an acceptable uncertainty in the stellar mass.
The known radius of the red giant opens the way for a distance determination. From the surface brightness relation for M-giants given in Schild et al. (1999) we derive a distance
| (5) |
by inserting the mean observed IR magnitudes from Glass & Webster (1973). The error in the distance (Tab. 3) is again dominated by the uncertainty of the red giant radius . The above distance is in good agreement with previous estimates which range from 3.8 kpc to 5.8 kpc (Thackeray & Hutchings 1974, Kenyon & Webbink 1984, Skopal et al. 2000).
| Parameter | Adopted | Uncertainty |
|---|---|---|
| System parameters: | ||
| \ts\tsDistance [kpc] | 4.9 | 1.2 |
| \ts\tsPeriod [d] | 604.5∗ | |
| \ts\tsEccentricity | 0 | |
| \ts\tsSeparation [AU] | 1.95 | 0.15 |
| \ts\tsMass function [ ] | 0.055 | 0.007 |
| \ts\tsTotal mass [ ] | 2.75 | 0.65 |
| \ts\tsMass ratio | 2.7 | 0.4 |
| Cool component: | ||
| \ts\tsMass [ ] | 2.0 | 0.5 |
| \ts\tsRadius [ ] | 130 | 25 |
| \ts\tsLuminosity [ ] | 2200 | 1100 |
| Hot component: | ||
| \ts\tsMass [ ] | 0.75 | 0.15 |
| ∗ adopted |
4 The hot component and the binary geometry
4.1 Mass of the hot component
The mass function of Tab. 2 together with the red giant’s mass from Sect. 3.3 yield a mass of the hot component of = 0.75 . This is slightly higher than the canonical mass of a single white dwarf, but still close to that value. Thus, also in the AR Pav symbiotic system the companion of the red giant is most probably a white dwarf. However, it is noteworthy that the hot companion in AR Pav is more massive than in any other previously studied symbiotic system. On average the hot companions in symbiotic systems tend to have masses lower than the canonical WD mass, at around 0.50 (e.g. Mürset et al. 2000).
4.2 Binary configuration
With both stellar masses known, we can now completely establish the binary configuration. Kepler’s third law yields a binary separation of 1.95 AU. The distance between the center of the red giant and the inner Lagrange point is 1.2 AU. The red giant extends to approximately 50% of the Roche radius. Among the symbiotics with well established orbits, AR Pav comes closest to filling its Roche lobe. Although mass transfer via Roche lobe overflow is unlikely, it is expected that the hot companion accretes a fraction of the red giant wind. We will come back to the consequences of wind accretion in Sec. 7.
For a point–like hot component the eclipse duration in the case of central passage would last 60 d. This is in reasonable agreement with the observed mean eclipse duration of 82 d by Bruch et al. (1994).
5 Earlier radial velocity curves
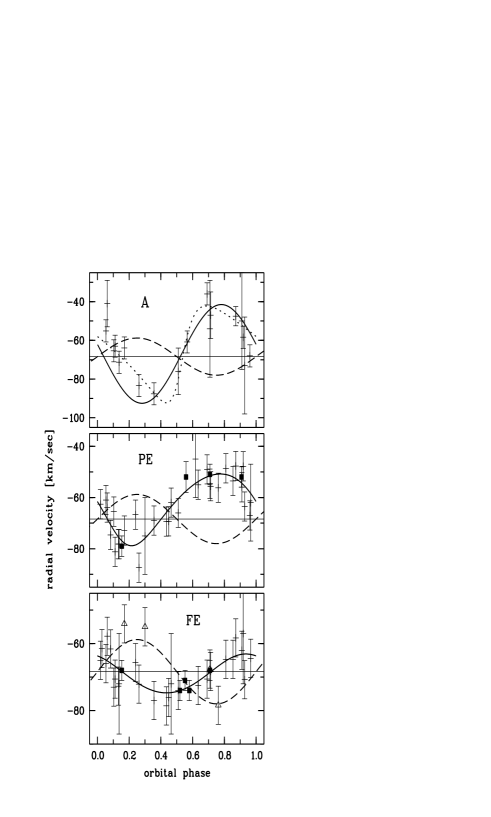
We now compare our radial velocity curve of the red giant with earlier RV measurements of Thackeray & Hutchings (1974), who collected high resolution spectroscopic data between 1953 and 1973. Their data set consists of the radial velocities of permitted and forbidden emission lines (PE and FE), and of a system of absorption lines in the blue continuum (A). The spectra were recorded on photographic plates and covered the blue spectral range.
5.1 Absorption lines
AR Pav went into an outburst in 1954. Thackeray & Hutchings (1974) noted that the absorption system then became unusually strong. Subsequently the features weakened but remained visible throughout the observation cycle. The spectra covered the blue spectral range where the red giant was extremely weak and the outbursting companion very bright. It was already clear to Thackeray & Hutchings (1974) that this blue absorption system was linked to the hot companion. Comparison with our red giant radial velocity curve shows indeed that it is in anti-phase with the red giant (Fig. 3, top).
A similar pattern of two absorption systems in anti–phase was previously seen during outbursts of the symbiotic systems AX Per and BX Mon (Mikolajewska & Kenyon 1992, Dumm et al. 1998). One absorption system, visible in the blue was typical of an A or F star and the other system, in the red, resembled an M type absorption spectrum. The blue system was believed to be associated with the hot component and the red system with the M giant. In such a situation the mass ratio of the binary components can be directly measured. With the inclination known, also the individual masses can be inferred.
In the case of AR Pav, however, complications occur because the orbital solution for the Thackeray & Hutchings A system leads to an eccentricity of 0.45 (with a large error) and a system velocity of –63.2 km/sec. Our red giant orbit, on the other hand, requires that the hot companion’s orbit is circular. We have re-calculated an orbital solution to Thackeray & Hutchings’ data and found and km/s, largely in agreement with the earlier result. We conclude that the blue absorption spectra are not a straightforward reflection of the orbit of the hot companion. In Fig. 3 we see that all data points that force an elliptical orbit lie close to the eclipse of the hot companion (around phase 0). We also note that , the periastron angle, lies close to the line of sight, and the semi-major axis apparently is pointing towards the observer. These are indications that the apparent ellipticity may be an effect tied to our line of sight. If the center of the hot companion lies further from us than the center of the red giant, absorption features intrinsic to the hot companion could be modified as they propagate through the dense wind of the red giant. This affects the distant section of the orbit more than the one closer to us. Line of sight effects can thus be mistaken for signatures of the orbital motion.
In order to exclude this possibility we can employ only those observations where the hot source is closer to us than the red giant. From these observations a circular orbit results that is almost exactly in antiphase (=0.53) with the red giant, and which also reproduces the system velocity of the red giant curve (Fig. 3, top, full line). We therefore believe that the best interpretation of Thackeray’s A system is, that it indeed reflects the hot companion’s motion. But whilst the light from hot source passes through the red giant’s wind, the blue absorption features are contaminated by additional absorptions due to the red giant wind or a flow of material towards the hot companion. Similar line blanketing of the hot component continuum was recently seen in RW Hya (Dumm et al. 1999). In the case of AR Pav, these additional absorptions affect the radial velocity curve in such a way that an elliptical orbit is mimicked.
With this hypothesis, it is straighforward to deduce the hot star’s mass function. The velocity semi-amplitude of the restricted circular orbit = 25.5 km/s is almost unchanged with respect to Thackeray & Hutchings original elliptical solution. This is not surprising since in quadrature the orbital motion is at its highest and absorption effects are unlikely to dominate. The mass function with this K value and zero eccentricity is
| (6) |
This value is substantially higher than the one of Thackeray & Hutchings (1974) which, however, was based on emission line radial velocities.
Combining the velocity semi-amplitudes of the hot and cool stars yields a mass ratio of 2.65 which, with the assumption of sin = 1, leads to individual masses = 0.75 and = 1.9 . The very close agreement with our values of Tab. 3 is a strong and independent confirmation of our previous method to establish binary masses in symbiotic systems.
5.2 Emission lines
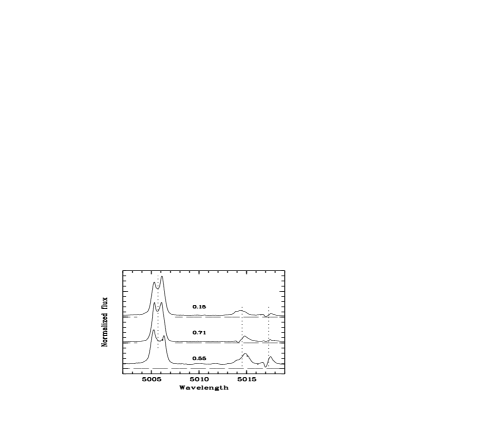
Thackeray & Hutchings (1974) also gave a list of radial velocities of allowed (mainly He i) and forbidden emission lines. To these we added measurements from our observations as well as the data published by Van Winckel et al. (1993). As an example of these newer data we plot in Fig. 4 spectra which show the [O iii]5007, He i5015 and Fe ii(42)5018 lines.
For the permitted lines ’PE’, an orbit with a small and insignificant ellipticity results, which is in clear anticorrelation with the red giant curve (Fig. 3, center). This shows that the dominant source of permitted line emission is associated with the hot component. The semi amplitude of 14 km/sec is however only about half of the value of the hot component, and of –63 km/sec is offset by about +5 km/s with respect to the system velocity from the red giant curve. This offset can easily be explained by P Cygni like absorptions which shift the line center towards the red (see Fig. 4). Also the He i4471 profile in Thackeray & Hutchings (1974) shows such a structure. The P Cyg absorption does not necessarily need to stay constant over an orbital cycle (Fig. 4) which may explain the discrepant K value. In addition there could be more than one PE line region and contamination from these may affect both, the K value as well as the system velocity. In particular, if there was a contribution from material in the neighbourhood of the red giant, the semi-amplitude would be reduced. In view of these uncertainties it is highly unlikely that the PE-spectra directly reveal the orbit of the hot component.
The forbidden lines ’FE’ show a small, but still significant periodic RV variation and the mean velocity = –69.2 km/s is very close to our red giant system velocity. This is expected because forbidden lines do not suffer self–absorption. The [Oiii]5007 lines in our data set are double–peaked with a peak separation of about 1 Å (Fig. 4) wheras [Oiii]4363 in Thackeray & Hutchings (1974) is single–peaked. This difference in line profile is probably not real because the dispersion of the earlier data was not high enough to resolve the double–peak structure. Interestingly, the lines do not shift as a function of phase but the relative size of the blue and red peaks vary such that the line center appears to move backwards and forwards. At present we do not have sufficient data to disentangle the true motion of the various line components. We however note that the FE radial velocity curve is not in anti-phase with the red giant orbit but shifted by about =0.25. The radial velocity maxima therefore occur close to occultation in such a way that, if the red giant is in front, the FE emission is redshifted at maximum.
We finally note that three data points taken between JD 34942.4 and JD 35300.4 strongly deviate from the radial velocity fit and in fact are consistent with the red giant orbital motion. These observations were taken during the height of the 1954 outburst, and we can interpret the deviations in the sense that the FE region was then much closer to the red giant. Thackeray and Hutchings (1974) were unable to find a meaningful orbital solution for their full set of FE data points, the iteration led to the absurd result of e 1. If we remove these three observations we find a solution with an unsignificant ellipticity of e 0.05 and a semiamplitude of 5.8 km/sec. The phase shift relative to the red giant’s orbit remains unchanged at a quarter of a period.
6 UV light curves from IUE spectra
We have analysed all IUE (International Ultraviolet Explorer) spectra of AR Pav stored in the final IUE archive. The spectra were obtained from 1978 to 1984 except for two observations taken in 1992. These last two spectra were excluded from our analysis in order to prevent a distortion in the eclipse curves due to the long term variability of AR Pav. Indeed the flux levels from the latter two spectra do not fit the eclipse curve defined by the other UV data. The few existing small aperture spectra were also disregarded because more accurate large aperture spectra taken on the same dates were available.
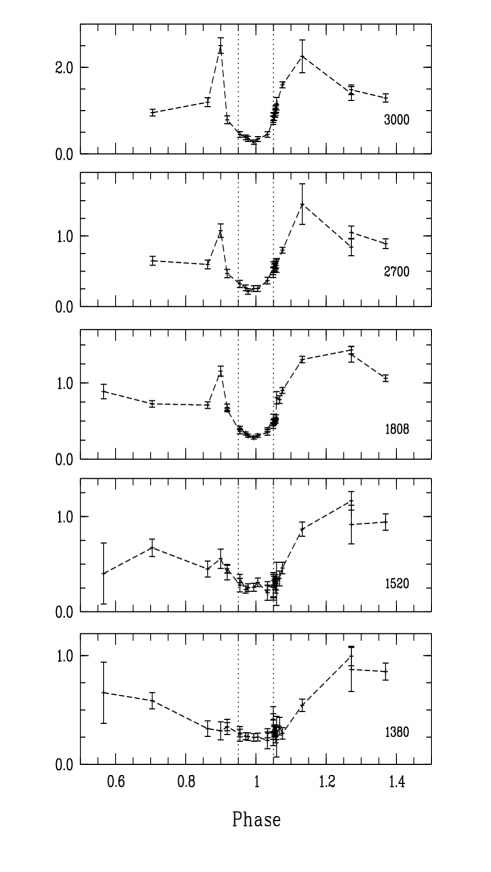
In our search for a wavelength dependent eclipse behaviour we measured the continuum fluxes at five different wavelengths (Fig. 5). All five light curves show a significant flux reduction around . However, the continuum is not completely eclipsed. At mid-eclipse, , there remains a nearly wavelength independent flux of approximately erg cm-2s-1Å-1.
At all wavelengths the entry into eclipse is less abrupt then the recovery which coincides well with the end of the geometrical eclipse at . An asymmetric evolution of the continuum flux through an eclipse has been observed in other symbiotic systems (e.g. Dumm et al. 1999) but in AR Pav the asymmetry is more pronounced then in others.
With our orbital parameters the exit from eclipse could be reproduced by a pointlike UV-source on a orbit around a red giant of = 130 . This agrees well with the red giant radius derived from corotation (Tab. 3). From the corresponding upper limit of corotation, 155 , the observed exit from eclipse of a pointlike source would require an inclination of , or sin .
Contrary to other S-type systems like EG And, RW Hya, or SY Mus, the UV-continuum of AR Pav does not resemble that of a hot white dwarf. Out of eclipse it is strongest at the red end of the IUE range. This suggests a hot source which is considerably cooler than found in other symbiotics.
Hutchings et al. (1983) analysed the 1982 large aperture IUE spectra. Their conclusions were “. . . there is no total eclipse for less than ; 70% of the hottest continuum (below 1400 Å) is seen even at central eclipse. Thus it seems that the source of hottest radiation (and thus presumably the central star) is not eclipsed.” The sample of spectra in Hutchings et al. (1983) is narrowly spaced around mid-eclipse, except for an observation at . In our Fig. 5 we see that because of the asymmetry of the eclipse, a measurement at does not represent the uneclipsed spectrum. The restricted set of their observations, away from the center of the eclipse, is therefore an obvious source of our different conclusions.
The present investigation concentrates on the geometrical configuration and the orbital parameters of the binary, but not on the nebular or stellar physics of the system. The wavelength–dependent occultation behaviour contains information about the structure of the hot component which, however, to explore is beyond the scope of this paper. Here we just aim to establish that AR Pav is indeed an eclipsing system and that our previously made assumptions about a high orbital inclination were justified. As the observations in the visual domain lead us to adopt an orbital plane with , that model also has to be compatible with IUE observations, in particular with the expected shape and depth of the eclipse. The shape of the eclipse shown in Fig. 5 is compatible with an eclipse. The continuum is not completely eclipsed, however, this could be due to a nebular recombination continuum which is emitted from a volume much larger than that occupied by the eclipsed hot star. The fact that the remaining uneclipsed continuum is almost wavelength-independent is a strong indication that it is indeed due to nebular recombination. In the case of a partial eclipse of a disk structure such a pattern is not easily accomodated.
7 Discussion
We present in this paper the first direct radial velocity measurements of the red giant in the AR Pav system. The red giant’s orbit is close to circular and yields a mass function of 0.055 . We also measure the red giant’s rotation velocity and, assuming co-rotation, deduce its radius from which the luminosity and distance immediately follow. Based on RGB/AGB stellar evolutionary tracks we obtain the red giant’s mass, and from the above mass function the mass of the hot companion. It turns out that the AR Pav stellar components have masses similar to other symbiotic systems. In particular the mass of the companion is close to the canonical value of single white dwarfs. The red giant does not fill its Roche lobe.
The velocity amplitude of the hot component can be obtained from historically recorded radial velocities of absorption lines in the blue continuum, taken during an outburst. Combining that result with our new radial velocities of the red giant yields directly the masses of the binary components. These masses are in very close agreement with those that we derive with our co-rotation method developed and applied in Papers I to V, as well as in this work (Section 3 and 4). We therefore have now the first independent confirmation that for symbiotics, this method leads to valid results.
Our masses for the AR Pav binary components differ strongly from earlier values found in the literature. Thackeray and Hutchings (1974) favoured a value of approximately 2.5 for the hot companion and 1.2 for the red giant. They assumed that the radial velocity curve of the permitted emission lines reflected the motion of the hot companion. Although this emission is certainly associated with that object, it is not clear how exactly they are linked. The interpretation of emission lines involves a number of complicating factors like self-absorption which may be phase dependent, and unknown nebular motions which may overlay the binary orbit. In addition, different nebular emission regions might contribute with variable fractions to the total intensity. We conclude that in symbiotic systems, emission lines are rather poor tracers of stellar orbital motions. It is indeed quite instructive to see that only direct observations of the stellar absorbtion features of the M star enable a proper interpretion of emission line radial velocities.
An even higher mass for the hot companion was suggested by Skopal et al. (2000), working with the same mass function as Thackeray & Hutchings (1974). They assumed that the system undergoes Roche lobe overflow. However, we have shown that the mass function derived from emission lines is most likely seriously wrong, and that the Roche lobe assumption is very questionable.
| \ts\tsObject | Period | Separation | RL filling | Ref | |
|---|---|---|---|---|---|
| [d] | [AU] | [ ] | factor | ||
| \ts\tsAR Pav | 604.5 | 1.95 | 130 | 0.52 | 8) |
| \ts\tsFG Ser | 650 | 1.95 | 105 | 0.41 | 7) |
| \ts\tsSY Mus | 624.5 | 1.7 | 86 | 0.38 | 4) |
| \ts\tsEG And | 482.2 | 1.5 | 75 | 0.37 | 3) |
| \ts\tsRW Hya | 370.4 | 1.3 | 60 | 0.34 | 5) |
| \ts\tsAX Per | 680.8 | 1.7 | 110 | 0.30 | 1) |
| \ts\tsAG Peg | 816.5 | 2.5 | 85 | 0.25 | 2) |
| \ts\tsBX Mon | 1401 | 2.0-5.9 | 160 | 0.68-0.18 | 6) |
1) Mikolajewska & Kenyon (1992)
2) Kenyon et al. (1993)
3) Vogel et al. (1992)
4) Paper I
5) Paper II
6) Paper IV
7) Paper V
8) this paper
One of the fundamental questions in relation to symbiotic binaries is the process of mass transfer. Is it predominantly through wind accretion or do the red giants fill their Roche lobes? We now have a small, but already significant sample of symbiotic systems with accurate orbits, they allow to draw some preliminary conclusions. In Tab. 4 we have summarised what we consider to be the presently best available values. The Roche lobe filling factor is the ratio of the red giant’s radius to the distance to the inner Lagrange point. We note that none of the symbiotic red giants fills its Roche lobe. A similar result was already obtained by Mürset & Schmid (1999), who analysed a larger sample of symbiotic stars with, however, less accurately known red giant radii and binary configurations. We therefore conclude that mass transfer occurs predominantly through wind accretion.
Related to this accretion process is the question whether the accretor is surrounded by an accretion disk. To model the wind accretion onto the white dwarf it is necessary to know the physical conditions in its neighbourhood. Among the crucial parameters are the white dwarf radiation field as well as its magnetic field. A strong enough white dwarf radiation field could prevent accretion, a magnetic field could lead to accretion downflows over the polar regions. For AR Pav, unfortunately nothing is known about the white dwarf luminositiy and on its magnetic field. Wind accretion models which neglect both effects such as those of Mastrodemos & Morris 1998 and Mastrodemos & Morris 1999 suggest the formation of accretion disks for a wide range of geometric configurations and red giant wind parameters. Some of their models are similar to those of AR Pav. With the observed radial velocity behaviour of the permitted emission lines, it is likely that at least part of these emission lines originate in the vicinity of the white dwarf. Applying eclipse techniques to available and new high resolution emission line profiles with good orbital coverage, to search for spectral traces of an accretion disk and to study the circumstellar matter distribution would certainly be an interesting continuation to this work.
Acknowledgements.
We are indebted to the ESO staff at Garching and La Silla who made the remote observations possible. TD acknowledges financial support by the Swiss National Science Foundation, and HMS by the Deutsche Forschungsgemeinschaft (WO 296/27-1).References
- [1] Barnes III T.G., Moffett T.J., Slovak M.H., 1986, PASP 98, 223
- [2] Beavers W.I., Eitter J.J., 1986, ApJS 62, 147
- [3] Beavers W.I., Eitter J.J., Ketelsen D.A., Oesper D.A., 1979, AJ 91, 698
- [4] Bruch A., Niehues M., Jones A.F., 1994, A&A 287, 829
- [5] Bressan A., Fagotto F., Bertelli G., Chiosi C., 1993, A&AS 100, 647
- [6] Dumm T., Schild H., 1998, NewA 3, 137
- [7] Dumm T., Schmutz W., Schild H., Nussbaumer H., 1999, A&A 349, 169
- [8] Dumm T., Mürset U., Nussbaumer H., Schild H., Schmid H.M., Schmutz W., Shore S.N., 1998, A&A 336, 637 (Paper IV)
- [9] Dyck H.M., Benson J.A., van Belle G.T., Ridgway S.T., 1996, AJ 111, 1705
- [10] Glass I.S, Webster B.L., 1973, MNRAS 165, 77
- [11] Hutchings J.B., Cowley A.P., Ake T.B., Imhoff C.L., 1983, ApJ 275, 271
- [12] Kenyon S.J., Webbink R.F., 1984 , ApJ 279, 252
- [13] Kenyon S.J., Mikołajewska J., Mikołajewski M., Polidan R.S., Slovak M.H., 1993, AJ 106, 1573
- [14] Mastrodemos N., Morris M., 1998, ApJ 497, 303
- [15] Mastrodemos N., Morris M., 1999, ApJ 523, 357
- [16] Mayall M.W., 1937, Harvard Annals, 105, 492
- [17] Merrill P.W., Burwell C.G., 1943, ApJ 98, 153
- [18] Mikołajewska J., Kenyon S.J., 1992, AJ 103, 579
- [19] Mürset U., Schmid H.M., 1999, A&AS 137, 473
- [20] Mürset U., Dumm T., Isenegger S., Nussbaumer H., Schild H., Schmid H.M., Schmutz W., 2000, A&A 353, 952
- [21] Schild H., Mürset U., Schmutz W., 1996, A&A 306, 477 (Paper II)
- [22] Schild H., Dumm T., Folini D., Nussbaumer H., Schmutz W., 1999, Proceedings of the Conference ’The Universe as seen by ISO’, ESA SP-427, 397
- [23] Schmid H.M., Dumm T., Mürset U., Nussbaumer H., Schild H., Schmutz W., 1998 A&A 329, 986 (Paper III)
- [24] Schmutz W., Schild H., Mürset U., Schmid H.M., 1994, A&A 288, 819 (Paper I)
- [25] Skopal A., Djurasevic G., Jones A., Drechsel H., Rovithis-Livaniou H., Rovithis P., 2000, MNRAS 311, 225
- [26] Thackeray A.D., 1959, MNRAS 119, 629
- [27] Thackeray A.D., Hutchings J.B., 1974, MNRAS 167, 31
- [28] Van Winckel H., Duerbeck H. W., Schwarz H. E., 1993, A&AS 102, 401
- [29] Zahn J.-P., 1977, A&A 57, 383