X-ray Constraints on the Warm-Hot Intergalactic Medium
Abstract
Three observational constraints can be placed on a warm-hot intergalactic medium (WHIM) using ROSAT PSPC pointed and survey data, the emission strength, the energy spectrum, and the fluctuation spectrum. The upper limit to the emission strength of the WHIM is keV s-1 cm-2 sr-1 keV-1 in the keV band, an unknown portion of which value may be due to our own Galactic halo. The spectral shape of the WHIM emission can be described as thermal emission with , although the true spectrum is more likely to come from a range of temperatures. The values of emission strength and spectral shape are in reasonable agreement with hydrodynamical cosmological models. The autocorrelation function in the 0.44 keV 1.21 keV band range, , for the extragalactic soft X-ray background (SXRB) which includes both the WHIM and contributions due to point sources, is for in the keV band. This value is lower than the Croft et al. (2000) cosmological model by a factor of , but is still not inconsistent with cosmological models. It is also found that the normalization of the extragalactic power law component of the soft X-ray background spectrum must be keV s-1 cm-2 sr-1 keV-1 to be consistent with the ROSAT All-Sky Survey.
1 Introduction
The problem of the missing baryons is well known; measurements of D in high redshift absorption line systems and application of Big Bang Nucleosynthesis models reveal a baryon fraction, , (Burles & Tytler 1998) while inventories of local material can account for only (Fukugita et al. 1998). Cosmological hydrodynamical simulations (Cen et al. 1995, Cen & Ostriker 1999, Bryan & Norman 1998, Davé et al. 2000, and Croft et al. 2000 for example) suggest that the missing baryons exist as shock-heated low-density filaments of a “warm-hot” intergalactic medium (WHIM) at temperatures of . The visibility of the WHIM is compromised by a number of Galactic foregrounds that exist in the lower part of this temperature range, the Local Hot Bubble (, Snowden et al. 1998) and the Galactic Halo ( and, perhaps , Kuntz & Snowden 2000a). All of these components emit predominately below E=1 keV, where Galactic absorption can be significant. A component at the high end of the WHIM range (e.g., ) would emit strongly in the 1.5 keV band. However, Hasinger et al. (1998) has directly resolved 70-80% of the flux in the 0.5-2.0 keV range, leaving little room for diffuse components. Thus, significant diffuse emission at the high end of the WHIM range would be difficult to reconcile with observations, while emission at the low end of the WHIM range becomes difficult to detect.
Without high resolution, high grasp, non-dispersive X-ray spectrometers, there are three observational tests of the WHIM models; the total emission, the energy spectrum, and the fluctuation spectrum. Theoretical calculations by Cen & Ostriker (1999) suggest that the WHIM produces keV s-1 cm-2 sr-1 keV-1 at 0.7 keV; the Croft et al. (2000) prediction for the entire IGM in the 0.5-2.0 keV band yields the same value for the keV band (ROSAT R45 band). Phillips et al. (2000), however, estimate a substantially lower X-ray emission, keV s-1 cm-2 sr-1 keV-1 in the 0.5-2.0 keV band. Davé et al. (2000) using a number of models including that of Croft et al. (2000) predicts that the baryon fraction as a function of temperature will be peaked near . Finally, Croft et al. (2000) predict that the value of the ACF of the entire extragalactic SXRB in the 0.5-2.0 keV band should be for .
2 The Emission Strength
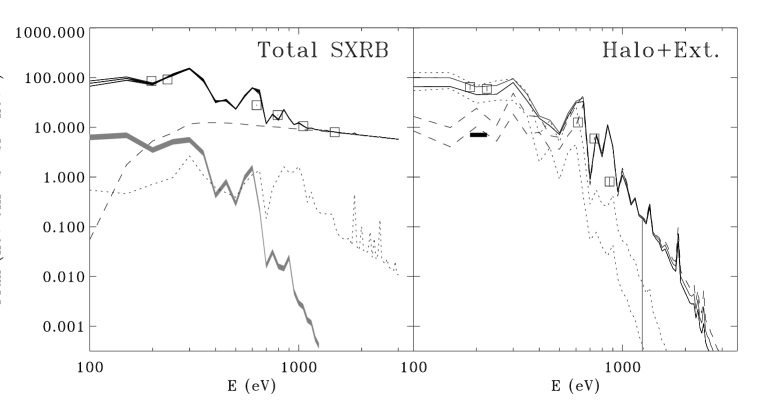
To determine a limit to the strength of the WHIM emission, we apply the methods of Kuntz & Snowden (2000a) to the north Galactic polar cap, and . The left panel of Figure 1 shows broad-band data from the ROSAT All-Sky Survey (RASS), for the north polar cap as well as the best fit model spectrum, which is shown at a much higher energy resolution than measureable with ROSAT. The broad-band data has been corrected for band-to-band point source detection limit differences. We have assumed that the soft X-ray background (SXRB) is composed of the following foregrounds/backgrounds which may be successively removed.
Unresolved Galactic Stars: The model of Kuntz & Snowden (2000b) (similar to the model of Guillout et al. (1996)) has been used to calculate the spectrum of the Galactic stars below the RASS point source detection limit. This model reproduces the number of stellar X-ray sources in the to counts s-1 range found in deep pointings, to about 10%; unfortunately the luminosity function is expected to rise for another two orders of magnitude, so there may be larger uncertainties for the total unresolved flux.
Unresolved Extragalactic Point Sources: The measured spectrum of the unresolved extragalactic point sources has been taken from Chen et al. (1997) who find a photon index, , from individual ROSAT and ASCA spectra. Since the RASS has a better non-cosmic background subtraction than is possible for any single pointed observation, the normalization of this extragalactic power-law was adjusted so that all of the known emission components account for all of the band R7 (1.05 keV 2.04 keV) flux. The required normalization is keV s-1 cm-2 sr-1 keV-1, the bulk of the uncertainty is due to the systematic uncertainty in the R7 band flux, counts s-1 arcmin-2. This value is considerably less than the recent SAX value of keV s-1 cm-2 sr keV-1 (Vecchi et al. 1999), and is % higher than the HEAO-1 value of Marshall et al. (1980). It has been assumed that the extragalactic power-law does not have a break within the ROSAT energy range as Mushotzky et al. (2000) find no break in the 0.3-10.0 keV range for the aggregate spectrum of a sample of their faintest Chandra sources.
Local Hot Bubble: The strength of the LHB is determined from the variation of observed flux with total absorbing column in the manner of Snowden et al. (1998) and Kuntz & Snowden (2000a).
The Remainder: The remaining flux contains contributions from all components beyond the Galactic absorption that are not due to the unresolved extragalactic point sources; the Galactic halo and any extragalactic diffuse emission. The right panel of Figure 1 shows this remainder after correction for the Galactic absorption.
As Kuntz & Snowden (2000a) showed that the emission from beyond the Galactic absorption cannot be fit by a single thermal component, we fit this remainder with two Raymond & Smith (1977) model components; the lack of independent spectral resolution elements prohibits fitting a greater number of components. The fits to the north polar cap produce temperatures similar to those found in Kuntz & Snowden (2000a) for , despite the differences in analysis (subtraction of the composite stellar spectrum and the renormalization of the EPL); and .
The strength of the soft component varies strongly across the sky while the strength of the hard component is quite uniform (Kuntz & Snowden 2000a), at least at relatively high galactic latitudes (). The angular variation of the soft component suggests a Galactic origin, while the uniformity of the hard component suggests that it is due either to a Galactic corona in hydrostatic equilibrium, or extragalactic emission. There is no way, on the basis of ROSAT photometry, to separate Galactic halo emission from diffuse extragalactic emission. Therefore, the upper limit to the diffuse extragalactic emission is the strength of the hard component, keV s-1 cm-2 sr-1 keV-1 in the keV band. Note that the minimum keV emission from beyond the Galactic absorption is keV s-1 cm-2 sr-1 keV-1 (Snowden et al. 2000), consistent with the keV flux produced by the hard component.
One might hope to place a limit on the contribution of the Galactic halo by considering the halos of Milky Way analogues. M101 is the closest face-on Milky Way analogue, though its is about twice that of the Milky Way, and its star formation rate as measured by is a factor of lower than the Milky Way. The sun is from the Galactic center; at an equivalent radius in M101 the upper limit of the keV surface brightness due to M101 (which would include its halo and some emission from its disk) is half the strength of our hard component in the same band. However, for NGC 891, which has about half the mass of the Milky Way, a similar , and a similar , an observer at from its center would see a galactic halo that is times brighter than our hard component (Bregman & Houk 1997)! The relation between the strength of the halo and the stellar formation rate is not sufficiently understood to determine the fraction of the hard component that might be due to our own Galactic halo.
3 Energy Spectrum
The fraction of baryons at each temperature in the Croft et al. (2000) model is shown in Davé et al. (2000). The baryon fraction at is peaked at ; if the baryon fraction were weighted by the emission at each temperature, the distribution would be more sharply peaked and at somewhat higher temperatures. The contribution of baryons at higher is substantially smaller than that of baryons at and is peaked at somewhat lower temperatures ( at ). Given the caveats above, the agreement of the temperature of our hard component () with the “characteristic” temperature predicted by the simulations is comforting, but may be completely fortuitous if the bulk of the emission is due to the Galactic halo.
4 Fluctuation Spectrum
We have determined the autocorrelation function (ACF) for the keV band (ROSAT band R45) from seven mosaics of deep PSPC pointings. The non-cosmic background of each PSPC pointing was removed using ESAS (Snowden & Kuntz 1998), all point sources were removed, the image was restricted to the inner , and the resulting data were mosaicked (Kuntz & Snowden 1998). The remaining non-cosmic background was removed by comparing the mosaics to the RASS . Using the variation of transmitted flux with column density, we determined the strength of the LHB in the R1L2 band, extrapolated this quantity to the R45 band, and removed it from the image. As the point source detection limit varies across each mosaic, the mosaics were corrected using the extragalactic point source of Hasinger et al. (1998) and the Galactic stellar luminosity function of Kuntz & Snowden (2000b). Each R45 band mosaic was then corrected for Galactic absorption. The resultant image contains contributions from the Galactic halo, the unresolved extragalactic point sources, and the extragalactic diffuse emission. Once all the corrections were determined, the mosaics were reconstructed using only the central radius region of each pointing. The smallest scale for which one may meaningfully calculate the ACF is the size of the largest PSF, . (Although the ROSAT PSF is on axis, the size of the PSF grows rapidly with distance from the optical axis.)
For each mosaic we calculated the ACF,
| (1) |
where the sum is over all pairs of pixels seperated by , is the count rate in those pixels, and is the statistical weight (the exposure time) given to those pixel
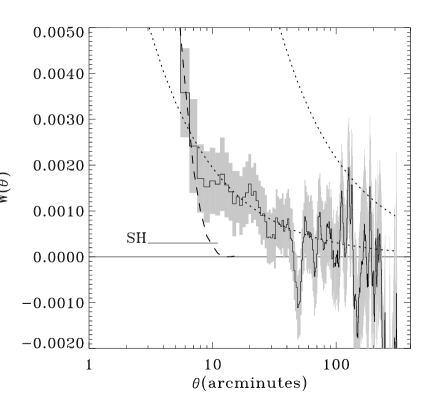
We find that there is a significant mosaic-to-mosaic variation in the ACF, which was confirmed by variance analyses () of the mosaics. The ACFs of individual mosaics were weighted by the mean exposure to calculate the mean ACF shown in Figure 2. As the effective point source detection limit for a mosaic can be much smaller than for individual exposures, the ACF contains a contribution from residual point sources whose PSF radii range up to ; the maximum possible contribution due to the residual point sources is shown by the dashed line. Thus, the ACF shown is the upper limit for scales smaller than .
The short line labeled “SH” is the ACF determined by Soltan & Hasinger (1994) for the ROSAT R67 band (0.73 keV 2.04 keV); over the interval shown it is nearly consistent with zero. The dotted lines show the ACFs from Chen et al. (1994), corrected from their energy band (ROSAT band R45 + R67) to our band energy (ROSAT band R45), assuming that the fluctuations in the R67 band are negligible for these scales. The upper line is their measured ACF; the lower line is the ACF that they derived by fitting the data with the function .
We chose to measure the ACF in the keV band as the hard component discussed in the previous section will have a stronger contribution in this band at higher energies, but there will not be as great a problem with Galactic absorption as there is at lower energies. However, the only published model ACF (Croft et al. 2000) is for the 0.5-2.0 keV band. Since the Soltan & Hasinger (1994) ACF for higher energies is much smaller than that for the keV band, the ACF for the 0.5-2.0 keV band can be estimated from our ACF by scaling it by the quantity
| (2) |
which is . Taking the ACF for the PSF mosaics, we find that the ACF in the 0.5-2.0 keV band should be for . This is about a factor of five smaller than the model predictions.
There may, in fact, be contributions to the ACF due to the Galactic halo and the LHB, but these are expected to be small. The ACF for emission from the LHB has been measured for the range and is consistent with zero (Kuntz 2000).
Such a direct comparison of theory and observation is not correct. The linear size of the Croft et al. (2000) simulation () corresponds to Mpc at a distance of 500 Mpc and contains an X-ray emitting cluster of galaxies. Since the mean separation of clusters is several times larger than 8 Mpc, the simulation has an atypical overdensity (hence atypically large concentration of X-ray emission), and thus a higher value of the ACF.
The observed ACFs show variation among mosaics with solid angles of 10 to 30 square degrees; the root of the variance of our set of seven mosaics is about twice the displayed uncertainty. This variation may be consistent with cosmic variation.
5 Discussion
We have determined the upper limit to the strength of diffuse extragalactic emission in the soft X-ray range, by “peeling off” various known foregrounds and backgrounds. What is left is some combination of extragalactic diffuse emission and Galactic halo emission. We expect our galaxy to have an X-ray halo simply due to hydrostatic equilibrium (the virial temperature is K) and because other galaxies like our own have them. The strength of the halo remains a vexed issue. The combined halo/extragalactic emission weighs in at just about the strength expected for the extragalactic component alone, so either our galaxy has very little halo, or the models over-predict the X-ray emission of the WHIM. The lower Phillips et al. (2000) value suggests that more care may be needed in comparing simulations to measurements.
It should be noted that this analysis has used a normalization for the contribution by the unresolved extragalactic point souces that is at the lower end of the range of values commonly used. Independent of the existence of extragalactic diffuse emission, or the existence of a Galactic halo, the RASS will not admit to a higher value for the normalization. Increasing the normalization decreases the amount of flux available for the extragalactic diffuse emission to significantly smaller than that predicted by the models.
The upper limit to the ACF in the keV band is smaller, by about a factor of five, than that predicted by the models at a scale of , and all the improvements to the measurement of the ACF (better correction for residual point sources and more robust estimates of the contribution to the fluctuations by the halo and the LHB) will only further decrease the value of the ACF. If a portion of the hard component strength is due to the galactic halo, the weakness of the observed ACF signal may be due to the reduced strength of the extragalactic emission. However, as noted above, one should compare our mean ACF with the ACF of a simulation whose size is comparable to the cluster correlation length rather than a small region surrounding a cluster.
6 Conclusion
The observed emission strength, energy spectrum, and fluctuation spectrum of the soft X-ray background originating from beyond the Galactic absorption is roughly consistent with the predictions by hydrodynamical simulations of the universe. Even given the caveats concerning the Galactic halo, the current observations do not disprove the existing models. The observations here present solid guideposts for further exploration of the accessible parameter space by future generations of simulations.
We wish to thank J.P. Ostriker and the anonymous referee for their very useful comments.
References
- Bregman & Houk (1997) Bregman, J. N., & Houk, J. C. 1997, ApJ, 485, 159
- Bryan & Norman (1998) Bryan, G. L., & Norman, M. L. 1998, ApJ, 495, 80
- Burles & Tytler (1998) Burles, S., & Tytler, D. 1998, ApJ, 499, 699
- Cen et al. (1995) Cen, R., Kang, H., Ostriker, J. P., & Ryu, D. 1995, ApJ, 451, 436
- Cen & Ostriker (1999) Cen, R., & Ostriker, J. P. 1999, ApJ, 514, 1
- Chen et al. (1997) Chen, L.-W., Fabian, A. C., & Gendreau, K. C. 1997, MNRAS, 285, 449
- Chen et al. (1994) Chen, L.-W., Fabian, A. C., Warwick, R. S., Branduardi-Raymont, G., & Barber, C. R. 1994, MNRAS, 266, 846
- Croft et al. (2000) Croft, R. A. C., Matteo, T. D., Davé, R., Hernquist, L., Katz, N., Fardel, M. A., & Weinberg, D. H. 2000, ApJ, submitted
- Davé et al. (2000) Davé, R., et al. 2000, ApJ, submitted
- Fukugita et al. (1998) Fukugita, M., Hogan, C. J., & Peebles, P. J. E. 1998, ApJ, 503, 518
- Guillout et al. (1996) Guillout, P., Haywood, M., Motch, C., & Robin, A. C. 1996, A&A, 316, 89
- Hasinger et al. (1998) Hasinger, G., Burg, R., Giacconi, R., Schmidt, M., Trümper, J., & Zamorani, G. 1998, A&A, 329, 482
- Kuntz (2000) Kuntz, K. D. 2000, Ph.D. thesis, University of Maryland
- Kuntz & Snowden (1998) Kuntz, K. D., & Snowden, S. L. 1998, Cookbook for analysis procedures for ROSAT XRT Observations of Extended Objects and the Diffuse Background, Part II: Mosaics, Technical report, NASA/GSFC
- Kuntz & Snowden (2000a) Kuntz, K. D., & Snowden, S. L. 2000a, ApJ, 543, 195
- Kuntz & Snowden (2000b) Kuntz, K. D., & Snowden, S. L. 2000b, ApJ, in preparation
- Marshall et al. (1980) Marshall, F. E., Boldt, E. A., Holt, S. S., Miller, R. B., Mushotzky, R. F., Rose, L. A., Rothschild, R. E., & Serlemitsos, P. J. 1980, ApJ, 235, 4
- Mushotzky et al. (2000) Mushotzky, R. F., Cowie, L. L., Barger, A. J., & Arnaud, K. A. 2000, Nature, 404, 459
- Phillips et al. (2000) Phillips, L. A., Ostriker, J. P., & Cen, R. 2000, ApJ, submitted
- Raymond & Smith (1977) Raymond, J. C., & Smith, B. W. 1977, ApJS, 35
- Snowden et al. (1998) Snowden, S. L., Egger, R., Finkbeiner, D., Freyberg, M. J., & Plucinsky, P. P. 1998, ApJ, 493, 715
- Snowden et al. (2000) Snowden, S. L., Freyberg, M. J., Kuntz, K. D., & Sanders, W. T. 2000, ApJS, 128, 171
- Snowden & Kuntz (1998) Snowden, S. L., & Kuntz, K. D. 1998, Cookbook for analysis procdures for ROSAT XRT Observations of Extended Objects and the Diffuse Background, Part I: Individual observations, Technical report, NASA/GSFC
- Soltan & Hasinger (1994) Soltan, A., & Hasinger, G. 1994, A&A, 288, 77
- Vecchi et al. (1999) Vecchi, A., Molendi, S., Guainazzi, M., Fiore, F., & Parmar, A. N. 1999, A&A, 349, L73