Giant cluster arcs as a constraint on the scattering cross-section of dark matter
Abstract
We carry out ray tracing through five high resolution simulations of a galaxy cluster to study how its ability to produce giant gravitationally lensed arcs is influenced by the collision cross-section of its dark matter. In three cases typical dark matter particles in the cluster core undergo between 1 and 100 collisions per Hubble time; two more explore the long (“collisionless”) and short (“fluid”) mean free path limits. We study the size and shape distributions of arcs and compute the cross-section for producing “extreme” arcs of various sizes. Even a few collisions per particle modify the core structure enough to destroy the cluster’s ability to produce long, thin arcs. For larger collision frequencies the cluster must be scaled up to unrealistically large masses before it regains the ability to produce giant arcs. None of our models with self-interacting dark matter (except the “fluid” limit) is able to produce radial arcs; even the case with the smallest scattering cross-section must be scaled to the upper limit of observed cluster masses before it produces radial arcs. Apparently the elastic collision cross-section of dark matter in clusters must be very small, below 0.1 cm2g-1, to be compatible with the observed ability of clusters to produce both radial arcs and giant arcs.
keywords:
dark matter – gravitational lensing – cosmology: theory – galaxies: clusters1 Introduction
Several recent observations indicate a potential problem with the Cold Dark Matter (CDM) scenario of structure formation in that they seem to contradict the numerically simulated density structure of CDM haloes. A first difficulty is posed by published rotation curves of dwarf galaxies, which often rise linearly from the centre to radii greater than kpc. Such a rise implies a constant-density core for the host dark-matter halo [Moore 1994, Flores & Primack 1994], and is in conflict with the central density cusps of the haloes found in -body simulations, which are usually fitted by a double power-law profile with central logarithmic slope (Navarro, Frenk & White 1997, hereafter NFW; Moore et al. 1999b). A second problem is related to the large number of low-mass subclumps found orbiting within simulated galaxy-size haloes; with a naive scaling to the observed properties of dwarf galaxies within the Local Group, the abundance of these subclumps appears too high by a factor of 10 to 50 [Moore et al. 1999a, Klypin et al. 1999].
A possible way to modify the CDM scenario to be compatible with these observations has recently been suggested by Spergel & Steinhardt [Spergel & Steinhardt 2000]. They propose a model where the dark matter is self-interacting but dissipationless. They argue that if the dark matter particles have a sufficiently large cross-section for elastic scattering, the strength of the central density concentration and the abundance of orbiting subclumps can both be reduced. Collisions between dark matter particles would destroy the central cusps and lead to a gradual evaporation of small subclumps.
Self-interacting dark matter would also affect the structure of galaxy clusters, making them more nearly spherical and reducing the number of subclumps. These effects have been confirmed by several recent studies in which the halo properties in cosmological simulations of collisionless cold dark matter and self-interacting dark matter have been compared. For instance, Yoshida et al. [Yoshida et al. 2000b] and Davé et al. [Davé et al. 2001] found that intermediate scattering cross sections for dark matter particles produce haloes which are less centrally concentrated than in a collisionless model and have smoother and more spherical cores. Similar results have also been obtained by Burkert [Burkert 2000], Firmani et al. (2000,2001) and Kochanek & White [Kochanek & White 2000], although they find different time scales for the onset of core collapse, which transforms intermediate flat cores into cores with density profiles .
It is natural to ask how self-interacting dark matter would affect the strong gravitational lensing properties of galaxy clusters. Strong lensing is a very powerful tool to probe the distribution of dark matter in cluster cores. From the location of multiple images of background sources lensed by a cluster one can obtain a detailed map of the mass distribution in the lens [Tyson, Kochanski & dell’Antonio 1998]. The morphology of long arcs observed in the cluster fields yields important information on the core density [Bartelmann et al. 1998]. Finally, the location of radial arcs can put strong constraints on the size and compactness of the lens cores (e.g. Narayan & Bartelmann 1997).
The goal of this paper is to evaluate whether self-interacting dark-matter models are compatible with the observed ability of galaxy clusters to produce strong lensing events. Some recent work has already addressed this issue. Miralda-Escudé [Miralda-Escudé 2000] argued that the shallow cores produced by self-interacting dark matter could not agree with current observations of lensing by clusters. Wyithe, Turner & Spergel [Wyithe et al. 2000] studied simplified analytic models of self-interacting dark matter haloes and found large collision cross-sections to be incompatible with multiple imaging by clusters. In this paper, we address the issue by using ray-tracing through high resolution simulations to compute lensing cross sections for arcs of various types. We study a set of simulations designed to isolate the effect of collisions between dark matter particles on the structure of an individual cluster.
2 Numerical simulations
2.1 Cluster models
The cluster models used in this study are those described in Yoshida et al. (2000a,b). They consist of a set of five different resimulations of the same cluster-sized halo, which is the second most massive object in the GIF-CDM simulation of Kauffmann et al. [Kauffmann et al. 1999]. All simulations were performed with the GADGET code (Springel, Yoshida & White 2000), in a flat model universe, with a matter density parameter and a cosmological constant of . The Hubble constant is assumed to be . The CDM power spectrum was normalised so that the rms matter density fluctuations in spheres of radius is ( is the value of in units of 100 km s-1 Mpc-1).
The first cluster of the series (hereafter called the S1 model) is just a resimulation at higher resolution of the original GIF-CDM cluster, and was produced assuming standard collisionless dark matter. Three other simulations (hereafter called W-models) were carried out introducing elastic scattering between CDM particles. This was accomplished by the Monte-Carlo method proposed by Burkert [Burkert 2000], slightly modified by considering the pairwise velocity difference in evaluating the scattering probability instead of the one-point velocity dispersion. The three simulations differ in the value of the scattering cross section per unit mass : , and were chosen. Hereafter, we will refer to these models as S1Wa, S1Wb and S1Wc, respectively, following the notation of Yoshida et al. [Yoshida et al. 2000b]. Finally, Yoshida et al. [Yoshida et al. 2000a] also considered the extreme case in which dark matter particles are as strongly interacting as in the “fluid” limit (see also Moore et al. 2000). In this last simulation, the time evolution, starting from the same initial conditions as in the collisionless original simulation, was followed solving the fluid equations with the SPH technique. In the following, this model will be referred to as S1F.
The resolution achieved in these simulations is quite high. Most of them employ particles in the central, high-resolution region, where the particle mass is . The gravitational softening length is set to . All haloes have a similar final virial mass of .
For our lensing analysis, we picked the simulation snapshots at redshift because this is close to the most efficient redshift for strong gravitational lensing (e.g. Bartelmann et al. 1998).
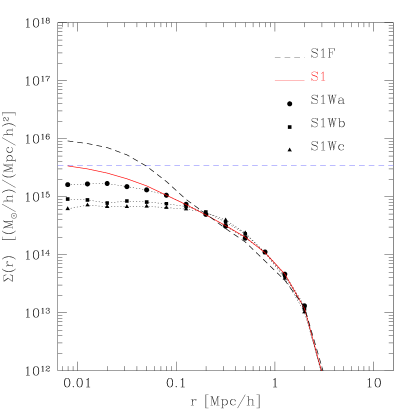
The two-dimensional density profiles of the five cluster models at this redshift are shown in Fig. 1. The general trends in the profiles follow our expectations. As the scattering cross section of the dark matter particles increases, the cluster density profile in the inner region of the halo flattens. Note that the central density for the model S1Wb is smaller by more than one order of magnitude than that of the model S1.
The halo shape also depends on . The principal axis ratios of the five models, determined from the inertial tensors of the matter at densities exceeding 100 times the critical value, are listed in the third column of Table 1. The values clearly show that the haloes are more spherically symmetric when the frequency of collisions between the dark matter particles increases. In the fourth column of Table 1, we also report the core radius of the three haloes with self-interacting dark matter, which we define as the distance from the cluster centre where the surface density drops below half its central value. For models S1Wb and S1Wc we typically find core radii larger than .
| Model | |||
|---|---|---|---|
| [] | [] | ||
| S1 | - | 1:0.58:0.54 | 40 |
| S1Wa | 0.1 | 1:0.63:0.60 | 110 |
| S1Wb | 1.0 | 1:0.67:0.65 | 245 |
| S1Wc | 10.0 | 1:0.86:0.85 | 400 |
| S1F | - | 1:0.95:0.81 | 35 |
2.2 Lensing properties of the clusters
Our method to study the lensing properties of galaxy clusters has been described in detail in Meneghetti et al. [Meneghetti et al. 2000]. Compared to that paper, only few parameters are changed here; therefore, we only give a brief description here and refer the reader to the original paper for further details. For a general introduction to the theory of gravitational lensing, see, e.g. Schneider, Ehlers & Falco [Schneider, Ehlers & Falco 1992], Narayan & Bartelmann [Narayan & Bartelmann 1997] and references therein.
Starting from a cluster simulation, we construct cluster lenses as follows. We centre the cluster in a cube of side length and obtain the three-dimensional density field by interpolating the mass density within a regular grid of cells, using the Triangular Shape Cloud method (TSC; see Hockney & Eastwood 1988). We then produce three different surface-density fields per cluster by projecting along each of the three coordinate axes. This yields three lens planes per cluster, which we consider independent cluster models for the present purpose. As long as the TSC smoothing kernel is sampled by sufficiently many particles, smoothing and projecting can be interchanged, so that smoothing the three-dimensional density prior to projecting it is equivalent to projecting first and then smoothing the two-dimensional density. We checked and confirmed that changing the grid resolution up by a factor of two yields surface-mass densities with indistinguishable lensing properties.
The surface density fields are then scaled by the critical surface mass density for lensing, which depends on the cosmological parameters and on the lens and source redshifts. We recall that the redshift for the lensing cluster is , and we put all sources to . This choice is motivated by the fact that galaxy clusters at redshifts between and are most efficient strong gravitational lenses for sources at redshifts . Although real sources are distributed in redshift, putting all of them at a single redshift is admissible because the critical surface density changes very little with source redshift if the lens redshift is substantially smaller, as is the case here.
Scaling with the critical surface density yields three two-dimensional convergence fields for each cluster. We then propagate a bundle of light rays through the central quarter of each of these fields. Their deflection angles, directly obtained from the convergence, are used to compute the shear and the elements of the Jacobian matrix , which describes the local properties of the lens mapping. It is symmetric and can thus be diagonalised. Its two eigenvalues are
| (1) |
Radial and tangential critical lines are located where the conditions
| (2) |
are satisfied, respectively. The corresponding caustics in the source plane, close to which sources are imaged as large arcs, are obtained applying the lens equation to the critical curves. All lens properties are computed on grids with an angular resolution of on the lens plane, so that lensed images are properly resolved.
The sources are initially distributed on a regular grid in the source plane. Their spatial density is iteratively increased near caustic curves. Placing a larger number of sources where the lens strength is highest increases the probability of producing long arcs and thus the numerical efficiency of the method. In the following statistical analysis, it is then necessary to compensate for this artificial increase by assigning to each image a statistical weight proportional to the inverse of the resolution of the grid on which its source was placed.
Sources are assumed to be elliptical, with axis ratios randomly drawn from the interval , and area equal to that of a circle of diameter. We checked that changing the average source size does not affect our final results.
For the classification of images we follow the technique introduced by Bartelmann & Weiss [Bartelmann & Weiss 1994], which was also used in Meneghetti et al. [Meneghetti et al. 2000].
3 Results
3.1 Distributions of image properties
In this section, we present and compare the statistical properties of the images of background sources lensed by the models of our cluster sample. For each image, we compute the length (defined as the maximum length of the circular segment passing through the image), the width (found by fitting the image with several geometrical figures; for further details, see Meneghetti et al. 2000), and the length-to-width ratio . For the following analysis, we combine the results of two sets of lensing simulations, in which we used the same lenses but changed the distribution of the background sources by drawing different orientations and axial ratios. With this procedure we confirm the robustness of the results and improve the statistics. Searching for large arcs, we can neglect the images of unlensed or even weakly lensed sources. Therefore, we can exclude those images from the analysis whose area is smaller than two times the area of their unlensed sources, which also avoids uncertainties in the automatic arc classification and parameter estimation. The number of images in the final analysed samples ranges between 11,252 for model S1Wc and 24,695 for model S1F.
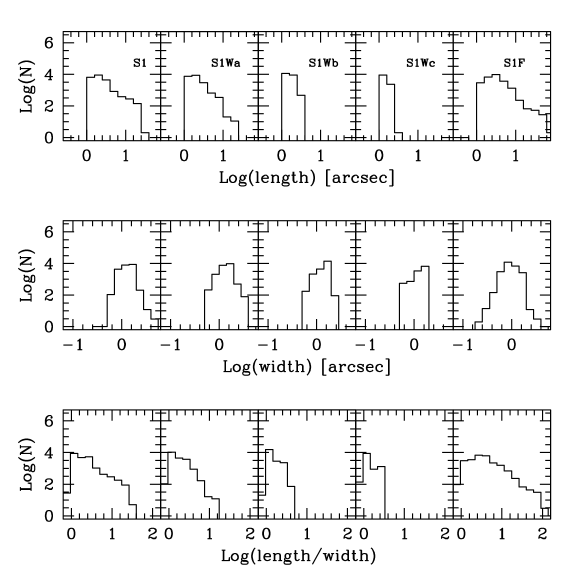
We plot the distributions of arc properties in Fig. 2. The histograms show the number of arcs observed in the field of the five cluster models as a function of their length (top panels), width (middle panels) and length-to-width ratio (bottom panels). Each column refers to a different model. From left to right: the pure collisionless case S1, the three models S1Wa, S1Wb and S1Wc (with cross section of , , and , respectively), and the “fluid” limit model S1F. To facilitate the comparison, we show in Fig. 3 the 0, 1, 10, 50, 90, 99, and 100 percentiles of the distributions plotted in Fig. 2.
Regarding arc lengths, we find that model S1 produces a higher number of long arcs than the collisional W-models. Moreover, as shown in the top left panel of Fig. 3, the highest percentiles (i.e. the largest arc lengths in the sample), change significantly going from S1 and S1Wa to S1Wb and S1Wc. This is easily understood in terms of the different density profiles of the models in the inner regions of the cluster. S1 has a steeper profile, and so it reaches a higher central surface density than models S1Wa, S1Wb and S1Wc. The tangential critical curve is located where , i.e. where , and is just proportional to the lens surface density. Therefore, the curve shrinks as the surface density profile flattens. Consequently, the probability of producing long arcs is highest for model S1, which has the longest tangential critical curve.
Models S1Wb and S1Wc do not produce arcs longer that , hence these models are unable to strongly distort background images. Their central surface density is and of the critical value, respectively, and the shear is reduced by the reduction of subhaloes and the increased axial symmetry caused by dark-matter interaction. Consequently, the combination of convergence and shear never succeeds to produce critical lines, regardless of the projection considered. At the opposite end, the fluid limit case S1F yields a number of long arcs larger than S1 because the extremely high density in the centre of this cluster pushes the tangential critical curve outward and extends it.
The distribution of image widths is also sensitive to the size of the interaction cross section. The zero-percentile (giving the width of the thinnest arcs in the sample) moves to higher widths as increases, indicating that S1 produces thinner arcs than the W-models. As demonstrated by Kovner [Kovner 1989] and Hammer [Hammer 1991], the radial extension of a tangential arc is magnified by a factor of order relative to its original size. Therefore, if at the tangential critical line, tangential arcs are demagnified in width. This condition can be achieved only if the central density of the lens is particularly high with a steep surface-density profile, as is the case for model S1F, or if the lens has an aspherical mass distribution or pronounced substructures [Bartelmann & Weiss 1994, Bartelmann et al. 1995]. In fact, these lens features both contribute to pushing the critical curves outward, where is lower. As the steepness of the density profile and the predominance of substructures both decrease going from model S1 to the W-models, the observed increase of the zero-percentile shown in the second panel of Fig. 3 is consistent with our expectations. The lack of substructures in model S1F is compensated by the very dense core, providing this cluster with the capability of producing very thin arcs.

From the middle panels in Fig. 2 and the middle panel of Fig. 3 (100-percentile), it can also be seen that the number of thick arcs decreases as the interaction cross section grows. The width distribution for S1Wb and S1Wc reflects the fact that these two models produce only weak distortions on the images of the background sources, that is, both image lengths and widths are only slightly changed with respect to their intrinsic values. On the other hand, the higher central surface density of the S1, S1Wa and S1F models makes them critical for strong lensing.
Finally, and consistently with the previous discussion on arc lengths and widths, the distributions of the image length-to-width ratios show that, when the dark matter particles interact more frequently and the density profile becomes shallower, the number of arcs with large length-to-width ratio decreases. That is not the case for model S1F, where the density profile is even steeper than in model S1, causing the creation of many very long and thin arcs.
3.2 Lensing cross sections for long and thin arcs
We now compute absolute lensing cross section of the clusters for long and thin arcs. Arc cross sections for a property are defined as the area in the source plane within which a source has to lie in order to be imaged as an arc with property . We consider here the cross sections for arcs with length-to width ratio larger than three different thresholds, namely:
In particular, the images which satisfy condition are commonly called giant arcs [Wu & Hammer 1993]. We are particularly interested in arcs with large length-to-width ratio because they have been observed in many galaxy clusters, and their statistics has been used in previous studies in an attempt to constrain cosmological parameters (Bartelmann et al. 1998 and references therein).
| Model | ||||
|---|---|---|---|---|
| S1 | ||||
| S1Wa | ||||
| S1Wb | ||||
| S1Wc | ||||
| S1F |
Each cluster model provides six estimates of its strong-lensing cross sections, two for each projection since we performed simulations with two source distributions. We average all measurements in order to obtain the mean cross sections for each cluster model. The lensing cross sections of the five models are listed in Tab. 2. Models S1Wb and S1Wc have vanishing cross sections even for arcs satisfying condition , given that, as shown in Fig. 3, they do not produce arcs with length-to-width ratio larger than .
We find that model S1 has cross sections larger than model S1Wa. In particular, the cross sections and of the first model are more than one order of magnitude larger than those of the second. This feature suggests that a galaxy cluster consisting even of very weakly interacting dark matter should produce at least ten times fewer giant arcs than one made of collisionless particles. Compared to the other models, S1F has very large cross sections, in agreement with the results shown earlier.
As a consequence of the lower curvature in the effective lensing potential, arcs produced by flatter profiles tend to be more strongly magnified. However, the corresponding change in the magnification bias is expected to have a very small effect on the previous results for two reasons. First, such arcs would then be very thick, while the observed ones are generally thin and sometimes unresolved in the radial direction even when observed from space. Second, the magnification bias depends on the colour selection, because the number-count slope does, and unless only very blue or very red objects are selected, the bias is negligible for arcs.
A comparison of the cross sections listed in Tab. 2 for the collisionless simulation (S1) shows that the cluster almost exactly reproduces the average cross section found in the cluster sample used by Bartelmann et al. (1998) for a lens redshift of . In addition, we checked whether different realisations of the same cluster had comparable large-arc cross sections. To do so, we took the cluster mass distributions at different output redshifts (, and ) and computed their lensing properties when placed at a redshift of . For the given cosmological parameters, the linear growth factor changes by less than between redshifts and , so that the effect of cluster growth is unimportant. We find only a modest growth in the large-arc cross sections when using the cluster mass distributions at redshifts and . Between redshift and , however, the cluster undergoes a merger event with a clump of and subsequent relaxation, which increases its central density and therefore also the large-arc cross section. The effect of the merger on the lensing cross section is larger for the collisional than for the collisionless model. The infalling clump increases surface mass density and shear. Since the surface density profile of the collisional cluster is flatter than that of the collisionless cluster, this increase in lensing efficiency affects a larger region in the cluster centre. While the ratio between the large-arc cross sections between the S1 and S1Wa models is roughly an order of magnitude during quiescent periods, it is reduced to approximately five during the merger event. For similar reasons, it is important to mention that the presence of a dominant central galaxy could affect our different models in different ways, being more effective on top of the flatter models. As a consequence, the differences between collisional and collisionless cases could be reduced. A detailed study of this effect is in progress.
Nonetheless, we can conclude (1) that the chosen cluster is typical for clusters in the CDM cosmology, and (2) that the large-arc cross section for the mildly collisional model S1Wa falls substantially below that of the collisionless model S1 for different realisations of the same cluster.
3.3 Radial arcs
In this subsection, we analyse the capability of our models to produce radial arcs. Such arcs have been observed in several galaxy clusters. For instance, two radial arcs exist in the core of MS 0440 [Gioia et al. 1998]. From X-ray observations, the mass of this cluster within was estimated to be , which is similar to that of the cluster we analyse here.
The appearance of radial arcs and their position within the lensing cluster depend on both the slope of the projected mass profile and on the central density of the lens. The surface density must surpass a critical value in order for the radial critical curve to appear where the eigenvalue of the Jacobian matrix is zero. Moreover, the steeper the density profile is, the closer to the centre the radial arcs tend to move [Williams, Navarro & Bartelmann 1999]. The observed location of radial arcs close to the cluster mass centres suggests that the core radii of the host clusters must be quite small [Mellier, Fort & Kneib 1993, Smail et al. 1996, Hammer et al. 1997, Gioia et al. 1998]. Due to the different slopes of the density profiles of the cluster models, we thus expect to find quite large differences in their capacity to form radial arcs (see e.g. Molikawa & Hattori 2000).
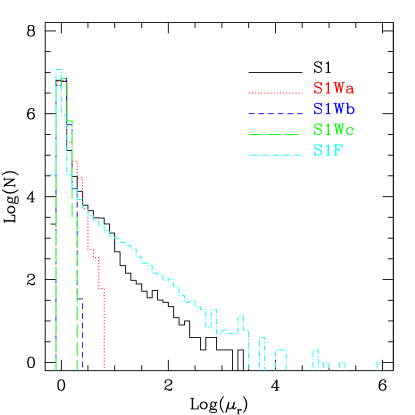
The radial magnification at each point of the lens plane is given by the inverse of the radial eigenvalue of the Jacobian lensing matrix, . From the convergence and the shear, computed as explained in Sect. 2.2, we obtain at each of the grid points of the lens plane. We show in Fig. 4 how these radial magnifications are distributed for the five cluster models. Each histogram combines contributions from all three projections of each cluster. As can be noted, values of exceeding are reached only by models S1 and S1F, while models S1Wa, S1Wb and S1Wc can only produce weak radial distortions.
Using the tangential and radial eigenvalues of the Jacobian matrix, we can also identify the radial arcs from the complete sample of distorted images, and this enables us to compute the lensing cross sections for radial arcs. For their automatic detection, we assumed that radial arcs must lie on the radial critical curve or very close to it. Therefore, we searched those images containing at least one pixel for which the radial eigenvalue is and the tangential eigenvalue is . These values were chosen in order to avoid misclassifications of radial arcs.
The cross sections for radial arcs, , averaged over the six simulations performed for each cluster, are listed in the fifth column of Table 2. We found that only models S1 and S1F are able to produce radial arcs, while the W-models are not. The results for model S1Wa are particularly interesting because this cluster seems to have a sufficiently high surface density to produce giant arcs, but not enough to radially distort the background galaxies.
3.4 Rescaling the clusters
Our results show that models S1Wb and S1Wc cannot produce long and thin arcs at all. Although the mass of these clusters is already fairly large, we have checked whether an even more massive cluster with density profile similar to that of S1Wb could efficiently form this kind of arcs. To this end, we rescaled the cluster mass by a variable factor .
The virial radius of a halo scales as , where is the virial mass of the halo. To obtain a halo of mass which is dynamically stable, we also need to rescale distances by a factor . This means that, while the three-dimensional density remains fixed, the halo surface density is enhanced by a factor . For this reason we expect that, increasing its mass, cluster S1Wb will eventually become able to produce strong lensing effects.
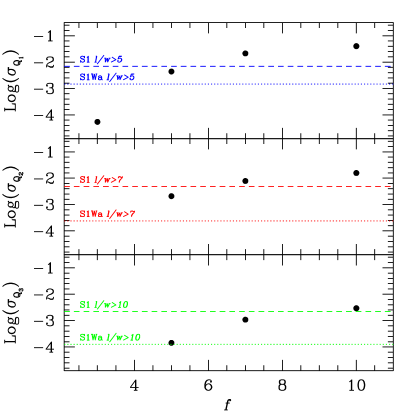
We therefore perform a new set of lensing simulations, choosing mass scaling factors equal to 3, 5, 7, and 10. We plot in Fig. 5 the cross sections of these rescaled clusters, as a function of the rescaling factor . In this plot, upper, middle and lower panels refer to the lensing cross section for length-to-width ratios larger than 5, 7, and 10, respectively. The dashed and dotted horizontal lines correspond to the equivalent cross sections for models S1 and S1Wa.
We can infer from this figure that a cluster with the same density profile as our model S1Wb must have a mass of at least () times larger than the mass of our present cluster, in order to achieve the same strong lensing efficiency of model S1 (S1Wa).
In the same spirit, we also rescale the mass of cluster S1Wa, to determine when it starts producing radial arcs. We multiply the cluster mass by a factor of two and found that only one out of three projections of the rescaled cluster was efficient in forming radial arcs. However, the cross section of the rescaled cluster, , is still one order of magnitude lower than that of model S1. Finally let us comment that our method to rescale the clusters is approximate. In fact, rescaling the mass should in principle affect the collision rate. Yoshida et al. (2000b) estimated the number of collisions between dark matter particles per Hubble time as , where is the three-dimensional density and is the particle velocity. Since , the number of collisions would increase by a factor when the cluster mass is rescaled by a factor . Since our rescaling technique keeps constant while the cluster mass is increased by a factor , the result practically corresponds to an effective reduced by a factor . This means that we are even over-estimating the lensing efficiency of the -scaled clusters and our previous conclusions can be considered conservative.
4 Summary and Conclusions
Self-interacting dark matter was suggested as a solution to the problems (1) that dwarf galaxies are observed to have flat cores, while they should have density cusps according to -body simulations, and (2) that simulations tend to produce more substructure in galaxies than there seems to be. In essence, the dark-matter self-interaction flattens density cusps, increases radial symmetry, and damps substructure; all of which are ‘desired’ effects.
However, it was shown before that asymmetries, steep density profiles, and existence of substructures are essential for the ability of galaxy clusters to produce pronounced strong-lensing features like large arcs. This is due to several reasons. First, lenses need to exceed the critical surface mass density in order to form critical curves, which are mandatory for large arcs. Second, asymmetries in lenses increase the gravitational tidal field, or shear, which helps to make them critical for multiple imaging. Asymmetric clusters can be critical at lower surface mass densities than symmetric clusters. Third, observed arcs are generally thin, i.e. little magnified or even demagnified in the radial direction. For this to be the case, the surface mass density needs to be lower than about half the critical surface density at the location of the arcs. Together with the requirement that the surface density be supercritical in lens centres, this implies that density profiles have to be steep.
In other words, the introduction of self-interaction between dark-matter particles is expected to have a pronounced, potentially ‘undesirable’ impact on the ability of clusters to produce large arcs: it is exactly the desired effect of the self-interaction, namely to make clusters flatter, rounder, and smoother, that on the other hand threatens to destroy their strong-lensing capabilities. In this paper, we have investigated this effect on the second-most massive cluster in a cosmological CDM simulation, and produced the following results:
-
•
The introduction of self-interaction even with a small cross section of reduces the cluster cross section for the production of large arcs by about an order of magnitude compared to the collisionless case.
-
•
Upon further increase of the interaction cross section, the cluster becomes entirely uncritical and cannot produce arcs any more, despite the otherwise favourable conditions in terms of cluster mass and redshift.
-
•
The cross section for radial arcs vanishes even for the smallest interaction cross section considered.
-
•
The cluster with an interaction cross section of would require about five times more mass to reach the cross section for large tangential arcs of the cluster with , and about times more mass to restore the cross section of the collisionless cluster. Due to the steepness of the cluster mass function, the spatial number density of such clusters at the redshift considered is more than six orders of magnitude smaller than that of the original cluster.
-
•
The strong-lensing cross section of the cluster model investigated here is almost identical to the average cross section found in a sample of clusters simulated earlier in the CDM cosmology (Bartelmann et al. 1998). Also, the cross sections obtained do not change significantly when the cluster model is taken at different output times and placed at the original lens redshift of .
At a length-to-width ratio of , the abundance of observed arcs brighter than is per cluster with X-ray luminosity . Extrapolated to the whole sky, there should be such arcs. Numerically simulated clusters in a (cluster-normalised) CDM model fall short by about an order of magnitude of producing this number of arcs (Bartelmann et al. 1998). It may be possible that massive central cluster galaxies can increase the arc optical depth of CDM clusters sufficiently to reconcile it with observations (Williams et al. 1999). However, a further reduction of the strong-lensing cross section by an order of magnitude due to even mild dark-matter interaction seems problematic in view of the observed arc abundance.
Although the inability to produce radial arcs of the clusters with interacting dark matter is a potentially important piece of information, it is currently impossible to draw any firm conclusions from comparisons with data. Radial arcs have so far been reported in five galaxy clusters (MS 2137, Fort et al. 1992; A 370, Smail et al. 1996; MS 0440, Gioia et al. 1998; AC 114, Natarajan et al. 1998; A 383, Smith et al. 2000), all of which are located near bright galaxies in the cluster centre. It is currently unclear what exactly the influence of the galaxies on the occurrence of the radial arc is, and how the presence of luminous galaxies near cluster centres prevents the detection of more radial arcs. A statistical comparison of predicted and observed radial-arc numbers therefore appears premature. In principle, the ratio of the clustercentric distances of radial and tangential arcs could be used to constrain the cluster density profile, but in practice at least redshift estimates of the arc sources would have to be available.
Of course, our simulations are insufficient for statistically sound statements on the total arc cross section of a given cluster population. However, given the massive impact of dark-matter interaction even with the smallest cross section considered, we conclude that the dark-matter self-interaction hypothesis may be in severe conflict with the abundance of large arcs unless the interaction cross section is very small.
Acknowledgements
This work was partially supported by Italian MURST, CNR, CNAA and ASI, and by the TMR european network “The Formation and Evolution of Galaxies” under contract ERBFMRX-CT96-086. MM, LM and GT thank the Max-Planck-Institut für Astrophysik, and MB the Dipartimento di Astronomia di Università di Padova, for their hospitality during the visits when this work was completed. We are grateful to the anonymous referee for comments which allowed us to improve the presentation of the results.
References
- [Bartelmann et al. 1998] Bartelmann M., Huss A., Colberg J.M., Jenkins A., Pearce F.R., 1998, A&A, 330, 1
- [Bartelmann et al. 1995] Bartelmann M., Steinmetz M., Weiss A., 1995, A&A, 297, 1
- [Bartelmann & Weiss 1994] Bartelmann M., Weiss A., 1994, A&A, 298, 1
- [Burkert 2000] Burkert A., 2000, ApJ, 534, L134
- [Davé et al. 2001] Davé R., Spergel D.N., Steinhardt P.J., Wandelt B.D., 2001, ApJ, 547, 574
- [Firmani et al. 2000] Firmani C., D’Onghia E., Avila-Reese V., Chincarini G., Hernández X., 2000, MNRAS, 315, L29
- [Firmani et al. 2001] Firmani C., D’Onghia E., Chincarini G., Hernández X., Avila-Reese V., 2001, MNRAS, 321, 713
- [Flores & Primack 1994] Flores R.A., Primack J.A., 1994, ApJ, 427, L1
- [Fort et al. 1992] Fort B., Le Fèvre O., Hammer F., Cailloux M., 1992, ApJ, 399, L125
- [Gioia et al. 1998] Gioia I.M., Shaya E.J., Le Fèvre O., Falco E.E., Luppino G.A., Hammer F., 1998, ApJ, 497, 573
- [Hammer 1991] Hammer F., 1991, ApJ, 383, 66
- [Hammer et al. 1997] Hammer F., Gioia I.M., Shaya E.J., Teyssandier P., Le Fèvre O., Luppino G.A., 1997, ApJ, 491, 477
- [Hockney & Eastwood 1988] Hockney R.W., Eastwood J.W., 1988, Computer simulations using particles. Hilger, Bristol
- [Kauffmann et al. 1999] Kauffmann G., Colberg J.M., Diaferio A., White S.D.M., 1999, MNRAS, 303, 188
- [Klypin et al. 1999] Klypin A., Kravtsov A.V., Valenzuela O., Prada F., 1999, ApJ, 522, 82
- [Kochanek & White 2000] Kochanek C.S., White M., 2000, ApJ, 543, 514
- [Kovner 1989] Kovner I., 1989, ApJ, 337, 621
- [Mellier, Fort & Kneib 1993] Mellier Y., Fort B., Kneib J.P., 1993, ApJ, 407, 33
- [Meneghetti et al. 2000] Meneghetti M., Bolzonella M., Bartelmann M., Moscardini L., Tormen G., 2000, MNRAS, 314, 338
- [Miralda-Escudé 2000] Miralda-Escudé J., 2000, preprint, astro-ph/0002050
- [Molikawa & Hattori 2000] Molikawa K., Hattori M., 2000, preprint, astro-ph/0009343
- [Moore 1994] Moore B., 1994, Nat, 370, 629
- [Moore et al. 2000] Moore B., Gelato S., Jenkins A., Pearce F.R., Quilis V., 2000, ApJ, 535, L21
- [Moore et al. 1999a] Moore B., Ghigna S., Governato F., Lake G., Quinn T., Stadel J., Tozzi P., 1999a, ApJ, 524, L19
- [Moore et al. 1999b] Moore B., Quinn T., Governato F., Stadel J., Lake G., 1999b, MNRAS, 310, 1147
- [Narayan & Bartelmann 1997] Narayan R., Bartelmann M., 1997, in Dekel A., Ostriker J.P., eds, Formation of Structure in the Universe. Cambridge Univ. Press, Cambridge, p. 360
- [Natarajan et al. 1998] Natarajan P., Kneib J.P., Smail I., Ellis R.S., 1998, ApJ, 499, 600
- [Navarro et al. 1997] Navarro J.F., Frenk C.S., White S.D.M., 1997, ApJ, 490, 493
- [Schneider, Ehlers & Falco 1992] Schneider P., Ehlers E.E., Falco E., 1992, Gravitational Lenses. Springer Verlag, Berlin
- [Smail et al. 1996] Smail I., Dressler A., Kneib J.P., Ellis R.S., Couch W.J., Sharples R.M., Oemler Jr. A., 1996, ApJ, 469, 508
- [Smith et al. 2000] Smith G.P., Kneib J.P., Ebeling H., Czoske O., Smail I., 2000, preprint, astro-ph/0008315
- [Spergel & Steinhardt 2000] Spergel D.N., Steinhardt P.J., 2000, PRL, 84, 3760
- [Springel, Yoshida, & White 2000] Springel V., Yoshida N., White S.D.M., 2000, preprint, astro-ph/0003162
- [Tyson, Kochanski & dell’Antonio 1998] Tyson J.A., Kochanski G.P., dell’Antonio I.P., 1998, ApJ, 498, L107
- [Williams, Navarro & Bartelmann 1999] Williams L.L.R., Navarro J.F., Bartelmann M., 1999, ApJ, 527, 535
- [Wu & Hammer 1993] Wu X.P., Hammer F., 1993, MNRAS, 262, 187
- [Wyithe et al. 2000] Wyithe J.S.B., Turner E.L., Spergel D.N., 2000, preprint, astro-ph/0007354
- [Yoshida et al. 2000a] Yoshida N., Springel V., White S.D.M., Tormen G., 2000a, ApJ, 535, L103
- [Yoshida et al. 2000b] Yoshida N., Springel V., White S.D.M., Tormen G., 2000b, ApJ, 544, L87