Evidence for Galaxy Formation at High Redshift
Abstract
Metcalfe et al. (1995, 1996) have shown that galaxy counts from the UV to the near-IR are well-fitted by simple evolutionary models where the space density of galaxies remains constant with look-back time while the star-formation rate rises exponentially. We now extend these results, first by using data from the Herschel Deep Field to show that these same models give detailed fits to the faint galaxy colour-colour diagram. We then use these models to predict the number counts of high redshift galaxies detected by the Lyman break technique. At there is almost exact agreement between our prediction and the data, suggesting that the space density of galaxies at may be close to its local value. At the space density of bright galaxies remains unchanged; however, the space density of dwarf galaxies is significantly lower than it is locally, suggesting that we have detected an epoch of dwarf galaxy formation at . Finally, significant numbers of Lyman-break galaxy candidates are also detected at in the Hubble and Herschel Deep Fields; taking this observation together with a number of recent detections of spectroscopically confirmed galaxies suggests that the space density of bright galaxies at remains comparable to the local space density and thus that the epoch of formation of bright galaxies may lie at yet higher redshift.
Physics Department, Durham University, Science Laboratories, South Road, Durham DH1 3LE, UK
LAS, Traverse du Siphon, Les Trois Lucs, F-13102 Marseille, France
Instituto de Matematicas y Fisica Fundamental, CSIC, Spain
California Institute of Technology, MS 320-47, Pasadena, CA 91125, USA
1. Introduction
The epoch of galaxy formation has been the subject of much recent controversy. Initially, observational evidence for a late epoch of galaxy formation appeared to come from analysis of the Canada-France Redshift Survey and the Hubble Deep Field where the universal star-formation rate (SFR) appeared to peak at (Lilly et al. 1995, Madau et al. 1996). However, it was also suggested that the CFRS/HDF data could still be consistent with models (Bruzual & Charlot 1993) with a constant space density of galaxies whose SFR rises exponentially to redshifts (Metcalfe et al. 1996, Shanks et al. 1998). Indeed, if these ‘pure luminosity evolution’ models are modified by assuming a small amount of dust internal to spirals and a dwarf-dominated IMF for early-type galaxies, then they appeared to give very good fits to galaxy number count data from the UV to the near-infrared, at least in the case of low (Metcalfe et al. 1996). The recent detection of high redshift galaxies as sub-mm sources (Smail et al. 1997, Hughes et al. 1998, Barger et al. 1998) also appears to support the idea that the SFR may rise to much higher redshifts. The ‘pure luminosity evolution’ models with internal spiral dust absorption have also been shown to be capable of producing fits to the sub-mm galaxy counts and the optical/near-IR galaxy counts simultaneously (Busswell & Shanks 2000). Details of further constraints from the UV colours of galaxies on the dust extinction law and its evolution with redshift are given by Metcalfe et al. (2000).
In the Einstein-de Sitter Universe, with its smaller volume, it has been known for some time that such simple models only fit the optical counts to B25mag (Yoshii & Takahara 1988, Guiderdoni & Rocca-Volmerange 1990, Koo et al. 1993) before underestimating the counts at fainter magnitudes. In this case, a new population of faint galaxies must be postulated; these extra galaxies could be the result of a process of dynamical merging at high redshift (Kauffmann & Charlot 1998). Alternatively, as we assume here, they could be due to a population of ‘disappearing dwarfs’, denoted ‘dE’, that are luminous at high redshift but then dim dramatically to be virtually undetectable at low redshift (Babul & Rees 1992, Metcalfe et al. 1996, 2000)

2. Galaxy Counts and Colours
We now test how well these models fit new ultra-deep optical and IR count data from HDF-N (Williams et al. 1996, Thompson et al. 1999), HDF-S (Gardner et al. 2000, Williams et al. 2000) and the William Herschel Deep Field (WHDF). Full details of our analyses of the Hubble and Herschel Deep Fields are given elsewhere (Metcalfe et al. 1995, 1996, 2000). The new optical () counts from HST STIS observations in the HDF-S are shown in the lower part of Fig. 1. The STIS passband is centred at 5850Å and has a width of 4000Å. The field-of-view is 5050 arcsec2. The exposure time was 43hrs and these are the deepest optical galaxy counts, reaching beyond RAB=30. Also shown are the HDF-N,-S WFPC-2 R counts. Above these in Fig. 1 are the new H-band counts from NICMOS observations in HDF-N,-S. The field-of-view was 5050 arcsec2. The exposure time was 36.5hrs for HDF-N and 48.3hrs for HDF-S and these are the deepest galaxy counts in the near-IR so far produced. Fig. 1 also shows the WHDF H counts from Calar Alto 3.5-m observations plus H counts from other authors. The models shown are those of Metcalfe et al. (1996, 2000) applied to both passbands. The no-evolution models generally underestimate the optical data. The q0=0.05 and =0.7 evolutionary models give excellent fits to the faintest limit of the HST STIS R counts. The q0=0.5 dE dwarfs model includes the ‘disappearing dwarf’ galaxy population previously invoked to improve the galaxy count fit of the q0=0.5 evolutionary model (Metcalfe et al. 1996) and this model also remains consistent with the new, fainter data. This model slightly overestimates the faintest counts at and , possibly indicating a slightly smaller contribution from the dE population than assumed here (Metcalfe et al., 1996). Nevertheless, we also regard this model as remaining in reasonable agreement with the ultra-deep galaxy counts data. At H, where the non-evolving models lie closer to the data than in the optical, all the evolving models except the q0=0.5 models without the dE component, provide a reasonable fit to the counts to the faintest limit of the HST NICMOS data. We conclude that the predictions for the evolutionary models continue to agree with the data to these new, very deep completeness limits of =30 and .

Beyond and we are looking down the luminosity function of galaxies and seeing intrinsically faint galaxies(M-12), which on consideration of their colours are mostly at (Metcalfe et al. 1996, 2000). Thus intrinsically faint galaxies at relatively low redshifts dominate the galaxy number counts at the faintest limits. In the low q0 case, the excellent fit of the evolutionary models suggests that the slope of the faint galaxy luminosity function at 2 may be consistent with that measured locally. The need for the extra dwarf population to fit the optical counts in the =0.5 case suggests that here the luminosity function slope must steepen by to match the faint count data.
Finally, we compare the model predictions for the colour-colour diagrams with the data from the WHDF. Fig. 2 shows how the predictions show a distinctive plume of early-type galaxies which first rise from to redder colours before turning bluewards again, as the increasing SFR at high redshift begins to affect the redshifted UV light. In the case of the spirals a horseshoe-shaped curve is predicted reaching out to at its faint limit. The agreement between models and data in both cases is quite remarkable, suggesting that for all their simplicity these models share the essential qualities required by the data; for example, the faint galaxies seem to divide into just two evolutionary classes corresponding to early and late types as we assume. And the parameter differentiating the evolution in each class appears to be the star-formation rate, with an exponential e-folding time of Gyr for early-types and Gyr for spirals.
3. ‘Drop-out’ galaxies
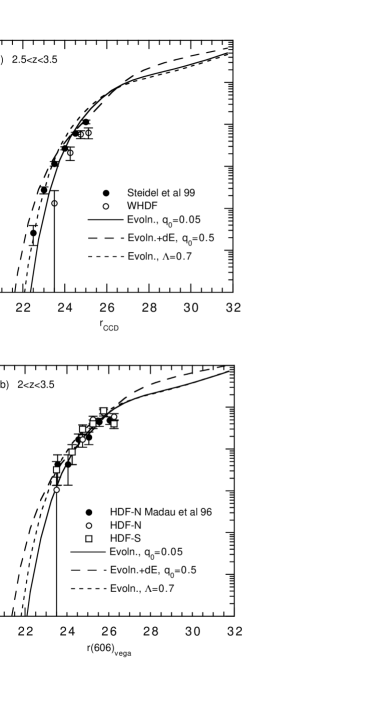
We now use these models to predict the number counts of galaxies detected by the Lyman break technique (Steidel et al. 1999) at . We first consider the range, where the data comes from detecting the Lyman break galaxies via the UV dropout technique in ground-based data (Steidel et al. 1999, Metcalfe et al. 2000) and at fainter limits from the Hubble Deep Fields N,S (Madau et al. 1996, Metcalfe et al. 2000). In Fig. 3a, we then simply compare the observed ground-based number counts of the galaxies with the model predictions, with the same comparison for the HST-based data being shown in Fig. 3b. We see that in both cases at there is excellent agreement between the three basic evolutionary models and the data. Thus models which were last adjusted to fit the Keck B24 n(z) at are now found to give a strikingly good fit to what is effectively the galaxy luminosity function at . Since it is the spirals which dominate the bright part of the model luminosity functions at z=3, this means that the Lyman break galaxies might be identified with the bright end of the evolved spiral luminosity function. This result is consistent with the flat SFR:z relation between found by Steidel et al. (1999) and the slightly rising SFR:z relation predicted by the models in this range (Metcalfe et al. 2000); the models predict only a small amount of evolutionary brightening in the range and the constant space density of spiral galaxies then ensures the SFR:z relation remains fairly flat. In the fainter, HST-based data in Fig. 3b, the models continue to fit well. However, it should be noted that the q0=0.5 model relies on the contribution of the ‘disappearing dwarfs’ to maintain agreement with the faint count data; it can be seen that, without this dE contribution, the q0=0.5 model would start to underestimate the counts.
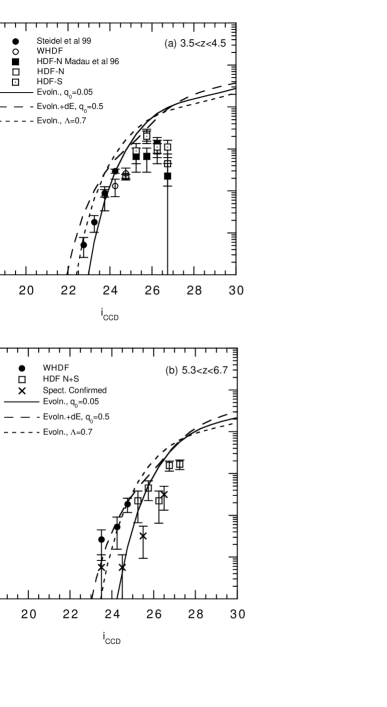
In Fig. 4a we now compare the number count of Lyman break galaxies detected by B dropout to the same models. At bright magnitudes, where the data comes mainly from Steidel et al. (1999), the models appear to fit the data well, suggesting that the bright spirals may have been in place even as early as . However, at fainter magnitudes where the data comes from the HDF-N,-S and the WHDF, the simple pure luminosity evolution models at last appear to be breaking down, with the models generally overestimating the faint galaxy luminosity function. The observed faint () galaxy count falls below our predictions by a factor of 5, indicating that while bright L∗ galaxies may have been in place at , the faint galaxy population may have formed in the range . Steidel et al. (1999) also noted that the galaxy luminosity function at appeared flatter than at but speculated that this may be due to the HDF-N being an unrepresentative field. The fact that the same result is seen in the WHDF and HDF-S argues that this result may be real. The result also explains why the SFR density of Steidel et al. (1999) appears to be constant between when measured from bright ground-based data, but appears to fall at when measured from the fainter HDF data.
In Fig. 4b we extend this approach, now comparing the number counts of Lyman break galaxies detected by R dropout in the HDF and WHDF to the same models. We have taken galaxies with and in the WHDF and (F606-F814)2.44 in the HDF-N,-S to define consistently the redshift range 5.3z6.7 or as suggested by the models. Again we see that the observed number density of bright WHDF galaxies is well fitted by the models. The fainter galaxies from the HDF remain a factor of 5 lower than predicted. Since the HDF data probes less deeply into the galaxy luminosity function than at , this is consistent with a further decrease in the number of faint galaxies relative to the local density. The crosses in Fig. 4b show the number counts we have compiled from 6 galaxies with Keck or HST spectroscopy (Dey et al. 1998, Weymann et al. 1998, Spinrad et al. 1998, Chen et al. 1998). It can be seen that although there is reasonable agreement at the faint end with our unconfirmed HDF-N,-S R dropout candidates, at the bright end there are somewhat fewer galaxies detected. This disagreement may be partly due to the difficulty of detecting Ly emission against an increasingly bright sky at these longer wavelengths and partly due to contamination of our WHDF candidates by lower redshift early-type galaxies. However, the fact that a population of spectroscopically confirmed galaxies have already been identified and that even larger numbers of R dropout candidates exist, again suggests that significant numbers of bright galaxies had formed by , pushing the epoch of formation of giant galaxies back to even higher redshifts.
4. Conclusions
Thus the picture of galaxy formation which is suggested is that bright galaxies form first at and then faint galaxies form later at . This is similar to the ‘downsizing’ scenario suggested in other data at (Cowie et al. 1997) and may possibly be connected to claims of evolving, faint luminosity function slopes at even lower redshifts (Brinchmann et al. 1998). This scenario is unexpected in hierarchical galaxy formation theories where dwarf galaxies are expected to form earlier than giant galaxies. In a CDM model with feedback, this order may be reversed with supernovae winds blowing gas out of dwarf galaxies preferentially because of their shallower gravitational potentials. However, suppression of star formation at is usually required in such models to produce the observed luminosity function at the present day (Brinchmann et al. 1998); it thus remains to be seen how well a CDM model will deal with the large numbers of luminous galaxies detected between . New observations of the galaxy luminosity function at even higher redshifts are now required to determine the redshift of formation of the brightest galaxies.
Acknowledgments
We gratefully acknowledge G. Bruzual and S. Charlot for use of their isochrone synthesis code. We also acknowledge the use of the Hubble Space Telescope Deep Field data. We further acknowledge use of the Calar Alto 3.5-m telescope and the Camera. The WHT is operated on the island of La Palma by the Isaac Newton Group at the Spanish Observatorio del Roque de los Muchachos of the Instituto de Astrofisica de Canarias. H.J. McCracken and N. Metcalfe acknowledge PPARC funding.
References
Babul, A., Rees & M.J., 1992, MNRAS, 255, 346
Barger, A.J., Cowie, L.L., Sanders, D.B., Fulton, E., Taniguchi, Y., Sato, Y., Kawara, K. & Okuda, H., 1998, Nature, 394, 248
Brinchmann, J., Abraham, R., Schade, D., Tresse, L., Ellis, R.S., Lilly, S., Le Fevre, O., Glazebrook, K., Hammer, F., Colless, M., Crampton, D. & Broadhurst, T., 1998, ApJ, 499, 112
Bruzual, G. & Charlot, S., 1993, ApJ, 405, 538
Busswell, G.S. & Shanks, T., 2000, MNRAS, in press, astro-ph/0002081
Chen, H.W., Lanzetta, K.M. & Pascarelle, S., 1998, Nature, 398, 586
Cole, S., 1991, ApJ, 367, 45
Cowie, L.L., Hu, E.M., Songaila, A. & Egami, E., 1997, ApJ, 481, L9
Dey, A., Spinrad, H., Stern, D., Graham, J.R. & Chaffee, F.H., 1998, ApJ, 498, L93
Gardner, J.P. et al., 2000, AJ, 119, 486
Guiderdoni, B. & Rocca-Volmerange, B., 1990, A&A, 227, 362
Hughes, D.H. et al., 1998, Nature, 394, 241
Kauffmann, G. & Charlot, S., 1998, MNRAS, 297, L23
Koo, D.C., Gronwall, C. & Bruzual G.A., 1993, ApJ, 415, L21
Lilly, S.J., Tresse, L., Hammer, F., Crampton, D. & Le Fevre, O., 1995, ApJ, 455, 108
Madau, P., Ferguson, H., Dickinson, M., Giavillisco, M., Steidel, C. & Fruchter, A., 1996, MNRAS 283, 1388
Metcalfe, N., Shanks, T., Fong, R. & Roche, N., 1995, MNRAS, 273, 257.
Metcalfe, N., Shanks, T., Campos, A., Fong, R. & Gardner, J.P., 1996, Nature, 383, 236
Metcalfe, N., Shanks, T., Campos, A., McCracken, H.J. & Fong, R., 2000, MNRAS in press, astro-ph/0010153.
Shanks, T., Metcalfe, N. , Fong, R., McCracken, H.J., Campos, A. & Gardner, J.P. , 1998. In ‘The Young Universe: Galaxy Formation and Evolution at Intermediate and High Redshift’, eds. D’Odorico, S., Fontana, A. and Giallongo, E., ASP Conference Series Vol. 146, San Francisco:ASP, pp. 102-109.
Smail, I., Ivison, R.J. & Blain, A.W., 1997, ApJ, 450, L5
Spinrad, H., Daniel, S., Bunker, A., Dey, A., Lanzetta, K., Yahil, A., Pascarelle, S. & Fernandez-Soto, A., 1998, AJ, 116, 2617
Steidel, C.C., Adelberger, K.L., Giavalisco, M., Dickinson, M. & Pettini, M., 1999, ApJ, 519, 1
Teplitz, H.I., Gardner, J.P., Malumuth, E.M. & Heap, S.R., 1998, ApJ, 507, L17
Thompson, R.I., Storrie-Lombardi, L.J., Weymann, R.J., Rieke, M.J., Schneider, G., Stobie, E. & Lytle, D., 1999, AJ, 117, 17
Weymann, R.J., Stern, D., Bunker, A., Spinrad, H., Chaffee, F.H., Thompson, R.I. & Storrie-Lombardi, L.J., 1998, ApJ, 505, L95
Williams, R.E. et al., 1996, ApJ, 112, 1335
Williams, R.E. et al., 2000, ApJ, submitted
Yan, L., McCarthy, P.J., Storrie-Lombardi, L.J. & Weymann, R.J., 1998, ApJ, 503, L19
Yoshii, Y. & Takahara, F., 1988, ApJ, 326, 1