The History of Starburst Galaxies 11institutetext: Institute of Astronomy, Madingley Road, Cambridge, CB3 0HA, UK
The History of Starburst Galaxies
Abstract
Dusty galaxies with luminosities in excess of L⊙ have been detected out to redshifts by the Infrared Space Observatory (ISO), and to higher redshifts using millimetre(mm)- and submm-wave cameras on ground-based telescopes. The integrated properties of these more distant galaxies are also constrained by measurements of the intensity of the submm-wave background radiation. While it is generally unclear whether their energy is released by gravitational accretion or by star formation, circumstantial evidence favours star formation. Unless these high-redshift galaxies are extremely massive, which is not expected from standard models of galaxy evolution, this luminosity cannot be sustained for more than a fraction of a Hubble time, and so they are undergoing some sort of ‘bursting’ behaviour. The interpretation and analysis of this population is discussed, and the key observations for deriving a robust history of their evolution, which is likely to be the history of starburst activity, are highlighted.
1 The Evolution of Luminous Dusty Galaxies
From observations of low-redshift dusty galaxies using the IRAS satellite SandN close to the peak of their restframe spectral energy distributions (SEDs), it is known that a similar amount of energy in the local Universe is produced by stars in dust-enshrouded and dust-free environments. The comoving luminosity density of dusty galaxies is also known to evolve strongly, from the slope of the faint counts of IRAS galaxies at 60 m Bertin , which provide information to . ISO observations at both shorter Elbaz and longer Juvela wavelengths confirm that strong evolution continues to .
At longer wavelengths, the redshifted emission from very luminous, high-redshift dusty galaxies can be detected in the mm and submm wavebands. Independent surveys made using the 450/850-m SCUBA camera at the JCMT Smail_catalogue have determined the counts of high-redshift dusty galaxies. 1.2-mm surveys using the MAMBO detector array at the IRAM 30-m telescope Carilli have detected a similar population of galaxies. In three cases, the detection of CO emission from gas located at the position and redshift of a suspected optical identification (at , 2.55 and 2.80) Frayer provides absolute confirmation of the identification. Extremely deep VLA radio images of the survey fields can be used to impose constraints on the redshifts and SEDs of the detected galaxies CandY ; SIOBK . It is likely that the detected galaxies are at , and there are very few plausible low-redshift () counterparts. The counts and redshift distributions of these distant dusty galaxies can be used to constrain models of galaxy evolution at high redshifts.
In addition to the detection of individual submm-selected galaxies, the background radiation intensity in the mm and submm wavebands Fixsen traces the integrated emission from the entire population of dusty high-redshift galaxies. The mm/submm-wave background spectrum has the form , and there is no clear spectral break down to 2000 m. The lack of a break to a steeper slope supports the idea that high-redshift galaxies with redshifted SEDs peaking at about 1000 m are still contributing to the background intensity, indicating a high maximum redshift of the population of about 10. If the shape of the SED is assumed not to evolve significantly, then the luminosity density must evolve as BL93b ; BJ for in order to generate this background spectrum, a result which is independent of cosmology. Such a gently declining high-redshift luminosity density is naturally consistent with the incomplete redshift distributions of galaxies detected in mm/submm-wave surveys.
Note that any model of the evolution of dusty galaxies must predict the redshift distribution of submm-detected galaxies correctly. Submm-wave surveys are very sensitive to high-redshift galaxies BL93a , and it is easy to propose models that fit both the observed submm-wave counts and background radiation spectrum at the expense of a redshift distribution that is biased far too high. The verification of predicted redshift distributions is therefore a crucial test of such models.
In this paper, the forms of evolution of galaxies that were previously derived in the context of far-infrared(IR) and submm-wave data are updated to take account of the much greater amount of information that has become available, particularly from ISO surveys. The results are similar to, but less uncertain than, those derived earlier BSIK ; BJ . The results have also been updated to include the currently favoured cosmological parameters , and km s-1 Mpc-1 are assumed.
2 Constraining the Evolution of Dusty Galaxies
A Baseline at Low Redshifts
The luminosity function of IRAS galaxies is best constrained at 60 m Saunders ; and information about the same population of galaxies is also available at 100 m SandN . These wavelengths are close to the peak of the SED of a nearby () dusty galaxy for any reasonable dust temperature. The ratio of the bright counts at 60 and 100 m imply a luminosity-averaged dust temperature –45 K. 850-m observations of galaxies detected by IRAS Dunne , with a long wavelength baseline to provide an excellent probe of the SED, indicate that K and the Rayleigh–Jeans spectral index is . The population of low-redshift dusty galaxies can be divided into relatively short-lived warm interacting/starbursting galaxies and long-lived cooler quiescent galaxies BandB ; BJ ; however, the details of this distinction are relatively unimportant for studies of high-redshift galaxy evolution. Any low-luminosity, low-temperature dusty galaxies missing from existing surveys do not contribute significantly to the luminosity density, even at low and moderate redshifts.
The form of evolution of the baseline low-redshift far-IR luminosity function must be dominated by pure luminosity evolution, that is , to ensure that the submm galaxy counts and the background radiation intensity are both predicted correctly. Number density evolution is certainly also likely to be involved, but must be dominated by luminosity evolution BSIK . The evolution function is determined by demanding that the background radiation intensity, counts and redshift distributions of dusty galaxies are all in agreement with observations. These observations are, in order of increasing redshift, the faintest counts and redshift distributions of 60-m IRAS galaxies, deep 90- and 170-m counts from ISO, the spectrum of background radiation from COBE, and the faint counts and limited redshift information of distant galaxies detected using SCUBA at 450 and 850 m and MAMBO at 1.25 mm.
Several approaches can be taken to investigate the evolution. The simplest is to assume a form for , which implicitly includes details of all the physical processes taking place in galaxies, but is fitted to the data without investigating the processes in detail BSIK . This has the advantage of requiring few parameters to model the galaxy SED and the form of evolution, in fact fewer than the number of constraining pieces of data. Well-motivated additions of greater complexity can thus be introduced to the models as the observations improve, without invoking parameters too numerous to constrain reliably and uniquely. A more physically motivated approach connects the evolving mass function of galaxies to the associated luminosity function using a prescription for both star formation and the fueling of active galactic nuclei (AGN) Cole ; Guid ; SPF ; however, care must be taken to avoid getting lost in the space of free parameters. Without an additional population of short-lived, very luminous galaxies, standard semi-analytical models, which include star formation in the gas that cools in galaxy disks, fail to account for the observed surface density of SCUBA and MAMBO sources BJ .
Describing Evolution with a Simple Luminosity Function
The first results derived using this approach BSIK followed rapidly behind the first results of SCUBA surveys SIB . A low-redshift 60-m luminosity function was assumed Saunders , an SED was defined by a dust temperature , and a form of low-redshift evolution was included. and were determined by requiring that the form of the 60-m IRAS counts and the early results of deep 175-m ISO surveys were reproduced; K and were required BSIK . As discussed above, this temperature is consistent with subsequent SCUBA measurements of dust temperatures for IRAS galaxies Dunne , while matched the value inferred from optical surveys Lilly , rather than the value of that is often assumed to describe the evolution of galaxies in the far-IR waveband. Note that is derived from 15-m ISO surveys, taking into account the complex restframe SED of a dusty galaxy between 5 and 10 m Xu .
It is now possible to use the much more extensive data from 90- and 175-m ISO counts Juvela , and a more popular non-zero- cosmology to revisit the results. There are no substantial changes; formally K and are the latest results, if a Rayleigh–Jeans spectral index of 3.5 is assumed.
The form of evolution at higher redshifts, too distant for ISO observations, is constrained by the background radiation intensity Fixsen and the counts of SCUBA galaxies. From 2002, mid-IR SIRTF observations should make a major impact in this area. Constraints from the background and SCUBA data are rather degenerate, although even the first SCUBA data in 1997 SIB provided the tighter constraint: see BSIK , in which various models of high-redshift evolution were considered. The so-called Gaussian model, in which is represented by a Gaussian in cosmic epoch, provided the best description of the redshift distribution of SCUBA galaxies. The more accurate 175- and 850-m counts now available provide some additional information, and are useful for updating the results. Progress has also been made in developing a more appropriate form of , which is fully compatible with models of cosmic chemical evolution, and naturally includes a peak in the evolution function Jameson ; L2000 :
| (1) |
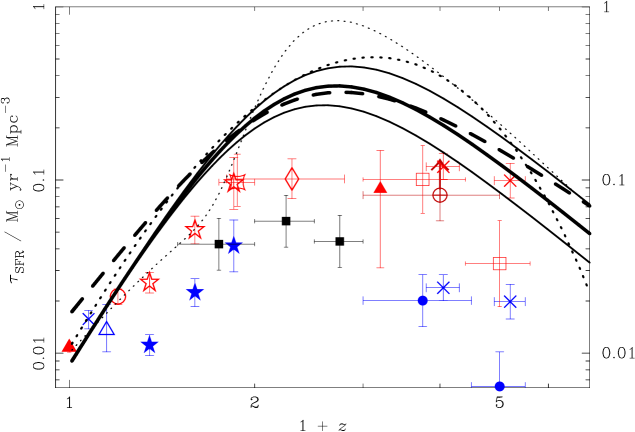
At low redshifts . Using all available observational data, the results and are obtained; see the solid line in Fig. 1. These results are similar to those derived earlier BSIK , but take account of revised cosmological parameters and tighter error bars on some of the constraining data. The model described above is consistent with all the observed background radiation, counts and redshift distributions of galaxies at wavelengths longer than 60 m. The dominant source of energy in the Universe remains the restframe far-IR radiation of starlight and AGN emission reprocessed by dust.
Describing Evolution Using a Model of Merging Galaxies
In an alternative investigation, we took a simple form of the evolution of the merger rate of dark-matter halos BL93b ; BJ , which adequately reproduces the results of recent -body simulations Jenkins . We assumed that a certain redshift-dependent fraction of the total mass of dark and baryonic matter involved in mergers is converted into energy by nucleosynthesis in high-mass stars with an efficiency 0.007. Note that the same formalism is appropriate for describing the evolution of AGN fueling events at the epochs of mergers BJ . The form of evolution and normalization of can be determined by a joint comparison with the background radiation intensity and low-redshift IRAS counts. Using an appropriate form of Jameson ; L2000 , , and are required in the standard cosmology, assuming the galaxy SED discussed above. The resulting history of galaxy evolution is shown by the thick dashed line in Fig. 1.
In addition, the counts of luminous galaxies associated with merger-induced bursts of activity can be determined if a fraction of mergers are assumed to generate luminous bursts of duration . The product , which could depend on redshift, is the function that controls the results. Using information derived from the counts of both low- and high-redshift galaxies, the form of required to account for the observations can be determined. If the form is chosen, then values of Gyr, , and are required.
Faint Radio and 15-m Mid-IR Counts
Both the simple and hierarchical models account for all the current observations in these wavebands. If the standard form of the far-IR–radio correlation is assumed, with a radio spectral index of , then the 8.4-GHz counts brighter than 10 Jy predicted in the two models are 1.05 and 0.98 arcmin-2, with slopes of and respectively, matching the observed count Part . The faintest 1.4-GHz counts Carilli2 are also reproduced accurately. If the mid-IR SED is described by a power-law with at wavelengths shorter than the peak of the SED, then the normalization and general features of the deep counts of galaxies determined using ISO at 15 m Elbaz are also reproduced, including the marked change of slope at flux densities between 0.5 and 1 mJy. The presence or absence of a PAH emission feature in the SED has little effect on the results. In the hierarchical model, the slope of the predicted 15-m counts at flux densities between 1 and 10 mJy is steeper as compared with that in the simple model, in better agreement with the observations.
3 Conclusions
These models, which involve a minimum number of free parameters, provide a reasonable description of all the counts and redshift distributions of dusty galaxies at both high and low redshifts. As additional data, especially more complete redshift distributions and very deep SIRTF mid-IR counts, become available, more details can be incorporated into the models to reveal further information about the properties of evolving distant dusty starbursts/AGN.
Acknowledgements
The author, Raymond and Beverly Sackler Foundation Research Fellow at the IoA, thanks the Foundation for generous financial support, ESO for support at the meeting, and Vicki Barnard and Kate Quirk for helpful comments on the manuscript. These results are updated from SCUBA Lens Survey work with Ian Smail, Rob Ivison and Jean-Paul Kneib.
References
- (1) A.J. Barger, L.L. Cowie, I. Smail, R.J. Ivison et al.: AJ 117, 2656 (1999)
- (2) V.E. Barnard, A.W. Blain: MNRAS submitted (2001)
- (3) E. Bertin, M. Dennefeld, M. Moshir: A&A 323 685 (1997)
- (4) A.W. Blain, M.S. Longair: MNRAS 264, 509 (1993)
- (5) A.W. Blain, M.S. Longair: MNRAS 265, L21 (1993)
- (6) A.W. Blain, I. Smail, R.J. Ivison, J.-P. Kneib: MNRAS 302, 632 (1999)
- (7) A.W. Blain, A. Jameson, I. Smail, M.S. Longair et al.: MNRAS 309, 715 (1999)
- (8) C.L. Carilli, F. Bertoldi, A. Bertarini et al.: preprint (astro-ph/0009298)
- (9) C.L. Carilli: this volume, astro-ph/0011199 (2001)
- (10) C.L. Carilli, M.S. Yun: ApJ 530, 618 (2000)
- (11) S.M. Cole, A. Aragón-Salamanca, C.S. Frenk et al.: MNRAS 271, 781 (1994)
- (12) L. Dunne, S.A. Eales, M. Edmunds, R. Ivison et al.: MNRAS 315, 115 (2000)
- (13) D. Elbaz, C.J. Cesarsky, D. Fadda, H. Aussel et al.: A&A 351, 37 (1999)
- (14) D.J. Fixsen, E. Dwek, J.C. Mather, C.L. Bennett et al.: ApJ 508, 123 (1998)
- (15) D.T. Frayer, R.J. Ivison, N.Z. Scoville et al.: ApJ 514, L13 (1999)
- (16) B. Guiderdoni, E. Hivon, F.R. Bouchet et al.: MNRAS 295, 877 (1998)
- (17) A. Jameson: PhD thesis, University of Cambridge (1999)
- (18) A. Jenkins, C.S. Frenk, S.D.M. White et al.: MNRAS in press (astro-ph/0005260)
- (19) M. Juvela, K. Mattila, D. Lemke: A&A 360, 813 (2000)
- (20) A.F.M. Moorwood, P.P. van der Werf et al.: A&A in press (astro-ph/0009010)
- (21) S.J. Lilly, O. Le Fèvre, F. Hammer, D. Crampton: ApJ 460, L1 (1996)
- (22) M.S. Longair: in AIP Conf. Proc. No. 516, pp. 3 (AIP, New York, 2000)
- (23) R.B. Partridge, E.A. Richards, E.A. Fomalont et al.: ApJ 483, 38 (1997)
- (24) W. Saunders, M. Rowan-Robinson, A. Lawrence et al.: MNRAS 242, 318 (1992)
- (25) I. Smail, R.J. Ivison, A.W. Blain: ApJ 490, L5 (1997)
- (26) I. Smail, R.J. Ivison, F.N. Owen et al.: ApJ 528, 612 (2000)
- (27) I. Smail, R.J. Ivison et al.: MNRAS submitted (2001)
- (28) B.T Soifer, G. Neugebauer: AJ 101, 354 (1990)
- (29) R.S. Somerville, J.R. Primack, S.M. Faber: MNRAS in press (astro-ph/0006364)
- (30) C. Xu: ApJ 541, 134 (2000)