Verifying the use of supernovae as probes of the cosmic expansion
Abstract
We present preliminary results of a follow-up survey which aims to characterise in detail those galaxies which hosted Type Ia supernovae found by the Supernova Cosmology Project. Our survey has two components: Hubble Space Telescope imaging with STIS and Keck spectroscopy with ESI, the goal being to classify each host galaxy into one of three broad morphological/spectral classes and hence to investigate the dependence of supernovae properties on host galaxy type over a large range in redshift. Of particular interest is the supernova Hubble diagram characterised by host galaxy class which suggests that most of the scatter arises from those occurring in late-type irregulars. Supernovae hosted by (presumed dust-free) E/S0 galaxies closely follow the adopted SCP cosmological model. Although larger datasets are required, we cannot yet find any significant difference in the light curves of distant supernovae hosted in different galaxy types.
1105-24 Astronomy, Caltech, Pasadena, CA 91125, USA
2Institute of Astronomy, Madingley Road, Cambridge, CB3 0HA, UK
1. Introduction
The discovery and controlled systematic study of faint, distant type Ia supernovae (SNe Ia) has transformed the prospects for constraining the time derivative of the cosmic expansion rate. Though well-measured local SNe Ia have a ‘raw’ observed dispersion in their maximum luminosity of , empirical correlations between the peak SNe luminosity and light-curve width enable this scatter to be reduced (Phillips 1993; Hamuy et al. 1996b; Riess et al. 1996; Perlmutter et al. 1999). By using such light curve shape corrections with independent samples of SNe Ia, two Hubble diagrams have been constructed by the High-Redshift Supernovae Search Team (Riess et al. 1998) and the Supernovae Cosmology Project (SCP, Perlmutter et al. 1999, hereafter P99). These data strongly exclude the hitherto popular Einstein de Sitter cosmology (, ). In combination with the results of recent microwave background measurements (de Bernardis et al. 2000; Jaffe et al. 2000) which indicate a spatially flat inflationary universe, the SNe Ia results suggest a significant non-zero cosmological constant (, ).
Conclusions of this importance require excellent supporting evidence. In particular, it is appropriate to question the homogeneity, environmental trends and evolutionary behaviour of the SNe found at all redshifts. Systematic differences between high and low redshift samples might change the derived cosmological parameters without destroying the small dispersion seen in the SNe Ia Hubble diagrams. Evolutionary differences between low and high-redshift SNe Ia might arise via the progenitor composition (Höflich 1999), a differential dust extinction with greater amounts of dust in high-redshift environments, either in the host galaxy (Totani & Kobayashi 1999) or ‘grey’ dust in the IGM (Aguirre 1999), or a dependence of the SNe properties on host galaxy environments. Addressing this last possibility forms the basis of this present study.
Though SNe Ia can occur in all types of galaxies, disk and spheroidal stellar populations should sample different ranges of metallicities and dust content, and thus we might expect that SNe Ia progenitor composition and the light curve properties could be affected accordingly. By studying SNe grouped according to the mean underlying stellar population, we can directly investigate such effects.
Local studies of the environmental effects of local SNe Ia have been conducted by Hamuy et al. (1996a, 2000), Branch et al. (1996) and Riess et al. (1999). In various low-redshift samples, they find the distribution of light curve decline rates correlates with the morphological type of the host galaxy, with ellipticals hosting faster decline rate (dimmer) SNe, whereas spiral galaxies preferentially host slower decline rate (brighter) SNe. Riess et al. (1999) also find that SNe Ia with fast decline rates occur further from the host galaxy centre. Hamuy et al. (2000) present results from a larger combined SNe sample, and find that brighter SNe occur in bluer stellar environments (also noted by Branch et al. 1996), as well as some evidence to suggest that the brightest SNe occur in the least luminous galaxies. We note that no claim has yet been made that such correlations would apply in such a manner as to reduce the significance of a non-zero cosmological constant (Hamuy et al. 2000).
Here, we extend these studies to include similar comparisons between the host galaxies and properties of high-redshift SNe, where environmental effects on the determination of the cosmological parameters can be more easily explored. We present the preliminary results of our study probing the environments of high-redshift SNe Ia discovered via the SCP, and compare these high-redshift SNe/host galaxy correlations with the local sample of SNe of Hamuy et al. (1996a), the same sample previously used in P99 for the determination of cosmological parameters. Though larger local SNe Ia samples have recently become available (Riess et al. 1999), in this preliminary analysis we restrict ourselves to the above local sample for ease of comparison with the P99 cosmological results, deferring a full analysis to a later article (Sullivan et al., in prep.).
2. New Data and Host Galaxy Classification
2.1. HST imaging
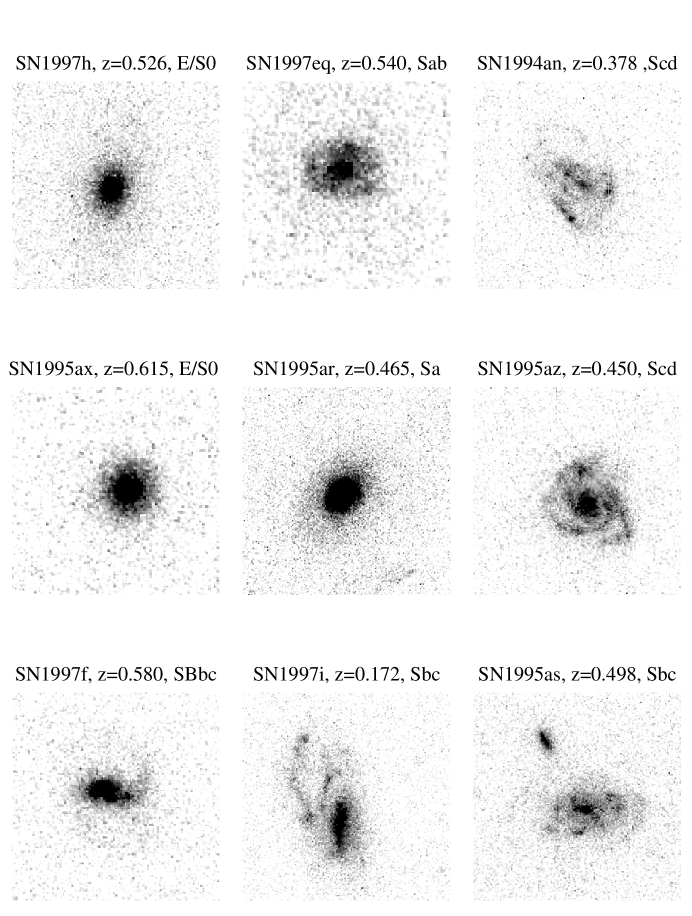
The primary component of our survey is HST snapshot images of the host galaxies of 54 SNe Ia discovered via the SCP, including those 42 SNe Ia used in P99. Each galaxy is being imaged using the STIS in its 50CCD (clear aperture) mode, which approximates a broad bandpass. To date, 31 of the galaxies have been imaged, though in one case the target field was missed by HST. Each galaxy is imaged in a dithered series, and the data reduced using the standard STScI pipeline. Cosmic ray rejection and image combination was performed using the Dither II and Drizzle packages in iraf (Fruchter et al. 1997; Fruchter & Hook 1999). Of the 30 successfully targeted galaxies, 27 have an adequate S/N for visual classification within a broad E/S0:Sab:Scd/Irr scheme (see Figure 1 for examples), 20 of which were used in the Hubble diagram published by P99.
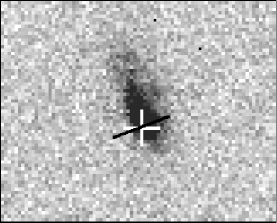
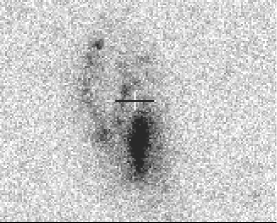
To locate the position and projected distance of the now-faded SNe from the host galaxy centre, the HST snapshot images were cross-correlated with existing deep ground-based images from the original discovery campaigns. Most of the STIS fields typically contained 4-8 objects in common with the ground-based images, which could be used to pinpoint the exact SN location on the STIS image (typically to ) for both a visual inspection of the SN environment, and for subsequent spectroscopic campaigns.
2.2. Keck-II ESI spectroscopic campaign


The existing host galaxy spectra were taken during the period when SN light dominated that of the galaxy, making any studies of host galaxy properties very difficult. Using a subsample of our STIS-imaged galaxies, we have therefore begun a second round of optical spectroscopy using the Echellette Spectrograph Imager (ESI) on the Keck-II telescope. The high spatial resolution of the STIS images and the astrometric location of the SN position enables us to accurately align the ESI slit through the appropriate projected region of the galaxy. To date, 6 host galaxies have been studied in this way, of which 5 were Sc/d or irregular systems; example spectra are shown in Figure 2.
The spectra allow an accurate spectral type (and confirmatory redshift) to be assigned to each galaxy, and estimates of the spatial variation in the star-formation characteristics and dust reddening (via the H/H ratio) at different locations in the vicinity of the SN. Spectra were characterised according to local templates (c.f. Heyl et al. 1997). Whilst the spectroscopic sample is currently small, when enlarged it will permit a further characterisation of the galaxy population and the uncertainties in the adopted reddening estimates (Sullivan et al., in prep).
2.3. Galaxy Classification
We assign a host galaxy type in 3 broad categories: spheroidal (E/S0), spiral (Sa through Sc) and late (Scd/Irr), based on the synergy between three diagnostics available to us:
-
The HST-STIS morphology (20/42 SNe host galaxies from P99 have this data, Figure 1),
-
The ESI or, where useful, pre-existing spectroscopic data (6/42 SNe host galaxies from P99 have ESI spectra, Figure 2),
-
The colour from the original reference SNe search images, i.e. those unaffected by SNe (35/42 SNe host galaxies from P99 have adequate data).
Our primary diagnostics are the STIS imaging and ESI spectra; in all available cases these agree. However, in cases where the STIS morphology may be ambiguous (and no ESI spectrum is available), we demand at least one of the other two diagnostics – either the colour or the pre-existing spectral type – to agree with the STIS classification. In total, 24/42 (57%) P99 high-redshift SNe Ia host galaxies have been classified according to this scheme. Useful statistics of the combined low-z and high-z sample are given in Table 1.
| Type | low- | high- | Total | Dispersion | Best | Dispersion | Best |
|---|---|---|---|---|---|---|---|
| (with stretch) | (no stretch) | ||||||
| Spheroidal | 7 (5) | 7 (7) | 14 (12) | 0.195 | 0.58 | 0.210 | 0.63 |
| Spiral | 8 (8) | 5 (4) | 13 (12) | 0.270 | 0.30 | 0.280 | 0.25 |
| Late/Irr | 3 (3) | 12 (11) | 15 (14) | 0.300 | 0.83 | 0.286 | 0.75 |
3. Current Results
Here we present our preliminary findings and results for the first 24 SNe host galaxies classified as discussed above. As the dataset continues to grow, the quantitative numerical results must be considered provisional. Moreover, only half of the high- SNe hosts used in the P99 analysis have so far been classified.
We first examine the Hubble diagram of P99 (their fig. 2), labelling each SN according to its host galaxy type (Figure 3). The plot suggests that SNe occurring in spheroidal galaxies show less scatter than those in early-type spirals and late-type spirals or irregulars.

This effect is quantified in Table 1, which shows for each galaxy class the mean residual from the best-fit (‘fit C’) cosmology of P99 (, ). We also estimate the implied change in the inferred when SNe originating in each class are used to establish the cosmological model (assuming a flat universe: ). For each host galaxy class in turn, a -dominated cosmology is preferred, though clearly the confidence level is considerably reduced, particularly for SNe in early-type spirals where the sample is smallest. Most importantly however, SNe found in late-type galaxies possess the largest scatter and show a slightly larger (i.e. the SNe are on average fainter), as expected if residual dust extinction affected their measures more than in the case of spheroidal galaxies.
We also investigated the Hubble diagram with each SN plotted according to its projected distance from the host galaxy centre, but found no significant trend. Best-fit cosmologies for SNe located at both small projected distances show slightly smaller derived -values, but the solutions are all within of the P99 result.

There is evidence in local samples of SNe Ia of a correlation between host galaxy type and SNe stretch correction (Hamuy et al. 2000), where fainter (smaller stretch SNe) occur in E/S0 early-type galaxies (see also Hamuy et al. 1996a, 2000; Riess et al. 1999). In order to ensure that the effect we see in Figure 3 is not simply related to the use of inappropriate type-dependent stretch corrections, we repeat the analysis but without making the stretch corrections to the SNe peak luminosity (Table 1). We see that the quantitative result is unchanged; the SNe in late-type galaxies still posses the most scatter about the best-fit and show a slightly large value for than those in E/S0 galaxies.
To investigate any stretch-host galaxy trends further, we plot in Figure 4 the SN stretch as a function of morphological type for both the low and high- P99 sample. As shown in P99, the stretch distribution at high-redshift is narrower than that at low redshift, but even within the narrow stretch range available at high-redshift, we cannot clearly see any trends such as that which would be expected in the spheroidal galaxies (cf Figure 3). At first sight, therefore, Figure 4 suggests that SNe found at low and high redshift may be drawn from two different populations (i.e. at high-redshift we see no trend in stretch with galaxy type, whereas at low-redshift SNe with larger stretches (i.e. brighter SNe) are found in later-type galaxies). However, this result may not be that surprising. If we hypothesise that intrinsically fainter SNe are found in older (E/S0) stellar environments, then as we look to higher-redshift (i.e. viewing galaxies at an earlier stage in their evolution) we would not expect to see the fainter SNe found in local, older, E/S0 galaxies (see Hamuy et al. 2000).
Figure 5 shows the SN stretch plotted as a function of projected distance from the host galaxy. Here a weak trend is found suggesting that SNe at greater projected distances may be fainter, similar to that seen in the local sample of Riess et al. (1999). This could possibly arise if, within a distribution of luminosities, fainter SNe were systematically missed close to the galaxy core.
4. Conclusions
The preliminary results of our investigation continue to support the conclusions of P99. However, the Hubble diagram categorised by galaxy class offers new insight into the origin of the scatter in the diagram. We find the scatter about the best-fit cosmology is greater when determined from SNe which occurred in late-type/irregular galaxies. Minimal scatter is found for SNe drawn from E/S0 galaxies as expected if dust is largely absent in these systems. A non-zero is supported by SNe arising from each galaxy type individually, with late-type galaxies implying a larger than E/S0 galaxies as might be expected when simple dust models are considered. Finally, little difference is found when the Hubble diagram is categorised according to SNe located at large and small projected distances from their host galaxy.

In the future, we will attempt to further subdivide our emission line galaxies into two further types according to the spectral characteristics. By using the high resolution of the ESI, we can classify emission line galaxies according to the spatial variance of their H/H ratio, describing how the dust extinction in such objects varies according to the location inside the galaxy. We will attempt to generate a subsample of these objects which posses a dust distribution that shows large variances and examine whether these objects are responsible for the significant scatter in the current Hubble plot (Figure 3) among the late-type emission line galaxies. Those with smoother dust distributions might be expected to have less intrinsic scatter in the SNe peak luminosities (due to uncertain dust corrections), typical of those SNe arising from E/S0 galaxies.
While these initial results are promising, the current sample size is only around half that used in the full Hubble diagram in P99, and it is clear that further HST imaging and spectroscopic studies of the host galaxy population are needed to confirm the initial findings presented here.
Acknowledgments.
We thank Saul Perlmutter, Peter Nugent, Piero Madau and the Supernovae Cosmology Project team for the many useful discussions and support offered for this work.
References
Aguirre, A., 1999, ApJ, 525, 583
Branch, D., Romanishin, W., Baron, E., 1996, ApJ, 465, 73
de Bernardis, P., 2000, Nature, 404, 955
Fruchter, A.S., Hook, R.N., Busko, I.C., & Mutchler, M., 1997 in ‘The 1997 HST Calibration workshop with a new generation of instruments’, ed. S. Casertano, R.Jedrzejewski, T. Keyes, & M. Stevens, 518
Fruchter, A.S., Hook, R.N., 1999, PASP, submitted (astro-ph/9808087)
Hamuy, M., Phillips M., Suntzeff N., Schommer R., Maza J., Avilés R., 1996a, AJ, 112, 2391
Hamuy, M., Phillips M., Suntzeff N., Schommer R., Maza J., Avilés R., 1996b, AJ, 112, 2398
Hamuy, M., et al., 2000, AJ, 120, 1479
Heyl, J., et al., 1997, MNRAS, 285, 613
Höflich, P., Nomoto, K., Umeda, H., Wheeler, J., ApJ, 528, 590
Jaffe, A., et al., 2000, Phys.Rev.Lett submitted, astro-ph/0007333
Perlmutter, S., 1997, ApJ, 483, 565
Perlmutter, S., 1999, ApJ, 517, 565 (P99)
Phillips, M., 1993, ApJ, 413, L105
Poggianti, B., 1997, A&AS, 122, 399
Riess, A., et al., 1996, ApJ, 473, 88
Riess, A., et al., 1998, AJ, 116, 1009
Riess, A., et al., 1999, AJ, 117, 107
Totani, T., Kobayashi C., ApJ, 525, L65