The Optical Extragalactic Background Light from Resolved Galaxies
Abstract
We discuss the ultraviolet to near-IR galaxy counts from the deepest imaging surveys, including the northern and southern Hubble Deep Fields. The logarithmic slope of the galaxy number-magnitude relation is flatter than in all seven optical bandpasses at faint magnitudes, i.e. the light from resolved galaxies has converged from the UV to the near-IR. Most of the galaxy contribution to the extragalactic background light (EBL) comes from relatively bright, low-redshift objects (50% at and 90% at ). We find a lower limit to the surface brightness of the optical EBL of about , comparable to the intensity of the far-IR background from COBE data. Diffuse light, lost because of surface brightness selection effects, may add substantially to the EBL.
Osservatorio Astronomico di Bologna, Via Ranzani 1, Bologna, Italy
Department of Astronomy and Astrophysics, University of California, Santa Cruz, USA
1. Introduction
The extragalactic background light (EBL) is an indicator of the total luminosity of cosmic structures, as the cumulative emission from pregalactic, protogalactic, and evolving galactic systems, together with active galactic nuclei (AGNs), is expected to be recorded in this background. The recent progress in our understanding of faint galaxy data, made possible by the combination of Hubble Space Telescope (HST) deep imaging and ground-based spectroscopy, and of the evolution of the stellar birthrate in optically-selected galaxies from the present-epoch up to (Steidel et al. 1999; Madau, Pozzetti, & Dickinson 1998), has been complemented by measurements of the far-IR/sub-mm background by the COBE satellite (Hauser et al. 1998; Fixsen et al. 1998; Puget et al. 1996), showing that a significant fraction of the energy released by stellar nucleosynthesis is re-emitted as thermal radiation by dust (Dwek et al. 1998).
In this talk I will focus on the galaxy number-apparent magnitude relation and its first moment, the galaxy contribution to the EBL. The logarithmic slope of the differential galaxy counts () is a remarkably simple cosmological probe of the history of the stellar birthrate, as it must drop below 0.4 to yield a finite value for the EBL. The radiation emitted from unresolved sources that could be lost due to uncertainties in the faintest galaxy data and surface brightness selection effects will be discussed, together with the contribution to the EBL from high- populations such as the Lyman-break galaxies and extremely red objects.
2. Galaxy counts
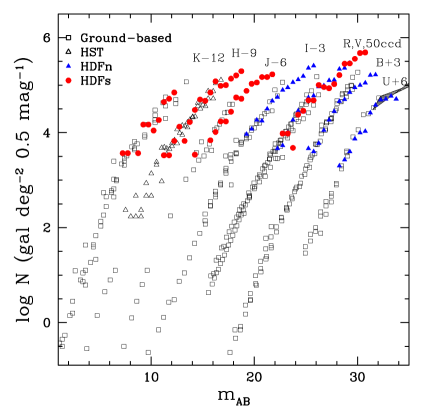
Figure 1 shows the northern and southern Hubble Deep Fields (HDFn and HDFs) galaxy counts as a function of AB isophotal magnitudes in the bandpasses. Details of the data reduction, source detection algorithm, and photometry can be found on http://www.stsci.edu/ftp/science/hdfsouth/catalogs.html. No correction for detection completeness have been made; in the HDFn the optical counts are likely to be more than complete down to the limits plotted in (Williams et al. 1996). A compilation of existing HST and ground-based data is also shown (see Madau & Pozzetti 2000 for references). All magnitudes have been corrected to the AB system, while the second order colour corrections for the differences in the filter effective wavelengths have not been applied to the ground-based data.
Due to local homogeneity, the differential counts at bright magnitude follows an euclidean slope () in all seven band up to from to . Because of the curvature of the universe as well as the evolution of galaxies at intermediate magnitudes, galaxy counts depart from euclidean expectation and follow a slope up to from to . At even fainter magnitudes the counts show a clear flattening to a slope for from to : in particular in the optical bandpasses , and in the and NIR bands.
A fluctuation analysis by Pozzetti et al. (1998) has shown that the turnover observed in the band in the HDFn is likely due to the ‘reddening’ of high redshift galaxies caused by neutral hydrogen along the line of sight. Recently, a re-analysis of the HDFs by Volonteri et al. (2000) shows, however, a steeper slope in the faintest magnitude bin. In the B-band the flattening at faint apparent magnitudes cannot be due to IGM absorption, since the fraction of Lyman-break galaxies at is small (Steidel et al. 1996; Pozzetti et al. 1998). Moreover, an absorption-induced loss of sources cannot explain the similar change of slope of the galaxy counts observed in the and bands.
3. The resolved EBL
The contribution of known galaxies to the optical EBL can be calculated directly by integrating the emitted flux times the differential number counts down to the detection threshold.
3.1. Differential contribution from known galaxies
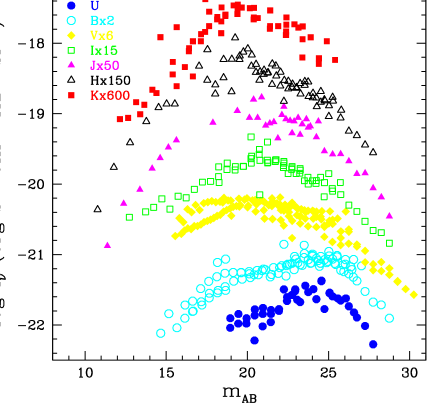
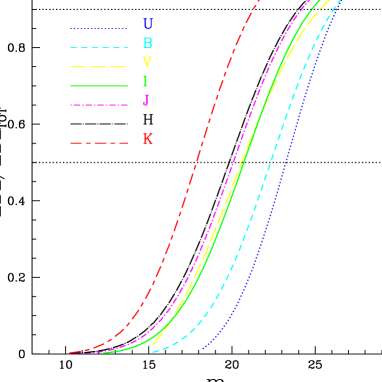
The leveling off of the counts is clearly seen in Figure 2, where the function is plotted against apparent magnitude in all bands. The differential EBL peaks at , and . While counts having a logarithmic slope continue to add to the EBL at the faintest magnitudes, it appears that the HDF survey has achieved the sensitivity to capture the bulk of the near-ultraviolet, optical, and near-IR extragalactic light from discrete sources. The effect of counts flattening is depicted in Figure 3, where it is shown that relatively bright galaxies contribute the most to the resolved EBL: fitting the observed counts we found that 50% of it is produced at (23, 22.5, 21, 20.5, 20, 20, 18), and 90% at (26, 26, 25.5, 25, 24, 24, 21.5).
3.2. Spectrum of resolved EBL
The EBL from detected galaxies in all seven bands has been derived by integrating the galaxy counts down to the faintest detection threshold. The results for m are listed in Table 1, along with the magnitude range of integration and the estimated 1 error bars, which arise mostly from field-to-field variations in the numbers of relatively bright galaxies. An extrapolation of the observed to brighter and fainter fluxes would typically increases the integrated light by less than 20%. The integrated galaxy light is , increases from to , and peaks around m.
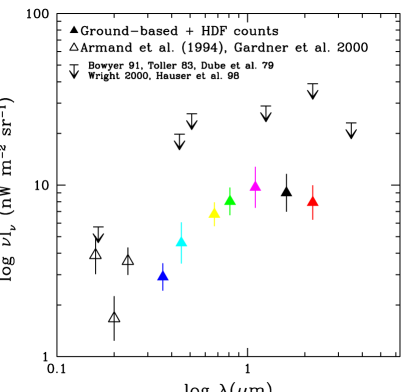
In Figure 4 we show the spectrum of the integrated galaxy light including a UV point at 2000 Å from Armand, Milliard, & Deharveng (1994) and the results of HST/STIS integrated counts at 1600 and 2300 Å from Gardner, Brown & Ferguson (2000). Also plotted are the all-sky-photometry upper limits from Bowyer (1991), Toller (1983), Dube et al. (1979), Wright (2000), and Hauser et al. (1998). These are from 3 to 5 times higher than the contribution from known galaxies.
| (Å) | AB (range) | |||
|---|---|---|---|---|
| – | 0.58 | 0.42 | ||
| – | 0.73 | 0.47 | ||
| – | 1.25 | 0.94 | ||
| – | 1.62 | 0.92 | ||
| – | 3.00 | 1.90 | ||
| – | 2.62 | 1.68 | ||
| – | 2.04 | 1.21 |
is in units of .
4. The unresolved EBL
Diffuse, unresolved light may contribute substantially to the optical EBL. Indeed, different algorithms used for ‘growing’ the photometry beyond the outer isophotes of galaxies may significantly change the magnitude of faint galaxies. According to Bernstein (1999) and Bernstein et al. (2000), roughly 50% of the flux from resolved galaxies with mag lie outside the standard-sized apertures used by photometric packages. An extragalactic sky pedestal created by the overlapping wings of resolved galaxies also contributes significantly to the sky level, and is undetectable except by absolute surface photometry (Bernstein et al. 2000). Also, at faint magnitude levels, distant objects which are brighter than the nominal depth of the catalog may be missed due to the dimming factor. All these systematic errors are inherent in faint-galaxy photometry; as a result, our estimates of the integrated fluxes from resolved galaxies will typically be too low, and must be strictly considered as lower limits.
4.1. Uncertainties in faint galaxy counts
An issue in galaxy counts is the uncertain faint slope, particularly in the band (cf. Volonteri et al. 2000). We have estimated the undetected EBL in the case the number counts have an intrinsic faint slope of , finding an EBL higher by 1530% down to zero fluxes. The integrated galaxy contribution could increase by 100% only if the counts continue to grow with a slope up , or with up to , depending on the band.
4.2. Surface brightness selection effects
At faint magnitudes distant objects and low surface brightness (LSB) galaxies may be missed due to the (1+z)4 dimming factor. According to Yoshii (1993) 40% of galaxies are undetected at if mag/arcsec2; however, since most of the light comes from relatively bright objects, the resolved EBL increases only by up to AB30.
The correction for such effects is however model dependent. We have estimated it for different scenarios: from the PLE models of Totani & Yoshii (2000), which include surface brightness selection effects, we found an integrated galaxy light which is about 10% higher in the band up to , due to high- objects; in a dwarf dominated model (Ferguson & Babul 1998) the faint slope of “total” counts is at ; the background from galaxies increases then by % due to LSBs and high- objects. Vaisanen & Tollestrup (1999) estimate that the maximum LSB contribution to the EBL could be similar to that from known objects. Vogeley (1997) shows that there is a uniform unresolved optical background in the HDFn, which would add a fraction from few tens to 50% to the surface brightness from detected galaxies.
Bernstein (1999) has presented the first tentative detection of the optical EBL at and Å, derived from coordinated data sets from HST and Las Campanas Observatory, and shown that the optical EBL is a factor 24 higher than the integrated contribution of known galaxies. The EBL in the near-IR has been recently estimated from DIRBE data by Gorjian, Wright & Chary (2000) and by Wright (2000), and shows a similar excess compared to the integrated galaxy light. From the above discussion it is difficult, however, to completely explain this descrepancy by surface brightness selection effect and flux lost by standard photometry (Angeretti, Pozzetti, & Zamorani 2001). A high optical/near-IR EBL implies that a high fraction of baryonic mass has been processed by stars throughout cosmic history; these stellar baryons must be accounted for in the local universe (Fukugita et al. 1998; see also contribution by Madau et al. , this volume).
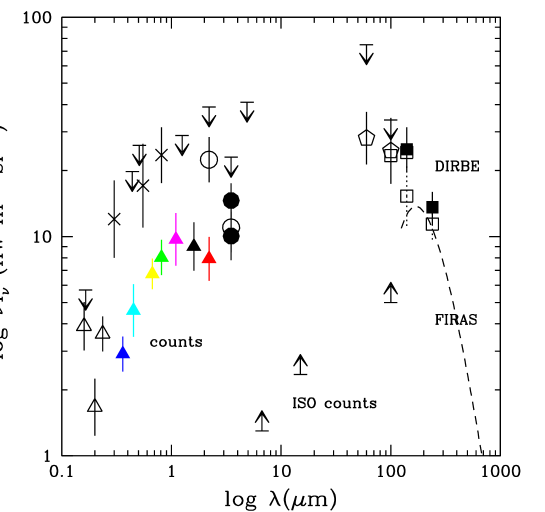
5. Optical and FIR EBL
The spectrum of the optical EBL is shown in Figure 5, together with the recent results from COBE. The values derived by integrating the galaxy counts down to very faint magnitude levels imply a lower limit to the EBL intensity in the 0.3–2.2 m interval of . Including the tentative detection at 3.5 m by Dwek & Arendt (1998) would boost to . The COBE/FIRAS (Fixsen et al. 1998) measurements, in the 125–2000 m range, when combined with the DIRBE (Hauser et al. 1998) points at 140 and 240 m, yield a far-IR background intensity of . The tentative direct measurements in the optical by Bernstein et al. (2000) and in the near-IR by Gorjian et al. (2000), lie between a factor of 2 to 4 higher than the integrated light from galaxy counts, with an uncertainty that is largely due to systematic rather than statistical error. Applying this correction factor to the range 0.3–3.5 m gives a total opticalNIR EBL intensity of . Including the recent FUV results from Gardner et al. (2000), we derive a ‘best-guess’ estimate of the optical/near-IR EBL intensity observed today of
| (1) |
Gispert et al. (2000) derive a similar value in the FIR, . The FIR/optical EBL ratio ranges between and , significanly higher than the local value of (Soifer & Neugeubauer 1991).
6. Contribution to the resolved EBL at different redshift
Since the optical galaxy light peaks around m and the differential resolved EBL shows a maximum at relatively bright magnitudes, most of the background light should come from relatively low redshift (). In the following we will estimate the contribution to the optical EBL from two populations of high redshift sources, the Lyman-break galaxies (LBGs) and the extremely red objects (EROs), and the predictions of different star formation histories.
6.1. Lyman-break galaxies
Using color selection techniques which take into account the opacity at high redshift of intergalactic matter, faint ground-based and HST observations have made possible the detection of star forming galaxies at (Steidel et al. 1996, 1999; Madau et al. 1996). From a statistical analysis of the HDFn Pozzetti et al. (1998) found that the differential fraction of galaxies ( and -dropouts) increases from to in the range . The fraction of U-dropouts to is , and of B-dropouts to is , Integrating the LBG counts and extending them to bright magnitudes using ground based observation (Steidel et al. 1999) we estimate a sky brightness (V) 0.41.1 , which constitutes only a fraction from 5 to 12% of the resolved EBL in the visible band. Near-IR observations have pointed out that LBGs are dusty and therefore must contribute to the FIR and sub-mm background: assuming the spectral energy distribution of a star-forming object and an amount of dust with E(B-V)0.1, we estimate . Adelberger & Steidel (2000) have argues that LBGs may produce the entire 850m background.
6.2. Extremely red objects
The extremely red galaxies (EROs) discovered in deep near-infrared (IR) and optical surveys (Hu & Ridgway 1994) are defined in terms of their very red optical/near-IR colours ( or ). While very rare at bright K magnitudes, their sky density approaches 0.5 0.1 arcmin-2 at K=20 (McCracken et al. 2000). Such very red colours can be explained by three different scenarios: EROs may be 1) starburst galaxies hidden by large amounts of dust, or 2) high redshift () old ellipticals with intrinsically red spectral energy distributions (SEDs) and large positive k-corrections, or 3) obscured AGNs. In the last year increasing evidence has been found – from HST profiles and morphologies (Moriondo et al. 2000; Pozzetti et al. 2001), VLT/ISAAC spectra (Cimatti et al. 1999), and clustering properties (Daddi et al. 2000) – that most (up to 70%) of the EROs could be high- ellipticals. Some EROs have been detected also in the X-ray by ROSAT and XMM (Hasinger 2000). Since the space density of EROs is relatively low up to faint magnitudes (Daddi et al. 2000), their integrated contribution to the EBL in the band is almost negligible. At K19.2, Daddi et al. found of objects with respectively and therefore (extrapolating to brighter and fainters fluxes the light from EROs converges to 0.3 , which constitutes only about 4% of the observed EBL in the -band). If, however, EROs are mainly dusty starburst at high-, they can contribute to the FIR background: assuming a star-forming stellar spectrum and a reddening , we estimate a contribution to the FIR background of . If EROs are mainly obscured AGNs they may contribute to the hard X-ray background.
6.3. Cosmic star formation history
An interesting question arises as to whether a simple stellar evolution model, defined by a time-dependent SFR per unit volume and a constant IMF, may reproduce the global UV, optical, and near-IR photometric properties of the universe as recorded in the comoving luminosity density as a function of redshift and in the global EBL. We assume a universal IMF and fit a smooth function to the UV-continuum emissivity at various redshifts (Lilly et al. 1996; Connolly et al. 1997; Madau et al. 1998; Ellis et al. 1996; Gardner et al. 1997). We then use Bruzual-Charlot’s synthesis code to predict the cosmic emission history at long wavelengths together with the optical EBL.
Following Madau, Pozzetti & Dickinson (1998), we have constructed two simple models: model (A), with a star formation history which peaks at and decreases at higher redshift, as expected in a “hierarchical” scenario of galaxy formation (Somerville et al. 1999) where about 65% of the present-day stars formed at and only 20% at ; model (B), with increasing star formation at early times, as expected in a “monolithic” scenario where 50% of the present-day stars formed at and were shrouded by dust. A Salpeter IMF between 0.1 and 120 M⊙ has been assumed in both models (cf. Madau & Pozzetti 2000).
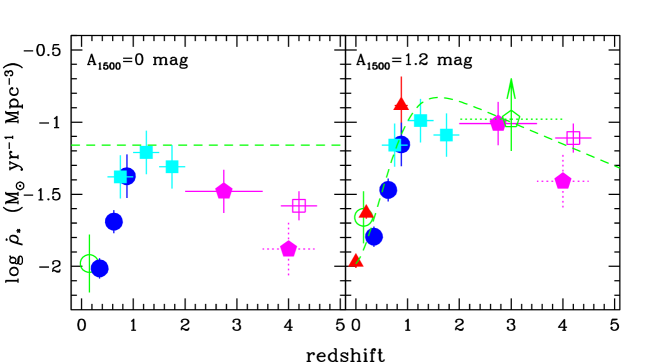
Figure 6 shows the model predictions for the evolution of the luminosity density at rest-frame ultraviolet to near-infrared frequencies; the instantaneous star formation rate is shown in the inset on the upper-right corner of the figure. The shape of the predicted and observed relations agrees better, within the uncertainties, in model (A) if some amount of dust extinction, , is included. In this case the observed UV luminosities must be corrected upwards by a factor of 1.4 at 2800 Å and 2.1 at 1500 Å. In model (B) consistency with the HDF data has been obtained assuming a dust extinction which increases rapidly with redshift, . This results in a correction to the rate of star formation of a factor at and at . Overall, the fit to the data is still acceptable, showing how the blue and near-IR light at are relatively poor indicators of the star formation history at early epochs. We have also checked that a larger amount of hidden star formation at early epochs, as advocated by Meurer et al. (1997), would generate too much , 1 m and 2.2 m light to be still consistent with the observations. An IMF which is less rich in massive stars would only exacerbate the discrepancy.
The amount of optical starlight produced by the two models at different wavelengths and redshifts is shown in Figure 7. While in both scenarios most of the optical light comes from galaxies at all wavelengths, model (A) recovers the resolved EBL at all frequencies except the UV. In model (B) galaxies produce additional UV and IR light, but there is still a deficit compared with the Gardner et al. (2000) resolved UV light and Gorjian et al. (2000) near-IR EBL measurements. The total amount of starlight radiated at optical wavelengths is 16.5 and 28.6 nW m-2 sr-1 for model (A) and (B), respectively. By comparison, the amount of light absorbed by dust and reprocessed in the infrared is equal to 9.9 nW m-2 sr-1 in model (A), about 38% of the total radiated flux, while the monolithic collapse scenario (model B) generates 11.0 nW m-2 sr-1 ( of the total flux). While both models appear then to be consistent with the data (given the large uncertainties associated with the removal of foreground emission and with the observed and predicted spectral shape of the CIB), it is clear that much more infrared light would be generated by scenarios that have significantly larger amount of hidden star formation at early and late epochs.
Finally we have used the “last” version of star formation history corrected by dust extintion estimated from SCUBA observations (Hughes et al. 1998) and near-IR measurements of Balmer lines (Tresse & Maddox 1998). Figure 8 depicts the version of the star formation history with an extintion correction of mag (Madau 1999), hereafter model (C), and an approximately flat star formation at high-. In this case the total amount of optical light produced is 23 , while will be re-radiated in the far-IR. Also in this case the model reproduces well, within the uncertainties, the EBL recorded in the galaxy counts (Figure 9), while it is still lower than the detections of Bernstein (1999) and Gorjian et al. (2000). Half of the resolved EBL in the bandpasses is radiated at , respectively (Figure 9).
As a test we have compared the EBL predicted by the three models without dust extintion. The results are shown in Figure (10): only in these unrealistic cases we are able to approximately reproduce the EBL detected by Bernstein (1999) and Gorjian et al. (2000); in particular in model (B) and (C) high- galaxies produce the light undetected in the galaxy counts at optical and near-IR wavelengths. In model (B) a non-negligible amount of optical light is radiated at . To account for the far-IR background a higher mean star formation rate must assumed, but in this case a larger fraction of baryons must be processed by stars throughout cosmic history, perhaps in conflict (for the assumed IMF) with the local stellar census.
References
Adelberger, K.L., & Steidel C.C. 2000, ApJ, in press
Armand, C., Milliard, B., & Deharveng, J.-M. 1994, A&A, 284, 12
Bernstein, R. A., 1999, in the Low Surface Brightness Universe, ASP Conference Series 170, ed. J. I. Davies, C. Impey, and S. Phillipps, 341
Bernstein, R. A., Freedman, W. L., & Madore, B. F. 2000, submitted
Bowyer, S., 1991, ARA&A, 29, 59
Bruzual, A. C., & Charlot, S. 1993, ApJ, 405, 538
Cimatti, A., et al. 1999, A&A, 352, L45
Connolly, A.J., Szalay, A.S., Dickinson, M., SubbaRao, M.U., Brunner, R.J., 1997, ApJ, 486, L11
Daddi, E., Cimatti, A., Pozzetti, L., et al. 2000, A&A 361, 535
Dube, R.R., Wickes, W.W., Wilkinson, D.T., 1979, ApJ, 232, 333
Dwek, E., & Arendt, R. G. 1998, ApJ, 508, L9
Dwek, E., et al. 1998, ApJ, 508, 106
Elbaz, D., et al. 1999, A&A, 351, L37
Ellis, R. S., Colless, M., Broadhurst, T., Heyl, J., & Glazebrook, K. 1996, MNRAS, 280, 235
Ferguson, H.C., & Babul A. 1998, MNRAS, 296, 585
Finkbeiner, D. P., Davis, M., Schlegel, D. 2000, this volume
Fixsen, D. J., et al. 1998, ApJ, 508, 123
Fukugita, M., Hogan, C. J., & Peebles, P. J. E. 1998, ApJ, 503, 518
Gallego, J., Zamorano, J., Aragon-Salamanca, A., Rego, M. 1995, ApJ, 455, L1
Gardner, J.P., Brown, T.M., & Ferguson, H.C. 2000, ApJ, 542, L19
Gardner, J.P., Sharples, R.M., Frenk, C.S., Carrasco, B.E. 1997, ApJ, 480, L99
Gispert, R., Lagache, G., Puget, J.L. 2000, A&A 361, 1
Glazebrook K., Blake, C., Economou, F., Lilly, S., Colless, M. 1999, MNRAS, 308, 459
Gorjian, V., Wright, E.L., Chary, R.R. 2000, ApJ, 536, 500
Hasinger, G. 2000, in the ESO Deep Fields Workshop, Munich 2000
Hauser, M. G., et al. 1998, ApJ, 508, 25
Hu, E.M., & Ridgway S. E., 1994, AJ 107, 1303
Hughes, D., et al. 1998 Nature, 398, 241
Lagache, G., Abergel, A., Boulanger, F., Desert, F. X., & Puget, J.-L. 1999, A&A, 344, 322
Lagache, G.G., Haffner, L.M., Reynolds, R.J., Tufte, S.L. 2000, A&A 354, 247
Lilly, S.J., Le Fevre, O., Hammer, F., Crampton, D. 1996, ApJ, 460, L1
Madau, P., Ferguson, H.C., Dickinson, M.E., Giavalisco, M., Steidel, C.C., Fruchter, A. 1996, MNRAS, 283, 1388
Madau, P. 1999, in After the Dark Ages: When Galaxies were Young (the Universe at 2z5), eds. S. Holt and E. Smith (AIP Press), 299
Madau, P., Pozzetti, L., & Dickinson, M. 1998, ApJ, 498, 106
Madau, P., & Pozzetti, L., 2000, MNRAS, 312, L9
McCracken, H.J., Metcalfe, N., Shanks, T., Campos, A., Gardner, J.P., 2000, MNRAS, 311, 707
Moriondo, G., Cimatti, A., Daddi E. 2000, A&A, in press
Pozzetti, L., Madau, P., Zamorani, G., Ferguson, H. C., & Bruzual, A. G. 1998, MNRAS, 298, 1133
Puget, J.-L., Abergel, A., Bernard, J.-P., Boulanger, F., Burton, W. B., Desert, F.-X., & Hartmann, D. 1996, A&A, 308, L5
Soifer, B.T., & Neugebauer, G. 1991, ApJ, 101, 354
Somerville, R. S., Primack, J. R., 1999, MNRAS, in press (astro-ph/9802268)
Steidel, C.C., Adelberger, K.L., Giavalisco, M., Dickinson, M., Pettini, M. 1999, ApJ, 519, 1
Steidel, C.C., Giavalisco, M., Pettini, M., Dickinson, M.E., & Adelberger, K. 1996, ApJ, 462, L17
Toller G.N., 1983, ApJ, 266, L79
Totani, T., Yoshii, Y. 2000, ApJ, 540, 81
Tresse, L., & Maddox, S. J. 1998, ApJ, 495, 691
Treyer, M.A., et al. 1998, MNRAS, 300, 303
Vaisanen, P., & Tollestrup, E.V. 1999, in the Low Surface Brightness Universe, ASP Conference Series 170, eds. J.I. Davies, C. Impey, and S. Phillipps, 365
Volonteri, M., Saracco, P., Chincarini G., Bolozonella M. 2000, A&A, in press (astro-ph/0007283)
Vogeley, M. S. 1997, AAS, 191, 304
Williams, R. E., et al. 1996, AJ, 112, 1335
Wright, E.L. 2000, in press (astro-ph/0004192)
Yoshii, Y. 1993, ApJ, 403, 552