An XMM-Newton Study of the sub-structure in M87’s halo
The high signal to noise and good point spread function of XMM have allowed the first detailed study of the interaction between the thermal and radio emitting plasma in the central regions of M87. We show that the X-ray emitting structure, previously seen by ROSAT, is thermal in nature and that the east and southwest extensions in M87’s X-ray halo have a significantly lower temperature (k 1.5 keV) than the surrounding ambient medium (k 2.3 keV). There is little or no evidence for non-thermal emission with an upper limit on the contribution of a power law component of spectral index flatter than 3 being less than 1 of the flux in the region of the radio lobes.
Key Words.:
galaxies: clusters:individual: Virgo – galaxies: individual:M87 – radio continuum:galaxies – radio galaxies: individual: 3C 274 – X-rays: galaxies1 Introduction
The giant elliptical galaxy M87 is located at the center of the X-ray diffuse emission of the irregular Virgo Cluster (Fabricant et al. 1980). Its nearby position ( 17-20 Mpc; Freedman et al. 1994, Tammann & Federspiel 1997) and the XMM-EPIC sensitivity allow detailed measurements of the spectral structure of the X-ray emitting gas on scales down to 1 kpc.
Recently, Harris et al. (2000) using ROSAT/HRI data and the recent high resolution 90 cm map of Owen et al. (2000) find general, but not precise coincidence between some radio and X-ray emitting regions (features described as the eastern ‘ear’ and the southern ‘cobra’). Earlier, Böhringer et al. (1995) using ROSAT/PSPC showed that the lack of detailed spatial correlation of the radio and X-ray emission and the apparent thermal nature of the excess emission in the X-ray asymmetric structure exclude the inverse Compton (IC) mechanism as the origin of most of the X-ray radiation.
The observed X-ray density and temperature distribution of the large scale emission (Mushotzky & Szymkowiak 1988 and references therein) suggests a radiative energy loss of the order of 1043 ergs s-1 which implies that the gas is cooling and it was well modeled, before the XMM data, by a classical cooling-flow model (Stewart et al. 1984, Fabian et al. 1984). In the same region of space a pair of relativistic jets is emerging from the active nucleus of M87, ejecting energy into this environment at an estimated rate of 1044 ergs s-1 in the form of relativistic plasma (e.g. Owen et al. 2000). How these two media interact and if this leads to a heating of the intra-cluster plasma is still a matter of debate.
Detailed analysis of the radio data (Owen et al. 1999,2000) finds a competition between inflow of the hot cluster gas and violent outflow of energy from the inner region, but the relation between the radio jet and the outer halo is still not fully understood.
The detailed morphology of the radio emission suggests the “buoyant bubbles” interpretation, as first proposed for radio lobes in galaxies by Gull and Northover (1973). Churazov et al. (2000) have recently modeled this process with specific application to M87 to explain both the radio lobes and the surrounding X-ray structures. In this model, the ambient gas is captured and uplifted by the relativistic gas; the bubble expands and transforms itself into a torus rising in the potential well, and one expects to find thermal gas, originating in the central regions, in the cavity of the torus. This dynamical behavior implies that the high surface brightness regions are from the uplifted gas and that this effect is increased by cooling-flow conditions.
XMM-Newton observations, which provide unprecedentedly good combined spectral and imaging capabilities, well matched to the spatial scale sizes of interest, are of key importance in clarifying the nature of M87’s X-ray emission.
In this paper, we focus our study on the asymmetric X-ray enhancements detected by XMM-Newton. The core and jet data, together with the characteristics of the underlying extended gas distribution are presented in Böhringer et al. (2001) in this volume. High spectral resolution RGS data will be published in a later paper by Sakelliou et al. (2001).
The paper is organized as follows: we present the observations in section 2. Section 3 describes the spectro-imaging data analysis. Section 4 is dedicated to the scientific discussion and to the relationship between the X-ray and radio emission. The conclusions are in section 5.
2 Observations and data reduction
M87 was observed with XMM-Newton (Jansen et al. 2001) in orbit 97 during the performance verification phase, and all the instruments were operating. In this paper we present only observations from EPIC/MOS (Turner et al. 2001) and pn (Strüder et al. 2001).
The MOS and pn detectors observed M87 in Full Frame Mode for an effective exposure time of about 39 and 25.9 ksec respectively. The MOS calibrated event files were obtained using an IDL software package developed at Saclay for calibration purposes. While results are very similar to those obtained with the SAS software, the flexibility of the IDL software makes it particularly well suited to our purpose, in particular for extracting spectra in complex spatial regions and for computing our energy map. In addition, this software has a built-in vignetting correction. The detector background, as indicated by the light curve of high energy (10-12 keV) events measured with the MOS, was unusually high at the start of the observation, and decreased linearly over the first 7 ksec. We consequently ignore the first 7 ksec of MOS data. Our pn event list were derived from raw data by preliminary SAS tools and further analyzed by the public SAS software. We use the full exposure time.
3 Data Analysis
3.1 Image analysis: morphology of the extended features
The surface-brightness enhancements at the location of the radio lobes are embedded in the galaxy and cluster diffuse emission which has a steep radially falling surface brightness profile. To show their morphology more clearly we thus need a good model of the diffuse gas. The extended M87 X-ray halo does not follow a simple King profile and deviations are seen at a distance greater than 5 arcmin in radius from the center (Böhringer et al. 1997), so modeling this emission is not trivial.
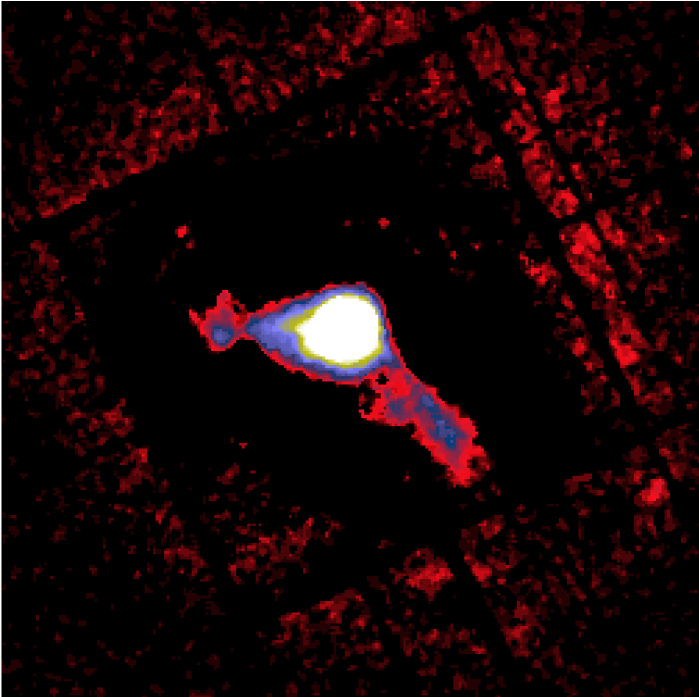
The wavelet transform is a powerful tool for structure decomposition on different image scales. We added together the MOS1 and MOS2 [0.2 - 10.0] keV images and then applied the à trou111see Stark, J.L., Murtagh, F., Bijaoui, A., in Image Processing and Data Analysis Cambridge University Press. 1998, p.21 for details algorithm implemented in the MR/1 wavelets package (Stark 1999). The sum of the lowest spatial frequency scales (corresponding to 4.4 to 17 arcmin with our pixel size2221 pixel = ) represents mainly the cluster and galaxy diffuse gas emission. We subtracted this contribution from the original image revealing the high spatial frequency features (see figure 1).
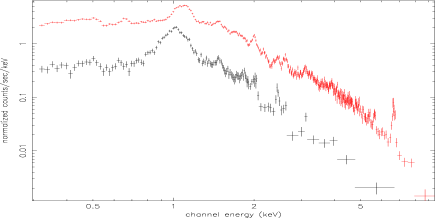
As a first approach, we have extracted spectra in rectangular regions of nearly 3.52 arcmin covering the eastern and south-western features apparent in figure 1. Since the underlying halo emission is roughly symmetric, we have extracted the spectrum of the ambient medium in a circle of 4.5 arcmin radius, centered on the core of M87 and excluding the nucleus, jet and the features associated with the radio lobes. The net spectra are clearly dominated by the FeL complex, and the FeL peak varies over a range from roughly 0.9 keV to 1.1 keV as shown (in black) in figure 2. As with all X-ray CCDs, the EPIC/MOS instruments cannot resolve the FeL blends, but the resolution is good enough to trace any variations of ionisation state by tracking the energy centroid of the Fe complex. Since in the temperature region of interest, 0.5-2.5 keV, the centroid of the FeL feature is a simple function of temperature, we can easily measure small effective changes in temperature. Using a simple analysis of the mekal plasma model, a change in median energy from 0.9 to 1.1 keV for the FeL blend corresponds to a temperature range from 0.8-2 keV.
To enhance the detection of the features of interest we have made a mean energy map (by averaging the energy of all photons falling in the same pixel) in this narrow (0.9-1.1 keV) energy band. The MOS1 energy map smoothed with a Gaussian of and where only pixels with at least 5 counts are taken into account, is shown in figure 3.
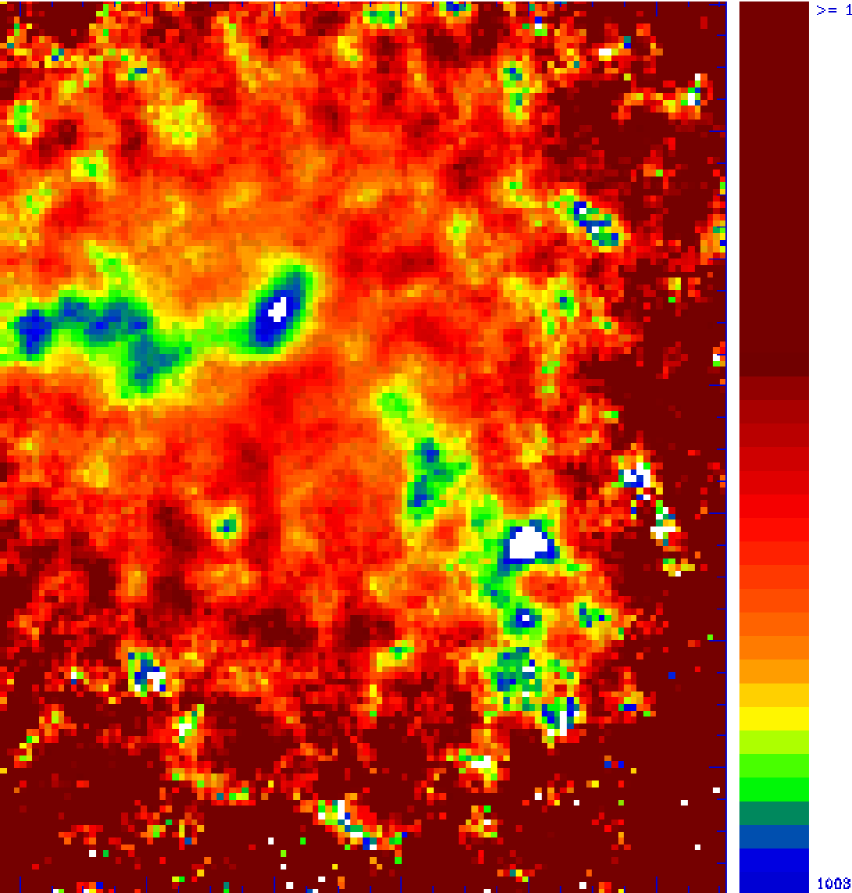
The “arc-like structure” revealed by the wavelets analysis is evident in more detail in this map, indicating that the spatial structure is accompanied by spectral differences. From the X-ray center, an easterly arm which corresponds to the eastern radio lobe, extends up to 3 arcmin; the south-westerly elongation has a size of nearly 4 arcmin and appears separated from the core. Hereafter we refer to these regions as E-arm and SW-arm.
The two arms structures show a lower mean energy than the surrounding ambient medium, and both the east and south-west arm present some kind of “patchy” structures of marginally lower mean energy than other places in the filament: the white bubbles in figure 2 have a mean energy of 1003 () eV and the yellow region is at 1010 () eV; the difference is significant at 1 statistical errors. If this represents a true change in temperature it corresponds to a narrow variation from 1.25 to 1.35 keV. The north-west zone in figure 3 also exhibits apparent granularity, however the poorer statistics in this region than in the arms, suggests that this is due primarily to photon statistics noise.
3.2 Spectral analysis
The spectra presented below are corrected for vignetting effects following the method presented in Arnaud et al. (2001), however the corrections are small for the region of interest here (within 5 arcmin from the center and below 4 keV). Spectra are binned in order to achieve a 3 S/N ratio in each bin after background subtraction, and fitted using the vmekal model implemented in XSPEC version 11. The response file used (on-axis matrix v13.5) is spatially uniform in the central CCD (the region of our analysis). Since the matrix is, at present, uncertain below 0.3 keV, only events above this energy are taken into account in the spectral fits.
To extract the spectrum of each arm, and to rise the S/N ratio with respect to the analysis presented in section 3.1, we have defined a region outlined by the 1.011 keV contour on our energy map, where the gradient is large. Since PSFs are a slightly different for the two MOS cameras, the regions from which counts are extracted differ slightly, resulting in different spectral normalizations.
We have analyzed the spectra in the arm regions using three different methods of background subtraction: (i) a circular region ( 4.5 arcmin) centered in the middle of each arm (1.8 arcmin E and 2 arcmin SW from the center for the E and SW arm respectively), the arm itself being masked with a rectangle of twice its size; (ii) the signal from rectangles of 24 armin size at a distance of 2 arcmin from the arms, located respectively in the north and south direction (E-arm) and in the east and north-west direction (SW-arm); (iii) a circle of 4.5 arcmin in radius centered on the peak of the X-ray emission, excising the arms and the nuclear region. The results are similar in all cases and we use hereafter the method (i) which defines also the extraction regions for the ambient medium spectra.
For the ambient medium surrounding the X-ray arms, background estimates are obtained from a background event list generated by summing together several observations in the XMM Calibration phase after sources have been excised from the field of view (D. Lumb, private communication).
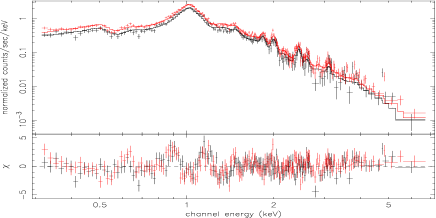
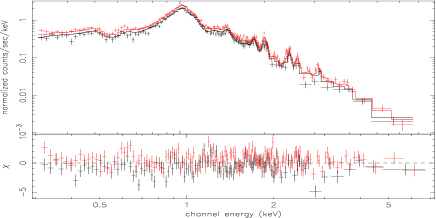
The background-subtracted spectra of the eastern and south-western arms were fitted with vmekal model. The free parameters were NH, O, Ne, Mg, Si, S, Fe abundances and temperature. A single temperature model gives a reduced = 1.8 (E-arm) and = 1.3 (SW-arm), with a best fit temperature of k= 1.2 keV for both arms. A similar analysis has been carried out with pn data with a very similar fitted temperature of k 1.35 keV, /d.o.f.= 268/198 for the E-arm and k 1.27 keV, /d.o.f.= 245/163 for the SW one. In figure 4 we show the MOS E-arm spectrum and folded 1 model. Since significant residuals remain at FeL complex position, we have tried various combinations of models to test the robustness of the low temperature determination. For both the E-arm and SW-arm regions, adding a second temperature component significantly improves the value of the fit. The statistical results of this analysis are summarized in table 1.
| region | T | /d.o.f. | F-test | |
| model | (highest) | value | ||
| E-arm (1T) | 1.28 | 687/373 | ||
| E-arm (2T) | 1.64 | 592/372 | 59.7 | 0.25 |
| SW-arm (1T) | 1.23 | 405/315 | ||
| SW-arm (2T) | 1.51 | 318/314 | 86 | 0.27 |
The low-temperature component is approximately 0.9 keV whereas the second k fitted value is higher than in the case of 1 temperature model, reaching 1.5-1.6 keV. Although the very high signal to noise and the F-test (table 1) support the addition of the second thermal component, we cannot exclude that part of the poor fit with 1 model was due to incompleteness in the Fe line model in the atomic physics code around the FeL complex.
To investigate if IC emission is present in the arms regions, and if it is linked to the power emitted by the radio jet (Harris et al. 1999), we fitted the spectrum with a power law whose spectral index was in the range from 1. to 2.5 (Böhringer et al. 2001). The flux of the allowed power-law component is less than 4 ergs cm-2 s-1 in the 0.5-8 kev band, which represents less than 1 of the flux from the thermal components.
A 2-temperature model does not give a significantly better fit in the case of the surrounding medium spectrum (F-test value 5). We can explain this result considering that the extracted region lies roughly between 1.5 and 5.5 arcmin from the core, over which the effective temperature in M87 ( Böhringer et al. 2001)) changes considerably, so we expect a range of temperature rather than 2 distinct values.
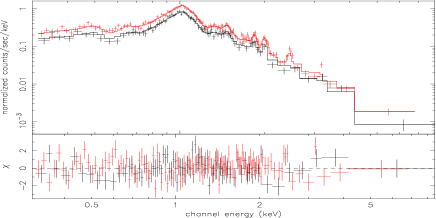
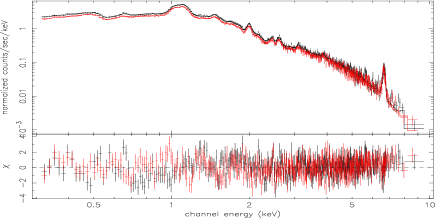
The best-fit parameters for the 2 model (arms) and 1 model (ambient medium) for the MOS spectra are listed in table 2. Figures 5 and 6 show the results. Similarly Figure 7 shows the results for the ambient medium surrounding the X-ray arms.
| region | kT1 | kT2 | NH | O | Si | S | Fe | Lx | /d.o.f. |
| E-arm | 1.64 | 0.90 | 3.2 | 0.25 | 1.37 | 1.19 | 0.90 | 0.45 1042 | 592/372 |
| E-ambient | 2.26 | — | 2.3 | 0.22 | 0.83 | 0.62 | 0.53 | 0.23 1043 | 904/799 |
| SW-arm | 1.51 | 0.88 | 4.0 | 0.26 | 1.05 | 0.73 | 0.62 | 0.23 1042 | 318/314 |
| SW-ambient | 2.28 | — | 2.3 | 0.22 | 0.99 | 0.68 | 0.57 | 0.21 1043 | 1134 /805 |
4 Discussion
4.1 Radio X-ray interactions
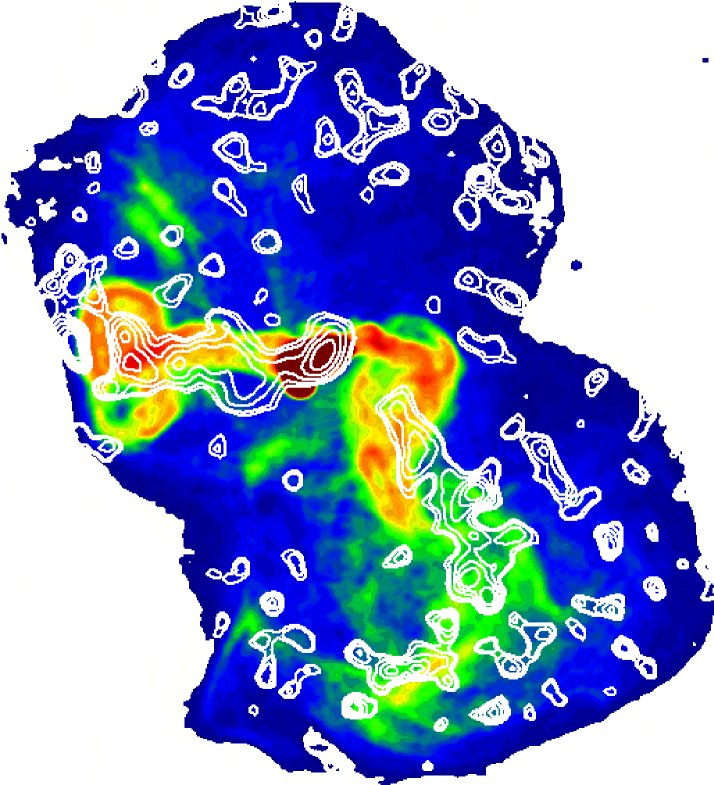
The relationship between radio and X-ray is a key to understanding the physics responsible for the X-ray features (see Churazov et al. 2000; Owen et al. 2000; Harris et al. 2000). Using the best astrometry available within the SAS software, we are able to superimpose, in fig. 8, the contours of our energy map onto the 90 cm radio map, kindly provided by F. Owen (Owen et al. 2000). The XMM/Newton astrometry could be slightly inaccurate (estimated error on the roll angle ; Watson et al. 2001, Hasinger et al. 2001) at this stage of the calibration, but to superimpose both arms onto their respective radio lobes it would be necessary to rotate the XMM image by 10 degrees, which is far too large to be acceptable.
Except for the region in the E-arm described as the eastern “ear” (Harris et al. 2000) where we find good coincidence between our contours and Owen’s map, the overlay clearly shows that the ionisation structure of the X-ray arms (as traced by the mean energy map) does not exactly lie on the radio lobes. In conclusion, we can affirm that the low-temperature region of the X-ray arms is better correlated with the maximum brightness gradient of the lobes than their maximum brightness.
4.2 Temperature structure
Our most significant result is the difference between the temperature of the arms and that of the surrounding medium. Adopting the 2 model the highest temperature of the X-ray arms is 70 lower than the surrounding medium. The temperature of the surroundings corresponding to the E-arm and SW-arm are in very good agreement between each other and with the overall radial profile of M87.
We have a strong upper limit on any non-thermal component to the X-ray spectra of the lobes and thus we rule out the suggestion by Feigelson et al. (1987) that the inverse Compton of the cosmic microwave background is the dominant mechanism for the X-ray emission from the filaments. Using equation (2) of Feigelson et al. we can set a lower limit to the magnetic field of 0.5-2. G. This lower limit is comparable in magnitude to Feigelson et al’s rather uncertain estimates of the equipartition field strengths in different parts of the radio structure. A more detailed comparison of the X-ray and radio maps is required to improve our limits on the magnetic field strength at different positions within the lobes.
The absence of Fe Kα emission from the arms is noticeable in figure 2 since, at the same distance from the center, Fe Kα is clearly detected in the ambient medium. However, since the statistics are poorer in the arms than in the surroundings, we can not determine if this result comes from the lower emissivity of the Fe Kα line at a temperature of 1.5 keV or it is due to the sensitivity of the instrument.
The lower temperature of the X-ray arms with respect to the surrounding medium can be explained by the mixing of plasma from the radio source and surroundings gas (Böhringer et al. 1995) and in the framework of the Churazov et al. (2000) model: the hot ‘radio emitting’ plasma bubble, in nearly pressure equilibrium with the thermal gas, expands adiabatically and rises in the gravitational potential. During the expansion and the torus transformation (Kelvin-Helmholtz instability), it drags some colder material from the inner regions and it convects until its density equals the local mean density. The gas velocity is sub-sonic and the full process occurs on a time scale of a few 107 years. Churazov et al. do not consider radiative cooling in their calculations because of its longer time-scale in this region. But given the high density of the gas, radiative cooling almost surely occurs. This will explain the improvement to the by the second temperature component. Bubbles at different radii throughout the arms are in different hydro-dynamical state. In this framework we speculate that the gas in the arms has a complex multi-phase structure which produces the complex temperature structure seen in our energy map.
4.3 Abundances
The abundances found in the two surrounding regions used for background subtraction are in agreement with those found by Böhringer et al. (2001) at the corresponding distance from the center, this is not surprising even if the used extraction method is slightly different.
Although the fitted temperatures are the same for the two arms, within statistical errors, the abundance parameters present a more complex behavior. In the case of the E-arm, the abundance values of Si, S and Fe are significantly higher with respect to the surroundings. This is marginally true for the SW-arm. However since the abundance values depend sensitively on the exact thermal model used, this should be taken with some caution. The higher abundances measurement in the E-arm can be explained if, as proposed by Churazov et al. (2000), the uplifted gas originated in the inner regions where abundances are higher (Böhringer et al. 2001 ) . However in this picture the lower abundances in the SW-arm are hard to understand. In an alternative scenario proposed by Harris et al. (1999) the SW arm could be due to the shock related to the merger of the M86 subgroup with the M87 group.
5 Conclusion
XMM/Newton observations of the X-ray extended features of M87 have definitively established the thermal nature of the plasma, with the FeL complex dominating the emission. The temperature in these regions is significantly lower than the surrounding medium. This result is very robustly established thanks to the high sensitivity of the experiment. The model of Churazov et al. seems to qualitatively explain our result for the eastern arm but fails to describe the misalignment between X-ray and radio lobes.
Acknowledgements.
We thank the XMM software team for providing the Software Analysis System (SAS) for the XMM-Newton data reduction. EB and JLS thank R. Gastaud for providing additional software for MOS data analysis. We are grateful to M. Arnaud for scientific discussion. The paper is based on observations obtained with XMM-Newton, an ESA science mission with instruments and contributions directly funded by ESA Member States and the USA (NASA)” EPIC was developed by the EPIC Consortium led by the Principal Investigator, Dr. M. J. L. Turner. The consortium comprises the following Institutes: University of Leicester, University of Birmingham, (UK); CEA/Saclay, IAS Orsay, CESR Toulouse, (France); IAAP Tuebingen, MPE Garching,(Germany); IFC Milan, ITESRE Bologna, IAUP Palermo, Italy. EPIC is funded by: PPARC, CEA,CNES, DLR and ASI.References
- (1) Arnaud, M., Neumann et al. 2001, A&A, 365 (this volume)
- (2) Böhringer, H., Nulsen, P.E.J., Braun, R., Fabian, A.C. 1995, MNRAS, 274, L67
- (3) Böhringer, H., Neumann, D.M., Schindler, S., Huchra, J.P. 1997, ApJ, 485, 439
- (4) Böhringer, H., Belsole, E., Kennea, et al. 2001, A&A, 365 (this issue)
- (5) Bolton, J.A., Stanley, G.J., & Slee, O.B. 1949, Nature, 164, 101
- (6) Byram, E.T., Chupp, T.A. & Friedman, H. 1966, Science, 152, 66
- (7) Churazov, E., Brüggen, M., Kaiser, C.R., Böhringer, H. & Forman, W. 2000, ApJ (submitted, astro-ph/0008215)
- (8) Fabian, A.C., Nulsen, P.E.J. & Canizares, C.R. 1984, Nature, 310, 733
- (9) Fabricant, D., Lecar, M. & Gorenstein, P. 1980, ApJ, 241, 552
- (10) Feigelson, E.D., Wood, P.A.D., Schreier, E.J., Harris, D.E., Reid, M.J. 1987, ApJ, 312, 101
- (11) Freedman, W. L., Madore, B. F., Mould, J. R. et al. 1994, Nature, 371, 757
- (12) Gull, S.F., & Northover, K.J. 1973, Nature, 244, 80
- (13) Harris, D.E., Biretta, J.A. & Junor, W. 1999, in Diffuse Thermal and Relativistic Plasma in Galaxy Clusters eds. H. Böhringer, L.Feretti & P. Schuecker MPE Report 271,p.111
- (14) Harris, D.E., Owen, J.A., Biretta, J.A., & Junor, W. 2000, astro-ph/0002464
- (15) Hasinger, G. et al. 2001, A&A, 365 (this issue)
- (16) Jansen, F., Lumb, D., Altieri, B. et al. 2001, A&A, 365 (this issue)
- (17) Mushotzky, R.F. & Szymkowiak, A.E. 1988, in Cooling Flows in Clusters of Galaxies , A.C. Fabian (ed.), Kluwer Acad. Publ. Math and Phys. Science Ser. Vol. 229, p.53
- (18) Owen, F., Eilek, J. & Kassim, N. 1999 in Diffuse Thermal and Relativistic Plasma in Galaxy Clusters eds. H. Böhringer, L.Feretti & P. Schuecker MPE Report 271, p.197 (2000, see also astro-ph/000650)
- (19) Stark, J.L., Murtagh, F., Bijaoui, A. 1998 in Image Processing and Data Analysis Cambridge University Press, p. 21
- (20) Stewart, G.C., Canizares, C.R., Fabian, A.C., & Nulsen P.E.J. 1984, ApJ, 278, 536
- (21) Strüder, L., Briel, U. G., Dennerl, K. et al. 2001, A&A, 365 (this issue)
- (22) Tammann, G.A., & Federspiel, M., 1997, in Extragalactic Distance Scale, STScI Symposium M.Livio et al. (ed.), Cambridge University Press, p.137
- (23) Turner, M. J. L., Abbey, A., Arnaud, M. et al. 2001, A&A, 365 (this issue)
- (24) Watson, M., Augueres, J.L., Ballet, J. et al. 2001, 365 A&A, (this issue)