Detection of Excess Hard X-ray Emission from the Group of Galaxies HCG62
Abstract
From the group of galaxies HCG62, we detected an excess hard X-ray emission in energies above keV with ASCA . The excess emission is spatially extended up to from the group center, and somewhat enhanced toward north. Its spectrum can be represented by either a power-law of photon index 0.8–2.7, or a Bremsstrahlung of temperature keV. In the 2–10 keV range, the observed hard X-ray flux, erg cm-2 s-1, implies a luminosity of erg s-1 for a Hubble constant of 50 km s-1 Mpc-1. The emission is thus too luminous to be attributed to X-ray binaries in the member galaxies. We discuss possible origin of the hard X-ray emission.
Subject headings:
galaxies: clusters: individual (HCG62) — X-rays: galaxies — galaxies: evolution1. Introduction
Clusters of galaxies are thought to have released a large amount of dynamical energy in their initial collapse phase. During their subsequent evolution, starburst-driven winds, cluster mergers, radio galaxies, and random galaxy motions may have supplied additional heating energy to the intracluster space. Presumably, these processes have generated energetic particles (e.g. Kang et al. (1996); Takizawa (2000)), as evidenced by diffuse synchrotron radio emission from some clusters.
Such energetic particles are expected to produce nonthermal X-rays as well, by Compton-boosting cosmic microwave background (CMB) photons. Long searches for such effects among galaxy clusters have recently revealed two candidates; the excess soft X-ray emission detected with EUVE (Lieu et al., 1996; Mittaz et al., 1998; Bowyer & Berghofer, 1998), and the spectral hard X-ray tail observed with BeppoSAX (Fusco-Femiano et al., 1999; Kaastra et al., 1999). However, the exact nature of these emission components remain unclear.
Groups of galaxies are the poorest class of galaxy clusters. Their thermal emission is limited to energies below keV, because the temperature of their hot intragroup medium is about 1 keV (e.g. Mulchaey et al. (1996); Fukazawa et al. (1996)). Therefore, they allow us to search for nonthermal X-ray emission, even with instruments operating below an energy of keV. Here we report the detection of excess hard X-ray emission from the group of galaxies HCG62 with the ASCA GIS (Ohashi et al., 1996; Makishima et al., 1996). We employ 90% confidence limits throughout this paper, and use the Hubble constant of 50 km s-1 Mpc-1. Solar abundances refer to Anders & Grevesse (1989).
2. Observations and Data Reduction
With a redshift of 0.0137 (Hickson et al., 1988), HCG62 is one of the nearest Hickson compact galaxy groups. It was observed twice with ASCA ; on 1994 January 14–15 in a single pointing, and on 1998 January 13–17 in 4 pointings to cover the whole group region. The GIS was operated in PH mode, and the SIS in 2CCD FAINT mode in 1994. We do not use the SIS data taken in 1998, because of the insufficient field of view of 1 CCD mode employed at that time. After an appropriate gain correction, we co-added all the available data from different sensors, chips, and pointings, separately for the GIS and the SIS. The livetime is ksec for the 1994 observation, and ksec for each of the 4 pointings of the 1998 observation. The total GIS livetime thus amounts to 110 ksec.
For our purpose, it is important to accurately subtract the GIS background, which consists of cosmic X-ray background (CXB) and intrinsic detector background (IDB). We first summed data of the ASCA Large Sky Survey (Ueda et al., 1999), conducted in 1993 December and 1994 June over blank sky fields, with a total exposure time of 233 ksec. Then, after Ikebe (1995), we excluded regions in the GIS images where count rate exceeds those from surrounding regions by 2.5. This eliminates faint sources with the 2–10 keV flux erg s-1 cm-2.
We next corrected the IDB level of each pointing individually for its gradual increase by 2–3% per year, and for its random day-by-day fluctuation by 6–8% (Ishisaki et al., 1997). For this purpose, we derived three GIS spectra, denoted , , and , from the on-source data, the blank sky data prepared as above, and night earth data, respectively. They were accumulated over an annulus of radius from the GIS field center and in the 6–10 keV energy range, to ensure that is free from the HCG62 emission, and that the CXB is relatively minor compared to the IDB in and . Then, assuming that the IDB spectrum and its radial profile are both constant, we fitted with a linear combination ; here is a free parameter, and represents the secular IDB change between the two epochs when and were acquired. We have obtained and for the 1994 data and those of 1998, respectively, in agreement with the IDB long-term increase (Ishisaki et al., 1997). By analyzing various ASCA data, we also confirmed that this method can reproduce, to within 5%, the GIS background spectra and its radial profiles acquired at any epoch over 1993–1999.
The SIS has a lower efficiency in the hard X-ray band, a shorter exposure time, and a smaller field of view, than the GIS. We therefore utilize the SIS spectrum only to determine the soft thermal emission from the intragroup medium. We subtract the SIS background in a conventional way, utilizing the archival SIS background set.
3. Results
To avoid the diffuse thermal emission with a typical plasma temperature of keV (Ponman et al., 1993; Fukazawa et al., 1998; Davis et al., 1999), we produced the GIS image of HCG62 in the hard 4.5–8 keV band, as shown in figure 1. There, we overlaid the 1.0–2.4 keV image as a measure of the thermal emission, of which the brightness peak coincides in position with the group center to within . The image reveals a hard X-ray emission, which apparently extends up to from the group center.
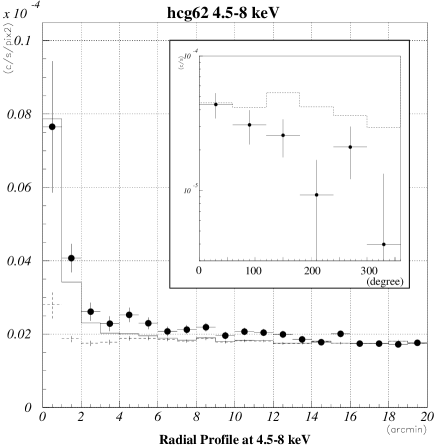
Figure 2 shows the radial GIS count-rate profile in the energy band of 4.5–8 keV, centered on the soft X-ray brightness peak. Also shown are the instrumental point-spread function (PSF), and the profile of the estimated background. Thus, the background level is well reproduced at larger radii within 5%, and the hard X-ray emission is more extended than the PSF, detectable up to from the group center. As shown in the inset to figure 2, the hard X-ray surface brightness is higher in the north region than in the south region. Such a feature cannot be explained as a spill-over from the 1 keV thermal emission. The hard X-ray brightness is not correlated with the galaxy distribution, either, including emission line galaxies (Carvalho et al., 1997).
The observed hard X-ray emission, though apparently extended, could simply be a result of several hard point sources, such as active galaxies, either related or unrelated to HCG62. To answer this issue, we examined the archival ROSAT image of HCG62, and found four point sources with 0.1–2 keV fluxes of erg s-1 cm-2 (shown in figure 1 as open squares) at the locations where the hard-band GIS image actually exhibits possible enhancements with the implied 2–10 keV fluxes of erg s-1 cm-2. The flux ratio between ASCA and ROSAT indicates that the source spectra have a power-law shape of photon index . We have accordingly excluded photons falling within of these four sources. In addition, in order to remove possible point-like sources at the central region of HCG62, we excluded photons within of the group center. Then, the 4.5–8 keV GIS2+GIS3 flux from the on-source data has become photons over the radius of , compared to expected from the background count rate. The excess, counts, well exceeds the 60 counts expected for the 1 keV thermal emission. Thus, the presence of the extended excess hard X-ray emission is significant from the GIS imagery even after excluding possible point-source contamination.
In order to examine the excess hard X-ray emission through spectroscopy, we have produced spectra over the radius of , by utilizing all the available data from the GIS and only the first pointing data from the SIS. The regions within 2.5′ of the four point-like sources were again excluded. We discarded the SIS data above 4 keV for the reason described before. The obtained spectra are presented in figure 3. We fitted them simultaneously, by a single temperature plasma emission model (Raymond & Smith, 1977) (R-S model) with solar abundance ratios (Fukazawa et al., 1996, 1998), modified by photoelectric absorption. As shown in table 1 and figure 3, the model successfully reproduced the data in lower energies, and the derived temperature and metallicity are consistent with those of Fukazawa et al. (1998). However, the model is not acceptable due to significant residuals seen in the GIS fit over energies of keV. When we limit the energy band to keV, the fit becomes acceptable with a reduced chi square of 1.29 and the best-fit temperature of keV. In contrast, when we use only the hard energy band above 2 keV, the best-fit temperature increases to keV; this is inconsistent with that indicated by the soft-band data, and is much higher than the prediction from the galaxy velocity dispersion of km s-1 (Mulchaey et al., 1996). These results reconfirm the presence of excess hard X-ray emission above the prediction of the thermal emission of temperature keV. The results of Finoguenov & Ponman (1999), who reported a high temperature of keV around of the group center, are also consistent with ours.
We refitted the whole-band spectra by adding a Bremsstrahlung or a power-law component, to represent the excess hard X-ray emission. As summarized in table 1, either modeling has given an acceptable joint fit to the ASCA spectra. The Bremsstrahlung temperature has been constrained as keV, while the power-law photon index was found at . Although can be as high as 2.7, such a steep power-law forces the R-S component to have an extremely high metallicity. When we fix the metallicity of the R-S component at 0.30 solar which is typically found from clusters of galaxies, the upper limit on becomes 2.2. Below, we utilize this limit instead of the original one. The normalization of the hard component does not change by more than 20%, if we use plasma emission codes other than the R-S code.
The upper limit on narrow Fe-K line features at keV is uninteresting, several keV in equivalent width. The absorption column density cannot be constrained in any case, and consistent with the Galactic value of cm-2 (Stark et al., 1992). The 2–10 keV X-ray flux and luminosity of the hard X-ray component are erg cm-2 s-1 and erg s-1, respectively, regardless of the choice between the two modelings. This amounts to about 20% of the 0.5–10 keV thermal-component luminosity of erg s-1 (Fukazawa 1997).
Although we have carefully estimated the background, it is still important to examine to what extent our results are affected by possible background uncertainties. To see this, we intentionally increased the IDB background level by 5%, and found that the 2–10 keV flux and luminosity of the hard component becomes erg s-1 cm-2 and erg s-1, respectively. Thus, the hard emission remains statistically significant.
4. Discussion
From the galaxy group HCG62, we have detected the excess X-ray emission with a very hard spectrum, which extends up to more than 10′ from the group center and somewhat enhanced at the north region. Although its surface brightness is only 20% of that of the GIS background, we have confirmed its reality through careful analysis. Below, we discuss the origin and nature of this phenomenon.
An immediate possibility is collection of binary X-ray sources in the member galaxies of HCG62. However, based on the total optical luminosity of HCG62 (; Carvalho et al. (1997)) and the optical vs. X-ray luminosity correlation among elliptical galaxies (Matsushita, 1997), this contribution is estimated to be at most erg s-1, which is an order of magnitude short of the observed luminosity. A second possibility is assembly of faint active galactic nuclei (AGNs) in HCG62. However, the optical evidence for AGNs in HCG62 is moderate (Carvalho et al., 1997), and we have already subtracted such candidates based on the ROSAT image. Any remaining AGNs are estimated to contribute no more than 30–40% of the total hard X-ray emission. Yet another possibility is fluctuation of background faint sources. Utilizing the log–log relation in the 2–10 keV band (Ueda et al., 1999), this contribution is estimated to be at most erg cm-2 s-1 over the radius of , which is again too low to explain the data. From these considerations, we conclude that the excess hard X-ray emission cannot be explained by assembly of discrete hard X-ray sources, whatever their nature be.
Considering the loose constraint on the Fe-K line, the excess emission might be of thermal origin from very hot plasmas. Actually, Buote (2000) described the ASCA spectra of HCG62, integrated over a radius of –, by a two-temperature plasma model of and keV. We have independently reconfirmed their results. However, our spectra (Figure 3) that are accumulated over the – range requires a temperature of keV; the original two-temperature model found by Buote (2000) gives a very poor fit (). Thus, thermal emission with an “ordinary” temperature cannot explain the data. Insignificant detection of excess hard X-rays over a radius of – might be due to poor photon statistics and complex spectra of thermal components (Fukazawa et al., 1998) at the center region, spectral change of hard components, and so on. There might still be plasmas much hotter than the escape temperature, as is actually found in starburst galaxies (e.g. Ptak et al. (1997)). However, within of HCG62, there is no bright IRAS sources with the 60 m flux exceeding 2 Jy (SkyView at High Energy Astrophysics Science Archive Research Center). We therefore conclude that the thermal interpretation of the excess hard X-ray emission is unrealistic.
Given the difficulties with the discrete-source and thermal interpretations of the diffuse hard X-ray emission, we regard nonthermal interpretation as most promising. One popular scenario of non-thermal X-ray production is inverse Compton scattering of the CMB photons by relativistic electrons with Lorentz factor , as has been invoked to explain the excess hard X-ray emission from rich clusters (e.g. Fusco-Femiano et al. (1999)). However, we cannot constrain the intragroup magnetic field in HCG62 due to lack of information on the diffuse radio flux. If we assume a representative magnetic field intensity of 1 G, we would observe synchrotron radio emission with a flux density of 0.3 Jy. Since such a strong radio emission is not seen from HCG62 (SkyView; NVSS VLA image), the inverse-Compton interpretation holds for HCG62 only if its magnetic field is much weaker than 1 G. The reality of such a weak magnetic field is an open question, and in an apparent contradiction to the generally accepted inter-galactic field strengths of G (Kronberg, 1994), even though such a condition is suggested by the BeppoSAX and RXTE observations of some rich clusters of galaxies (Valinia et al., 1999; Fusco-Femiano et al., 1999).
An alternative interpretation is nonthermal Bremsstrahlung between the thermal gas and subrelativistic particles, as proposed for the hard X-ray emission from Abell 2199, of which diffuse radio flux is quite weak (Kempner & Sarazin, 2000) like in the case of HCG62. Let us assume for simplicity that the nonthermal electrons have typical energies of 10–100 keV, and their spatial density distribution is similar to that of the thermal intragroup gas. Then, the nonthermal to thermal luminosity ratio in the 0.5–10 keV band becomes , where is the density ratio of the nonthermal electrons to the thermal ones. The observed luminosity ratio of implies 0.06, indicating that the energy density of nonthermal electrons is 0.6–6 times as high as that of thermal electrons (depending on the spectrum). If this is the case, the mechanism of such particle acceleration becomes an important issue. In addition, the non-thermal pressure associated with such a particle population would considerably increase the total mass of HCG62, and hence its dark-matter content, estimated from the X-ray data.
The diffuse hard X-ray emission has been observed with ASCA from some other galaxy groups as well (Fukazawa, 1999). However, its prominence relative to the thermal X-ray emission appears to scatter from object to object like rich clusters (Molendi et al., 1999), with HCG62 one of the strongest case. Although it is yet to be studied what makes such variety, the hard X-ray emission might be related with transient phenomena such as mergers.
The authors are grateful to Dr. Takizawa for helpful discussions, and to an anonymous referee for helpful comments. This research was supported in part by the Grants-in-Aid for the Center-of-Excellence (COE) Research of the Ministry of Education, Science, and Culture in Japan (07CE2002).
References
- Anders & Grevesse (1989) Anders, E., & Grevesse, N. 1989, Geochim. Cosmochim. Acta. 53, 197
- Bowyer & Berghofer (1998) Bowyer, S., & Berghofer, T. W. 1998, ApJ 506, 502
- Buote (2000) Buote, D. A. 2000, MNRAS 311, 176
- Carvalho et al. (1997) Carvalho, R. R., Ribeiro, A. L. B., Capelato, H. V., & Zepf, S. E. 1997, ApJS 110, 1
- Coziol et al. (1998) Coziol, R., Ribeiro, A. L. B., Carvalho, R. R., & Capelato, H. V. 1998, ApJ 493, 563
- Davis et al. (1999) Davis, D. S., Mulchaey, J. S., & Mushotzky, R. F. 1999, ApJ 511, 34
- Finoguenov & Ponman (1999) Finoguenov, A., & Ponman, T. J. 1999, MNRAS 305, 325
- Fukazawa et al. (1996) Fukazawa, Y., Makishima, K., Matsushita, K., Yamasaki, N., Ohashi, T., Mushotzky, R. F., Sakima, Y., Tsusaka, Y., & Yamashita, K. 1996, PASJ 48, 395
- Fukazawa (1997) Fukazawa, Y. 1997, Ph.D. Thesis, University of Tokyo
- Fukazawa et al. (1998) Fukazawa, Y., Makishima, K., Tamura, T., Ezawa, H., Xu, H., Ikebe, Y., Kikuchi, K., & Ohashi, T. 1998, PASJ, 50, 187
- Fukazawa (1999) Fukazawa, Y. 1999, AN, 320, 377
- Fukazawa et al. (2000) Fukazawa, Y., Makishima, K., Tamura, T., Nakazawa, K., Ezawa, H., Ikebe, Y., Kikuchi, K., & Ohashi, T. 2000, MNRAS 313, 21
- Fusco-Femiano et al. (1999) Fusco-Femiano, R., Fiume, D. D., Feretti, L., Giovannini, G., Grandi, P., Matt, G., Molendi, S., & Santangelo, A. 1999, ApJ 513, L21
- Hickson et al. (1988) Hickson, P., Kindl, E., & Huchra, J. P. 1988, ApJ 331, 64
- Ikebe (1995) Ikebe, Y. 1995, Ph.D. Thesis, University of Tokyo
- Ishisaki et al. (1997) Ishisaki, Y., Ueda, Y., Kubo, H., Ikebe, Y., Makishima, K., & the GIS team 1997, ASCA News 5, 25
- Kaastra et al. (1999) Kaastra, J. S., Lieu, R., Mittaz, J. P. D., Bleeker, J. A. M., Mewe, R., Colafrancesco, S., & Lockman F. J. 1999, ApJ 519, L119
- Kempner & Sarazin (2000) Kempner, J. C., & Sarazin, C. L. 2000, ApJ 530, 282
- Kang et al. (1996) Kang, H., Ryu, D., & Jones, T.W. 1996, ApJ 456, 422
- Kronberg (1994) Kronberg, P. P. 1994, Nature 370, 179
- Lieu et al. (1996) Lieu, R., Mittaz, J. P. D., Bowyer, S., Lockman, F. J., Hwang, C. -Y., & Schmitt, J. H. M. M. 1996, ApJ 458, L5
- Makishima et al. (1996) Makishima, K. et al., 1996, PASJ, 48, 171
- Matsushita (1997) Matsushita, K. 1997, Ph.D. Thesis, University of Tokyo
- Mittaz et al. (1998) Mittaz, J. P. D., Lieu, R., & Lockman, F. J. 1998, ApJ 498, L17
- Molendi et al. (1999) Molendi, S., de Grandi, S., Fusco-Femiano, R., Colafrancesco, S., Fiore, F., Nesci, R., & Tamburelli, F. 1999, ApJ 525, L73
- Mulchaey et al. (1996) Mulchaey, J. S., Davis, S. S., Mushotzky, R. F., & Burstein, D. 1996, ApJ 456, 80
- Ohashi et al. (1996) Ohashi, T. et al., 1996, PASJ, 48, 157
- Ponman et al. (1993) Ponman, T. J., & Bertram, D. 1993, Nature 363, 51
- Ptak et al. (1997) Ptak, A., Serlemitsos, P., Yaqoob, T., Mushotzky, R., & Tsuru, T. 1997, AJ 113, 1286
- Raymond & Smith (1977) Raymond, J. C., & Smith, B. W. 1977, ApJS 35, 419
- Stark et al. (1992) Stark, A. A., Gammie, C. F., Wilson, R. W., Bally, J., & Linke, R. A. 1992, ApJS 79, 77
- Takizawa (2000) Takizawa, M. 2000, ApJ 532, 183
- Ueda et al. (1999) Ueda, Y. et al. 1999, ApJ 518, 656
- Valinia et al. (1999) Valinia, A., Henriksen, M. J., Loewenstein, M., Roettiger, K., Mushotzky, R. F., & Madejski, G. 1999, ApJ 515, 42
- Zabludoff & Mulchaey (1998) Zabludoff, A. I., & Mulchaey, J. S. 1998, ApJ 496, 39
| abundance⋆ | norm1⋆ | normalization of bremsstrahlung | |||
| (cm-2) | (keV) | (solar) | (cm-5) | or powerlaw model | |
| Raymond-Smith (/dof = 2.24) | |||||
| 1.020.03 | 0.150.02 | 7.20.6 | |||
| Raymond-Smith + Bremsstrahlung (/dof = 0.99) | |||||
| 0.950.05 | 0.180.05 | 5.91.0 | keV | cm-5 | |
| Raymond-Smith + Powerlaw (/dof = 0.99) | |||||
| 0.96 | c s-1 cm-2 keV-1 | ||||
| : Column density of photoelectric absorption in unit of cm-2. | |||||
| : Parameters of Raymond-Smith model. | |||||