Abstract
We present a new model for the Galactic population of close double white dwarfs. The model accounts for the suggestion of the avoidance of a substantial spiral-in during mass transfer between a giant and a main-sequence star of comparable mass and for detailed cooling models. It agrees well with the observations of the local sample of white dwarfs if the initial binary fraction is % and an ad hoc assumption is made that white dwarfs with cool faster than the models suggest. About 1000 white dwarfs with have to be surveyed for detection of a pair which has and will merge within 10 Gyr.
keywords:
stars: white dwarfs – stars: statistics – binaries: close[Close Double White Dwarfs]The Population of Close Double White Dwarfs in the Galaxy
1 Introduction
The interest in the close double white dwarfs (hereafter CDWD) stems from several reasons: (i) white dwarfs are the endpoints of stellar evolution; (ii) CDWD experienced at least two stages of mass exchange and thus provide an important tool for testing the evolution of binaries; (iii) merging double CO white dwarfs are a model for SNe Ia; (iv) CDWD may be the most important contributors to the gravitational wave noise at , possibly burying signals of other sources.
We review the data on the currently known CDWD and present results of the modelling of the population of white dwarfs, which involves several new aspects. The most important are the treatment of the first stage of mass loss without significant spiral-in [nvy+00], the use of detailed models for the cooling of white dwarfs and the consideration of different star formation histories for the Galactic disc.
2 Observed close double white dwarfs
| \sphlineN | Name | |||
| \sphline1 | WD 0135052 | 1.556 | 0.47 | 0.52 |
| 2 | WD 0136768 | 1.407 | 0.44 | 0.34 |
| 3 | WD 0957666 | 0.061 | 0.37 | 0.32 |
| 4 | WD 1101364 | 0.145 | 0.31 | 0.36 |
| 5 | WD 1204450 | 1.603 | 0.51 | 0.51 |
| 6 | WD 1704481A | 0.145 | 0.39 | 0.56 |
| 7 | WD 1022050 | 1.157 | 0.35 | |
| 8 | WD 1202608 | 1.493 | 0.40 | |
| 9 | WD 1241010 | 3.347 | 0.31 | |
| 10 | WD 1317453 | 4.872 | 0.33 | |
| 11 | WD 1713332 | 1.123 | 0.38 | |
| 12 | WD 1824040 | 6.266 | 0.39 | |
| 13 | WD 2032188 | 5.084 | 0.36 | |
| 14 | WD 2331290 | 0.167 | 0.39 | |
| \sphline15 | KPD 0422+5421 | 0.09 | 0.51 | 0.53 |
| 16 | KPD 1930+2752 | 0.095 | 0.5 | 0.97 |
| \sphline |
Objects 1 - 14 are CDWD, objects 15 and 16 are sdB stars with suspected white dwarf companions. is the mass of the brighter component and is the mass of the companion. See the text for references.
Table 1 lists the currently known CDWD for which the orbital period and the mass of at least one component are measured [mm99, mmmh00]. The accuracy of the mass determinations is certainly not better than . With the exception of WD 0135052 and 1204450, the brighter components of the pairs are likely to be He white dwarfs, since their mass is lower than 0.46 , the limiting mass for the helium ignition in a degenerate stellar core [sgr90]. In the range of white dwarfs could have CO cores and thick He envelopes [it85]. However, the probability of the formation of these so called “hybrid” WD is 4 – 5 times lower than for helium WD with the same mass [ty93, nyp+00]. The binary dwarfs WD 0957666, 1101364, 1704481A, and 2331290 are expected to merge because of angular momentum loss via gravitational wave radiation. If both components are He dwarfs, the merger may result in the formation of a nondegenerate star or a supernova-scale explosion [ns77]. In the case of CO companions, the formation of an R CrB star is expected [web84, ity96].
We included in Tab. 1 also data on two sdB stars with white dwarf companions [ow99, mmn00]. Subdwarfs are supposed to be helium-burning stars. In these particular systems central helium burning will be completed before components merge. This makes these binaries candidates for future merging CO+CO white dwarfs. Remarkably, for KPD 19302752 the total mass of the system exceeds , making it a possible SN Ia candidate!
About 10 more WD and sdB stars with suspected close WD companions are known [mar00, mmm001]. However, for these systems the orbital periods or the masses of the components are not yet determined.
3 Formation of helium white dwarfs
Three CDWD are of special interest – WD 0136768, 0957666, and 1101364. In these systems the masses of both components suggest that they are helium dwarfs and, thus, descend from degenerate cores of low-mass (sub)giants. If we designate main-sequence stars as MS, red (sub)giants as RG, white dwarfs as WD, the stage of mass exchange, either stable or unstable, as RLOF, and refer by subscripts 1 and 2 to the initial primary and secondary star, the evolutionary sequence which results in the formation of a double helium WD may be described as follows: MS1 + MS2 RG1+MS2 RLOF1 WD1+MS2 WD1+RG2 RLOF2 WD1+WD2. If the mass transfer is unstable, the change of component separation is usually calculated by balancing the binding energy of the envelope of the mass-losing star with the change of the orbital energy [web84]:
| (1) |
Here is the mass of the core of the mass-losing star, is its radius, subscripts and refer to the initial and final values of the orbital separation, is the efficiency of the deposition of orbital energy into the common envelope and is a parameter which depends on the density distribution in the stellar envelope; the usual assumption is [khp87]. It has to be noticed, however, that for stars more massive than 3 the values of for red giants may be significantly lower [dt00]. It would be worthwhile to investigate also lower mass stars, which form most of the observed CDWD.
Giants with degenerate helium cores obey a unique core-mass – radius relation [rw70]. Neglecting a slight dependence on the total mass of the star, this dependence (for solar chemical composition objects) may expressed as [it85]:
| (2) |
where radius of the giant and mass of the core are in solar units. At the instant when the star fills its Roche lobe, the radius given by Eq. (2) is equal to the radius of the Roche lobe. If the mass loss is unstable, the mass of the core of the mass-losing star doesn’t grow during this stage and the mass of the new-born white dwarf is equal to .
Applying Eq. (2) together with restrictions on the masses of the progenitors of helium white dwarfs (0.8 – 2.3 ), Nelemans et al. (2000a) reconstructed the evolution of WD 0136768, 0957666, and 1101364. Their conclusions may be summarized as follows: (i) in the first episode of mass loss, when the companion of the Roche lobe filling star was a main-sequence star of a comparable mass, no substantial spiral-in occurred, see Fig. 2; (ii) in the second mass loss episode, which resulted in the formation of the currently brighter white dwarf, the separation of the components was strongly reduced. The deposition of the energy into common envelope in this episode was highly efficient: in Eq. (1) the product . A note has to be made in relation with the latter statement: since Eq. (1) provides nothing more than an order of magnitude estimate, a formal solution which gives indicates that energy deposited into common envelope has to be comparable to the orbital energy of the binary.
![[Uncaptioned image]](/html/astro-ph/0011248/assets/x1.png)
![[Uncaptioned image]](/html/astro-ph/0011248/assets/x2.png)
|
Since the first mass loss episode is neither stable mass transfer nor a spiral-in in a common envelope and the physical picture of the process is absent, Nelemans et al. (2000a) suggested to use in the population synthesis studies a simple linear equation for the angular momentum balance:
| (3) |
where and are the angular momenta of the pre- and post-mass-transfer binary, respectively, is the amount of mass lost by the binary and is the total initial mass of the system. The parameter is adjusted by fitting the orbital periods and masses of the three abovementioned helium CDWD. It follows that . As Fig. 2 illustrates, when Eq. (3) is applied, the separation between the components changes much less drastically, compared to the case when the “standard” common envelope formalism [Eq. (1)] is applied. For typical values of the fractional mass of the core both formalisms give similar when decreases to . In the actual calculations, for a given , the larger of two values of was used.
4 Cooling of white dwarfs and observational selection
The observed sample of CDWD is biased. Some objects were selected for study since their low mass already suggested binarity. White dwarfs must be sufficiently bright for the mass determination and the measurement of the radial velocities. This suggests to compare a magnitude limited model sample of dwarfs with the observations. Hitherto, following Iben and Tutukov (1985), it was assumed in all population synthesis studies that all WD can be observed for yr, unless close pairs merge in a shorter time. The actual cooling curves were never applied. However, recent studies [dsb+98, han99, ba99, sea00] show, that helium WD cool more slowly than carbon-oxygen ones. This is due to the higher heat content of the helium WD [han99] and residual nuclear burning in the relatively thick hydrogen envelopes (first noticed by Webbink (1975)). In our basic model, we take cooling curves for CO dwarfs from Blöcker (1995) and for He ones from Driebe et al. (1998, hereafter DSBH), see Fig. 3. The initial models for these curves are obtained by mimicking the mass loss by stars and therefore may be considered as the most realistic. However, as we show below, cooling times given by them probably can not be taken at face value and need revision downward. Mass loss in stellar wind and thermal flashes, which extinguishes hydrogen burning [it86b, sea00, asb00], may provide the necessary mechanism.

In addition to the sufficient brightness of the components, CDWD must have such orbital periods that radial velocities would be large enough to be measured, but small enough not to be smeared out during the integration. Following estimates of Maxted and Marsh (1999), we model this selection effect assuming that CDWD with will be detected with 100% probability and that above 8.5 day the detection probability decreases linearly to 0 at .
Our other basic assumptions may be listed as follows: we use Miller and Scalo (1979) IMF, flat distributions over initial mass ratios of the components and the logarithm of the orbital separation, and a thermal distribution of orbital eccentricities.
5 An overview of the models
For the modelling of the population of double white dwarfs we used the numerical code SeBa [pv96] with modifications for low- and intermediate mass stars described by Nelemans et al. (2000b). Some of the important points are discussed below.
Since most progenitors of white dwarfs are low-mass stars, the Galactic star formation history influences the current birthrate of CDWD and the properties of their population. This factor was not studied before. For the present study we take a time-dependent star formation rate in the Galactic disk as
| (4) |
where = 7 Gyr. Equation (4) gives current SFR of 3.6 , which is compatible with the observational estimates [ran91, hj97]. With this equation, the amount of matter that has been turned into stars over the lifetime of the Galactic disk (10 Gyr in our model) is . It is higher than the current mass of the disk, since a part of this matter is returned to the ISM by supernovae and stellar winds. We also compute several models with constant SFR, to allow comparison with previous work (see Tab. 2).
The distribution of stars in the Galactic disk is taken as
| (5) |
where we use = 2.5 kpc [sac97] and = 200 pc. The age and mass dependence of is neglected.
Table 2 gives an overview of our assumptions and model results and a comparison with some models of other authors. Model A is our basic model with an exponential star formation rate in the disk [Eq. (4)], initial fraction of binaries equal to 50% (i.e. with 2/3 of all stars in binaries) and cooling of white dwarfs according to DSBH, but modified as described below, in Sec. 6. The 50% fraction of binaries is suggested as a lower limit to their actual occurrence by the studies of normal main-sequence stars [abt83, dm91]. This model, as well as all our models presented in the Table, were calculated with in Eq. (1) and in Eq. (3). Model A′ is similar to the model A, but assumes that the first stage of mass loss is a common envelope described by Eq. (1) instead of Eq. (3). Model B is similar to the model A, but has initially all stars in binaries, while model C has a constant star formation rate and 50% binaries. Model D has a constant star formation rate and 100% binaries. Models C and D were normalised to SFR of 4 , to allow comparison with the models of Iben et al. (1997, ITY) and Han (1998). The former model was recalculated by LRY for the disk age of 10 Gyr, the age assumed in this study. Note, that ITY assume that unstable mass loss always results in the formation of a common envelope, and their formulation of the equation for the energy balance is different from Eq. (1).
| \sphlineMod. | SFR | bin | WD | SN Ia | IWD | CWD | ||||
|---|---|---|---|---|---|---|---|---|---|---|
| % | ||||||||||
| \sphlineA | Exp | 50 | 9.2 | 4.8 | 2.2 | 3.2 | 4.6 | 2.5 | 19 | 2.3 |
| A′ | Exp | 50 | 3.0 | 2.4 | 2.2 | 11.0 | 1.0 | |||
| B | Exp | 100 | 8.1 | 3.6 | 5.4 | 8.8 | 4.1 | |||
| C | Cns | 50 | 4.0 | 3.2 | 1.6 | 3.4 | 3.6 | 1.2 | 8.5 | 1.9 |
| D | Cns | 100 | 5.3 | 2.8 | 5.8 | 6.1 | 1.9 | |||
| HAN | Cns | 100 | 2.9 | 2.8 | 2.6 | 23.0 | 0.9 | |||
| ITY | Cns | 100 | 4.0 | 8.7 | 1.7 | 1.9 | 8.5 | 3.5 | 8.3 | 1.5 |
| OBS | 3 | |||||||||
| \sphline |
The columns list the identifiers of the models, type of star formation rate assumed for the model (exponential or constant), initial fraction of binaries, total Galactic number of WD, rates of formation and merger of CDWD per 100 yr, rate of merger of CDWD with per 1000 yr (SNe Ia), rate of formation of Interacting double WD (AM CVn type stars) per 1000 yr, total number of Close double WD in the Galaxy, local density of all WD per , local rate of formation of planetary nebulae per per yr. HAN and ITY denote [ity97] and [han98] models, OBS - observational data.
Briefly, the comparison of models shows the following. Models with an exponential SFR compared to the models with a constant SFR (mod. A vs. mod. C) have a higher number of old stars and a higher mass of the disk. This gives higher birthrates of CDWD and AM CVn stars. The rate of mergers giving SNe Ia is similar, since it is determined mainly by the SFR in the past Myr [ty94].
Model A with Eq. (3) for the first mass loss episode gives less mergers than model with Eq. (1), since it produces wider pairs. For the same reason the occurrence of SNe Ia is lower in model . Formation rate of interacting systems (AM CVn’s) is higher in model , because, if two common envelope phases occur, the second-formed WD is typically less massive than companion; if such a pair is brought into contact due to angular momentum loss via gravitational wave radiation, unequal masses of components favour stable mass transfer [npvy01].
Model D has an IMF rather similar to Han’s model, but treats the first mass loss episode differently , does not have companion reinforced stellar wind, and has a higher value. This results in relatively less mergers in the first stage of mass loss and in higher birthrate and total number of CDWD and higher occurrence rate of SNe Ia.
The Iben et al. model differs from all other models by applying a different equation for the evolution in the common envelope, which is, in practice, equivalent to the usage of much higher value of . This results in less frequent mergers in both stages of mass loss, hence, a higher total number of CDWD. The total number of the Galactic WD in this model is lower, compared to our models. This is due to the ITY assumption that close and wide binaries obey different distributions over the mass ratios of the components: flat for close systems and for wide systems (see Tutukov & Yungelson (1993) for details).
Our models share with the Han and ITY models the same assumptions on the initial distributions of close binaries over mass ratios of components and their separations and have rather similar initial IMF for the primary components. The variations of the birthrates and numbers of objects in different classes (within factor ) arise mainly from the differences in the treatment of mass loss and transfer, in initial-final mass relations and other more minor details of population synthesis codes. Since the assumptions in the different studies are generally in agreement with results obtained from the modelling of stellar evolution, Tab. 2 illustrates the limits of the accuracy of predictions by the state of the art population synthesis studies for binary stars.
Observational data which may help to constrain the models are rather scarce and uncertain, e.g., the estimates of local space density of white dwarfs differ by a factor 5 [khh99, fes98, osw+95, rt95]. Our basic model A, as well as model C, complies with these observational limits. Model A gives the annual birthrate of planetary nebulae in somewhat better agreement with the observations [pot96] than model C.
Model A, as well as the rest of the models in Tab. 2, agrees reasonably with the occurrence of SNe Ia in galaxies similar to the Milky Way (E. Cappellaro, this volume). The difference in SNe Ia rates between the models has to be attributed mainly to the different treatment of mass loss and to the different initial-final mass relations for the components of binaries.
6 Models vs. observations
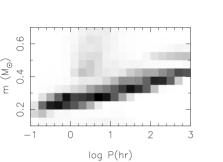
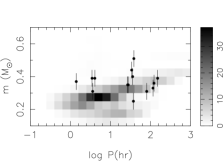
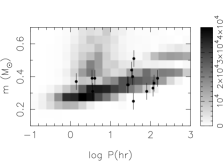
1. Orbital periods and masses of close double white dwarfs. The parameters which are determined for all known CDWD are the orbital period and the mass of the brighter component of the pair. We plot in Fig. 4 the distributions of the occurrence rate for the currently born CDWD and for the simulated magnitude limited samples ( = 15) for the models with different cooling prescriptions.
![[Uncaptioned image]](/html/astro-ph/0011248/assets/x8.png)
|
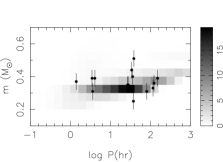
In general, the white dwarf observed as the brighter member of the pair, is the one that was formed last, but occasionally, it may be the one that was formed first, due to the effect of differential cooling, see Fig. 3. The top right panel of Fig. 4 shows that if DSBH cooling curves are taken at face value, the observed sample contains predominantly low mass () white dwarfs, in contradiction to observations. However, as we mentioned above, low-mass WD may experience thermal flashes, which may reduce the mass of their hydrogen envelopes and extinguish hydrogen burning. This may be especially true for WD in close pairs , where one easily expects the formation of a common envelope during a flash. Since estimates for the amount of mass which may be lost in a flash is not yet available , we make an ad hoc extreme assumption that white dwarfs with masses below 0.3 cool like the most massive helium (0.46 ) white dwarfs (hereafter we call this modified DSBH cooling). As can be seen from the bottom right panel of Fig. 4, this assumption brings the model in a much better agreement with observations. All model distributions which follow, are given for the modified DSBH cooling.
For comparison, we plot in the left bottom panel of Fig. 4 the “observed” distribution assuming (like in the studies of other authors) that all WD are visible for yr, unless a pair merges earlier due to GWR. Since in this case cooling curves are not applied, i.e. no magnitudes are computed for the white dwarfs, we can not construct a magnitude limited sample and this panel gives the total number of “potentially visible” CDWD in the Galaxy. The better agreement with observations compared to the modified DSBH case is only apparent, as can be easily seen from the cumulative distributions (Fig. 5).
Figure 5 shows a deficiency of observed systems between hr and day. No selection effects are known that prevent detection of white dwarf binaries with such periods. This “gap” may be partially filled if we plot also subdwarf B stars with suspected white dwarf companions, thus assuming that the current sdB star is a white dwarf in the making. In addition to systems listed in Tab. 1, we include the binaries for which only is determined. However, the number of detected systems is still too small to decide whether the “gap” is real and whether revisions of the stellar evolution models or CDWD formation scenarios are required.
The merger of white dwarfs is one of the models for SNe Ia (see, e.g., Livio 1999 for a review). We estimate that one merger candidate with may be found in a WD sample complete to which contains CDWD among a total of WD. In view of the data in Tab. 2, this estimate is probably uncertain within a factor of at least .
2. Period - mass ratio distribution. Our treatment of the first phase of mass transfer between a giant and a main-sequence star, which doesn’t result in a significant spiral-in, leads to a concentration of the mass ratios of the model systems around In practice, in the observed systems can only be determined if the ratio of the luminosities of the components is [mmm00]. The distribution for the theoretical magnitude limited sample which obeys this criterion, is shown in Fig. 6. In model A′ (with a common envelope in the first mass transfer) CDWD have predominantly , which is not observed and there are hardly any systems with .
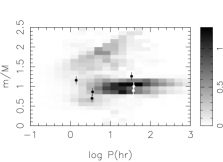
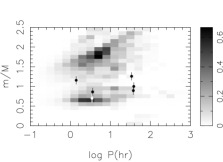
|
3. Mass spectrum of white dwarfs. The left panel of Fig. LABEL:fig:mass shows the spectrum of white dwarf masses in a sample limited by and based on model A. It includes white dwarfs in close pairs which are brighter than their companions and genuine single objects, white dwarfs which are components of the initially wide pairs, merger products, white dwarfs which became single due to disruption of binaries by SNe explosions. In the same Figure we plot the cumulative distribution for DA white dwarfs masses, as estimated by Bergeron et al. (1992) and Bragaglia et al. (1995)