The Effect of Projection on the Observed Gas Velocity Fields in Barred Galaxies††thanks: Astronomy Letters, Vol.26,No 9, 2000, pp.565-571. Translated from Pis’ma v Astronomicheskii Zhurnal, Vol.26, No. 9, pp. 657-664. Translated by A.Dambis.
Abstract
The problem of determining the pattern of gas motions in the central regions of disk spiral galaxies is considered. Two fundamentally different cases – noncircular motions in the triaxial bar potential and motions in circular orbits but with orientation parameters different from those of the main disk – are shown to have similar observational manifestations in the line-of-sight velocity field of the gas. A reliable criterion is needed for the observational data to be properly interpreted. To find such a criterion, we analyze two-dimensional nonlinear hydrodynamics models of gas motions in barred disk galaxies. The gas line-of-sight velocity and surface brightness distributions in the plane of the sky are constructed for various inclinations of the galactic plane to the line-of-sight and bar orientation angles. We show that using models of circular motions for inclinations to analyze the velocity field can lead to the erroneous conclusions of a “tilted (polar) disk” at the circumnuclear region. However, it is possible to distinguish bars from tilted disks by comparing the mutual orientations of the photometric and dynamical axes. As an example, we consider the velocity field of the ionized gas in the galaxy NGC 972.
Key words: barred disk spiral galaxies, gas motion, model calculations of velocity fields
1 Introduction
The analyses of the structure and kinematics of spiral galaxies often require detailed information on the gas motion patterns in the stellar systems considered: the rotation curve and whether the velocity field includes noncircular motions. If gas motions are circular it is enough to measure line-of-sight velocity profiles along two sections passing through the disk center to unambiguously infer the orientation parameters and determine the rotation curve (Zasov 1993). This however only a rough approximation of the real dynamics of the gaseous disk: the velocity fields of spiral galaxies can exhibit large-scale noncircular motions amounting to , which are due by the spiral pattern.
Much more detailed information can be obtained by measuring the full velocity field, i.e., by determining the line-of-sight velocity distribution over the entire galaxy disk. This has since long become common practice among radio astronomers who use interferometry technique to measure the spectral lines of neutral or molecular gas. Similar results are obtained at optical wavelengths with 2D-spectroscopy using Fabry-Perot interferometers or integral field spectrographs. The common feature of all these methods is that they all involve construction of the so-called “data cube” (Tully 1974). A special technique allows the observational data to be reduced to a form where each image element has its own individual emission- (absorption-) line spectrum. The line-of-sight velocity field is then constructed from the Doppler shifts of the lines studied.
It is, however, often difficult to unambiguously reconstruct the rotation curve and analyze the direction of noncircular motions in the galaxy even if the full line-of-sight velocity field is available. Noncircular motions, which are primarily due to the spiral pattern, make it impossible to isolate the circular rotation component simply by averaging the total gas velocity field. Fourier analysis of the line-of-sight velocity field (Lyakhovich et al. 1997) allows the full spatial pattern of gas motions in a spiral galaxy to be reconstructed under certain assumptions about the nature of the spiral structure.
Barred galaxies exhibit noncircular motions of even larger amplitude. Although the interpretation of observed gas velocities in galaxy bars remains highly ambiguous, a number of important conclusions to be made about the motion pattern in the bar can be drawn by analyzing the gas rotation in terms of the circular-motion model. The bar produces a turn of the dynamical axis (i.e., the line of maximum line-of-sight velocity gradient) relative to the line-of-nodes (Chevalier and Furenlid 1978; Afanasiev et al. 1992; Zasov & Moiseev 1999) and this turn can be determined using the well-known algorithms for the analysis of disk galaxy velocity fields.
The most comprehensive conclusions about a bar in a galaxy can be drawn from numerous works on nonlinear computer simulations involving hydrodynamics equations written for “gas” consisting of macromolecules in the form of gas clouds. See Lindblad (1996) for a review of various model simulations. The common result of these works is that a bar to be an efficient mechanism for removing the angular momentum of the gas, thereby making the latter to partly move centerward along the bar and lose the energy at its shock edges (Athanassoula 1992a, 1992b; Levy et al. 1996). This motion pattern distorts the observed velocity contours, aligning them along the bar, whereas the dynamic axis, which is perpendicular to the isovelocities it crosses, must, accordingly, turn in the opposite
We must, nevertheless, bear in mind that the turn of the dynamic axis can also be caused by a tilted disk at galaxy center (Zasov & Sil’chenko 1996; Zasov & Moiseev 1998). However, in this case, the axis of a circular rotating disk coincides with the line-of-nodes. Also the photometric and dynamic axes should therefore turn in the same direction. These are only qualitative considerations; therefore, concrete computations are needed, because the projection effect with radial gas flows in the bar can produce a pattern similar to that expected in the tilted disk case.
Extensive panoramic spectroscopy of HII velocity fields in spiral galaxies have been obtained with the Fabry-Perot interferometer attached to the 6-m BTA telescope of the Special Astrophysical Observatory of the Russian Academy of Sciences. It is very important, when interpreting these data, to analyze gas motions in the bars and identify eventual minibars (smaller than 1 kpc) from the dynamical manifestations they cause in the velocity field (see, e.g., Afanasiev et al. 1989; Zasov & Sil’chenko 1996; Sil’chenko et al. 1997). To investigate whether the above patterns in the behavior of the mutual orientations of photometric and dynamical axes can in principle be applied to analyze observational data, it would be useful to consider the results of numerical velocity-field simulations with allowance for sky-plane projection effects and limited spatial and spectral resolution.
In this paper, we use the initial data, which are similar to the results of computations by Levy et al. (1996), to construct simulated HII velocity fields similar to those actually observed in the Hα and [NII] lines with the standard Fabry-Perot attached to the BTA telescope (see Dodonov et al. (1995) for a detailed description of the instrument). These data have a spatial resolution of and a spectral resolution in velocity terms, with an accuracy of inferred line-of-sight velocities of .
2 Velocity fields constructing
Our simulations are based on the numerical solution of hydrodynamics equations in an external gravitational field. The adopted gravitational potential model consists of a nonaxisymmetric perturbation superimposed on an axisymmetrical component (bulge, disk, and halo) see Matsuda et al.(1987).
The nonaxisymmetric perturbation (stellar bar mode) is turned on smoothly and gradually increased until it reaches the fixed level. The model exhibits a specific quasi-periodic regime of gas passage through the bar (Levy et al. 1994, 1996). Interestingly, the resulting flow pattern is bisymmetric the gas flows centerward along the bar in two sectors, whereas in the other two sectors the flow direction is reversed; i.e., the gas flows away from the disk center due to the saddle point of the gravitational potential. The developing ar also produces a two-armed spiral pattern outside the corotation circle of the bar.
We used the results of simulations identical to those described in detail by Levy et al. (1996). The only difference was that we party adjusted the gravitational potential to closely reproduce the rotation curve of our Galaxy (Haud, 1979). Our model had a maximum linear rotation velocity of ; disk scale length of 3 kpc; radial bar scale length of 1 kpc, and a radius of a simulated region 10 kpc. We further assumed that the galaxy is at a distance of 20.6 Mpc, where 1′′ corresponds to 0.1 kpc, and has a systemic line-of-sight velocity (i.e., the center-of-mass velocity relative to the observer) of .
Our numerical simulations yielded the distributions of gas surface density , radial and azimuthal gas velocity components. Here, and are the radial and azimuthal coordinates in the galactic plane, respectively. The polar grid cells had sizes of in the azimuthal and kpc in the radial direction, depending on the galactocentric distance. Based on these data, we constructed model cubes using the following algorithm. Line-of-sight velocity at point :
| (1) |
where and are the systemic line-of-sight velocity and the inclination of the galaxy plane to the sky plane, respectively. set for the line-of-nodes.
We projected distributions and onto a Cartesian grid with a cell size of 0.02 kpc (08), assuming that the position angle of the line of nodes in the sky plane is . As a result, we obtained the distributions of line-of-sight velocity and gas surface density distributions and , respectively. The emission-line spectrum at each point is fitted by a Gaussian centered on with a , which approximately corresponds to the spectral resolution of the Fabry-Perot Interferometer attached to the BTA telescope. We neglected the velocity dispersion of individual gas clouds during a construction of the total spectrum because of the coarse spectral resolution. We assumed that the spectral-line intensity is proportional to . The images in all spectral channels were Gaussian smoothed to make the resulting spatial resolution equal to 2′′, which is close to the typical seeing value during real observations.
Based on the smoothed-cube spectra, we constructed the velocity field and the spectral-line image (the observed distribution of gas surface density) and determined the observed orientation parameters of the gaseous disk using the technique similar to that described by Begeman (1989). A similar algorithm is used in the well-known GIPSI radio astronomical data reduction software to analyze the observed velocity fields.
Below, we briefly describe the procedure used for the analysis.
Introduce polar coordinate system in the sky plane, where r and PA are the distance from the rotation center and position angle, respectively. The observed line-of-sight velocity in the case of purely circular rotation is
| (2) |
and the distance from the rotation center in the galaxy plane is
| (3) |
where and are the circular rotation velocity and position angle of the line-of-nodes, respectively.
During reduction, the observed velocity field is divided into elliptical rings defined by equation (3) for . A nonlinear least squares technique are used to fit model curve (2) to the observed dependence . As a result, we obtain for each radius the corresponding disk orientation parameters and , and the circular rotation velocity .
Note that while the positions of the extremes of function (2) allow PA to be determined quite unambiguously; estimates are much more uncertain. Thus, at small inclination angles (galaxies seen as face-on), it is impossible to separate the contributions of and to the observed velocity projection and only can be unambiguously inferred. Begeman (1989) used a reduction of radio data to show the coupling of the two parameters at inclination angles .
We constructed and analyzed simulated fields for various bar development stages and inclination angles ranging from 30∘ to 70∘. We varied the angle between the line-of-nodes and the bar with a step of 15∘ and constructed a total of more than 400 simulated galaxies.
3 Analysis of the results
In Fig. 1, we plot the gas surface-density distribution and line-of-sight velocity contours for various bar orientation angles. This is a typical pattern for dimensionless time instants (where corresponds to one bar revolution). The bar then saturates and the spirals degenerate into a pseudo-ring (see Levy et al. (1996) for details). The contour turns inside are caused by the bar, but on greater galactocentric distances they are determined by the motions in spiral arms. The typical S-shaped radial-velocity contours can be seen in the central region. It is interesting that the contours in question are distorted even if the bar is aligned along the major axis of the galaxy (, where is the angle between the major axis of the bar and the line-of-nodes measured in the galaxy plane). The line-of-sight velocity projection is formally equal to zero in this case; however, the bar has a finite width and velocity perturbations contain an azimuthal component, which also contributes to the radial velocity.
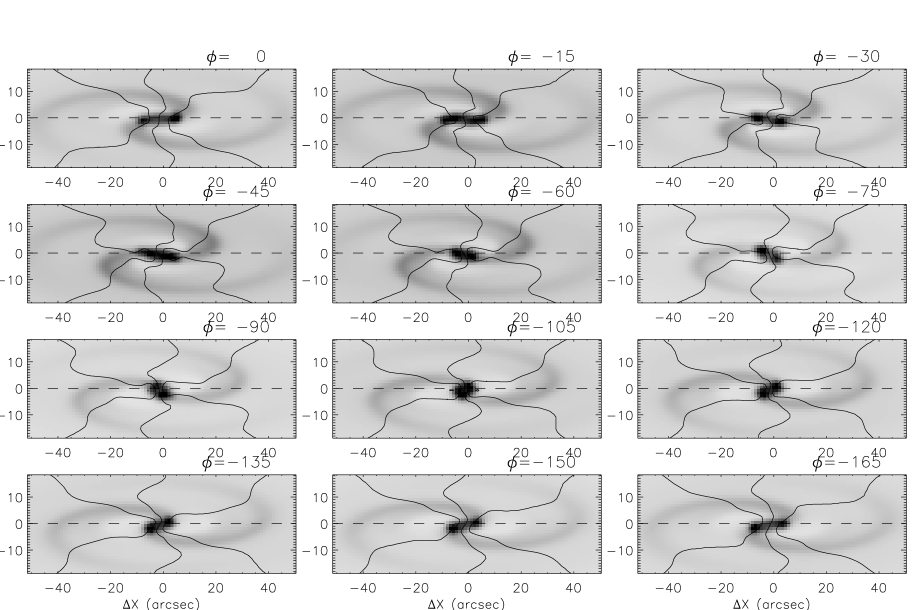
Fig. 2 shows typical results for dynamical axis orientation for an inclination angle of . At the very center of the galaxy, the dynamical axis always deviates significantly from the line of nodes (except , i.e., in the vicinity of the major and minor axes, respectively). Beginning with , the angle between the two lines decreases and becomes negligible at (in the vicinity of the bar tips). At greater galactocentric distances, the dynamical axis turns to the other side of the line-of-nodes and misalignment disappears only at .
As the bar evolves, a shock develops at its leading edge and this shock is especially conspicuous in the pressure maps due to the strong gas density in the region considered. Such an arrangement of shock fronts is consistent with both the observations of dust lanes in bars and with the results of earlier numerical simulations (Athanassoula 1992a, 1992b). The beat-frequency modulation about is due to the complex velocity pattern at the bar tips, where the shock front moves from the leading bar edge to the inner edge of the trailing arms (because the corotation radius is ). The variation pattern is asymmetric with respect to , because of a preferred direction of angle-counting determined by the pitch angle of the spiral density wave, whose direction is opposite to that of galactic rotation (trailing spiral).
The thick line in Fig. 2 shows the orientation of the sky-plane projection of the (the observed photometric) axis of the bar. It is evident from the figure that, in spite of the complex pattern of PA radial variation, the dynamical axis in the bar always turns with respect to the photometric axis in the direction opposite that of the line-of-nodes: the two lines turn in antiphase. This conclusion applies to all simulated fields with different , and .
In order to better illustrate this effect, Fig. 3 shown the deviations of the dynamical axis (averaged over all points with depends on the bar orientation. In this figure, the amplitudes of the turn of the dynamical axis are somewhat smoothed by averaging; however, the overall trend remains conspicuous at all inclination angles and various bar development stages.

At angles ranging from to (which correspond to depending on the inclination angle ), the dynamical axis turns virtually in antiphase with the bar orientation. With a further increase of the angle between the bar and the line-of-nodes the dynamical axis begins to “lag behind”; its orientation changes slower than that of the photometric axis and it virtually coincides with the line-of-nodes at . However, the turn of the dynamical axis from the line-of-nodes is always in the sense opposite that of the bar axis. The lag of the dynamical axis is a result of a combined effect of projection and that the bar fails to stop the gas rotation completely (the maximum bar contrast in our experiment was 30%), and there is always an azimuthal component besides the radial motions.

We now analyze the behavior of the inclination formally inferred from the velocity fields (Fig. 2). Radial motions in the bar region distort relation (2), which should have been observed if the rotation is purely circular. Therefore the inclination inferred at these radii can differ substantially from the true inclination of the disk. The variations of can have amplitudes as high as and are often rather chaotic. However, the following pattern can be observed: for galaxy inclinations , the formally inferred inclination in the bar region becomes virtually constant at (). One gets a false conclusion that the galaxy center contains a decoupled disk whose inclination to the sky plane is smaller than that of the ”outer” disk of the galaxy. The real angle between the disk planes can be as high as 90∘ (the polar disk).
The point is that, although at , the dependence on in the equation (2) differs strongly from the cosine relation, radial motions whose projected velocities are maximum at the minor axis of the galaxy distort the pattern implied by equation (2) making it more like a cosinusoidal corresponding to smaller . It is thus evident that restricting the analysis to surface photometry alone makes it rather difficult to distinguish a minibar from a nuclear polar disk; one may erroneously take the observed pattern for a manifestation of gas moving in curricular orbits with smaller inclination angles, whereas it might simply be a line-of-sight projection of a superposition of circular and noncircular motions in the bar. A turn of the dynamical axis should also be observed in the case of a real tilted (including polar) disk, and analyzing the velocity field alone can lead to wrong conclusions. Recall that in the tilted disk case, both the dynamical and photometric axes should turn in the same direction (Zasov & Moiseev 1999). A tilted disk can therefore be distinguished from a bar only by comparing the PA inferred from the velocity field analysis with the surface photometry data.
4 Kinematics of gas in the galaxy NGC 972
In order to illustrate our approach, we applied it to the NGC 972 galaxy. The galaxy are observed in the [NII] emission line with the scanning Fabry-Perot Interferometer attached to the 6-m BTA telescope of the Special Astrophysical Observatory of the Russian Academy of Sciences. The seeing and spectral resolution were 15 and , respectively. Two velocity fields with different image orientations relative to the detector (two-dimensional photon counter IPCS) are constructed. The results of the velocity-field analysis are briefly described by Zasov & Moiseev (1999), and a more detailed paper is now in preparation. Fig. 4 shows the radial profiles of the position angle of the dynamical axis and inclination angle formally inferred from the velocity field in terms of the circular rotation approximation as described in Section 2. Dots with error bars are mean values averaged over both velocity fields.
The mean inclination of the galaxy to the line of sight is ; the position angle of the line-of-nodes, , in agreement with the orientation of the outermost K-band isophotes () based on observations taken at the UKIRT infrared telescope (Hawaii). The abrupt change of and at can be interpreted in terms of both inclined disk or minibar models.
However, comparing the turns of the dynamic axis with the K-band isophote orientation allows this ambiguity to be resolved. The black line segment in Fig. 4 indicates the mean orientation in the central isophotes of the galaxy, i.e., the position of the photometric axis. It is evident from the figure that the orientation of the photometric axis (relative to the line-of-nodes) varies in antiphase with that of the dynamical axis, a pattern that is indicative of a (1 kpc) bar whose axis makes an angle of to the line-of-nodes. Variations of angle i in this case are due to noncircular motions in the bar, as noted above in Section 3.

We constructed model velocity fields with orientation parameters equal to those of the NGC 972 disk for various time instants corresponding to a gradual increase of the contrast of the gravitational potential of the bar (Levy et al. 1996). Solid lines in Fig. 4 show the results for the model velocity field at . Note that the observed plots agree well with the computed ones given the fact that, strictly speaking, the mass distribution in NGC 972 differs from that of the adopted model.
5 CONCLUSION
Our analysis of model velocity fields constructed from numerical nonlinear two-dimensional simulations of gas flows in bars showed that, if the galaxy plane is inclined by more than to the sky plane, the observed distribution of gas line-of-sight velocities in the bar region can create an illusion of a ”tilted nuclear disk”, implying a wrong interpretation of the observed velocity field.
However, in the case of a bar, the dynamical axis always turns with respect to the line-of-nodes in antiphase with the photometric axis, thereby allowing the bar to be distinguished from a tilted disk by a combined analysis of the kinematics and photometry. We illustrated the use of this criterion by applying it to the NGC 972 galaxy.
-
Acknowledgements.
We are grateful to A.V. Zasov for calling our attention to the problem and providing velocity fields of NGC 972 obtained in the framework of his BTA observing program. We are also grateful to O.K. Sil chenko for her critical comments, interest in our work, and primary reduction of observational material. The image of the NGC 972 galaxy was provided by S. Rider. We thank the staff members of the SFVO laboratory (Special Astronomical Observatory, Russian Academy of Sciences) who performed all observations at the BTA telescope. Special thanks are due to V.L. Afanas ev for his constructive criticism and valuable suggestions. The work was partly supported by the Russian Foundation for Basic Research (grant no. 98-02-17102) and INTAS (grant no. 95-0988).
References
- [1] Afanasiev, V.L., Burenkov, A.N., Zasov, A.V.,& Sil’chenko, O.K., 1992, Sov.Astron., 36, 10
- [2] Afanasiev, V.L., Sil’chenko O.K., & Zasov, A.V.,1989,A&A, 213, L9
- [3] Athanassoula, E.,1992a, MNRAS, 259, 328
- [4] Athanassoula, E.,1992b, MNRAS, 259, 345
- [5] Begeman, K.G., 1989, A&A, 223, 47
- [6] Chevalier, R.A.,& Furenlid, I., 1978, ApJ, 225, 67
- [7] Dodonov, S.N., Vlasyuk, V.V., & Drabek, S.V., 1995, ”Fabry Perot Interferometer: User’s Guide”, (Nizhni Arkhyz).
- [8] Haud,1 U.A., 1979, Sov.Astron.Lett., 5, 68
- [9] Levy, V.V., Mustsevoi, V.V. & Sergienko, V.A., 1994, in ”Physics of the Gaseous and Stellar Disks of the Galaxy”, Ed. by R. King, ASP Conf. Ser. 66, 93
- [10] Levy, V.V., Mustsevoi, V.V., & Sergienko, V.A.,1996, Astron. Astrophys. Trans. 11, 1
- [11] Lindblad, P. A. B., 1996, ”Gas Dynamics in Barred Spiral Galaxies”, Ph. D. Thesis (Stockholm Univ., Stockholm).
- [12] V. V. Lyakhovich, A. M. Fridman, Khoruzhii, O.V., & Pavlov, A.I.,1997, Astron. Rep., 41, 447
- [13] Matsuda, T., Inaoue, M., Sawada, K., et al., 1987, MNRAS, 229, 295
- [14] Tully, R.B.,1974, ApJS, 27, 415
- [15] Sil’chenko, O.K., Zasov, A.V., Burenkov, A.N., & Boulesteix, J.,1997, A&AS,1997, 121, 1
- [16] Zasov, A.V.,1993, in ”The Physics of Galaxies” (MSU, Moscow), p. 62.
- [17] Zasov, A.V. & Moiseev, A.V., in Proceedings of the 194th IAU Symposium on Activity in Galaxies and Related Phenomena, 1999, Ed. by Terzian, Y., Khachikian, E., & Weedman, D., 279; astro-ph/9812121.
- [18] Zasov, A.V. & Sil’chenko, O.K., 1996, ASP. Conf. Ser. 91, 207