The Butcher-Oemler Effect in 295 Clusters: Strong Redshift Evolution and Cluster Richness Dependence
Abstract
We examine the Butcher-Oemler effect and its cluster richness dependence in the largest sample studied to date: 295 Abell clusters. We find a strong correlation between cluster richness and the fraction of blue galaxies, , at every redshift. The slope of the relation is similar for all richnesses, but at a given redshift, is systematically higher for poor clusters. This is the chief cause of scatter in the vs. diagram: the spread caused by the richness dependence is comparable to the trend in over a typical redshift baseline, so that conclusions drawn from smaller samples have varied widely. The two parameters, , and a consistently defined projected galaxy number density, , together account for all of the observed variation in within the measurement errors. The redshift evolution of is real, and occurs at approximately the same rate for clusters of all richness classes.
Subject headings:
galaxies: clusters – evolution1. Introduction
The Butcher-Oemler (BO) effect provided some of the first evidence for the evolution of galaxies and clusters. Butcher & Oemler (1978, 1984) found an excess of blue galaxies in high redshift clusters in comparison with the typical early-type population observed in the central region of local clusters (Dressler 1980). The BO effect has also been observed in more recent studies, which indicate an even stronger evolution of the fraction of blue galaxies in clusters (Rakos & Schombert 1995, Margoniner & de Carvalho 2000).
The BO effect is an indicator of evolution in the cluster galaxy population, which may result from changes in the morphology and star-formation rates of member galaxies with redshift. The fact that blue galaxies are more commonly found at higher redshifts, and the observation of an apparent excess of S0 galaxies in low redshift clusters, lead to the suggestion by Larson et al. (1980) of an evolutionary connection between S0 and spiral galaxies. This idea can explain the population of blue galaxies observed by Butcher & Oemler as spiral galaxies seen just before running out of gas, and the disappearance of this population in more evolved, low redshift rich clusters (Dressler et al. 1997, Couch et al. 1998). In the last decade, high-resolution Hubble Space Telescope images have allowed the determination of the morphology of these high redshift blue galaxies. Dressler et al. (1994), Couch et al. (1994, 1998), and Oemler et al. (1997) found that the Butcher & Oemler galaxies are predominantly normal late-type spirals, and that dynamical interactions and mergers between galaxies may be a secondary process responsible for the enhanced star formation. A recent study by Fasano et al. (2000) indicates that as the redshift decreases, the S0 cluster population increases while the number of spiral galaxies decreases, supporting Larson’s original idea of spirals evolving into S0s.
A second factor affecting the number of blue galaxies may be their environment. The fraction of blue galaxies seems to be correlated with local galaxy density, and with the degree of substructure in the cluster. Many studies have shown that the blue galaxies lie preferentially in the outer, lower density cluster regions (Butcher & Oemler 1984, Rakos et al. 1997, Margoniner & de Carvalho 2000). Also, Smail et al. (1998) studied 10 massive clusters and found that the fraction of blue galaxies in these clusters is smaller than observed in Butcher & Oemler (1984) clusters at the same redshift range. However, an opposite trend is found in non-relaxed clusters with a high degree of substructure, where the fraction of blue galaxies is higher than that observed in regular clusters (Caldwell & Rose 1997, Metevier et al. 2000).
The evolution of these galaxies is probably correlated with its environment in the sense that spirals might consume and/or lose their gas, evolving to SOs, while falling into the higher density cluster regions. Although the exact mechanism responsible for the BO effect is not completely understood (Kodama & Bower 2000), most authors seem to agree that the effect is real. A different idea is presented by Andreon & Ettori (1999) who show that the mean X-ray luminosity and richness of Butcher & Oemler (1984) clusters increases with redshift, and argue that the increase in the fraction of blue galaxies with redshift may not represent the evolution of a single class of objects.
We present observations of the BO effect in a large sample of 295 Abell (1958, 1989) clusters of all richnesses, with no further selection on the basis of morphology or X-ray luminosities. This is important because all previous studies were based on samples biased toward richer clusters, with some samples being further selected according to morphology and/or X-ray luminosities, so that a combination of different selection effects could be mimicking the observed relation. Although our sample inherits biases existent in the Abell catalog, it should contain a more representative variety of clusters (in terms of degree of substructure, richness, and mass) at each redshift than any previous sample, and because of its large size should allow a better determination of the relation. Any results ¸driven by selection effects present in previous samples might become apparent when compared with this one. We describe the data in Section 2, the BO effect analysis in Section 3, and our conclusions in Section 4.
2. Sample Selection and Input Data
The data presented in this paper were obtained to calibrate the DPOSS-II (the Digitized Second Palomar Observatory Sky Survey, Djorgovski et al. 1999). It comprises 44 Abell clusters imaged at the 0.9m telescope at the Cerro Tololo Interamerican Observatory (CTIO) (Margoniner & de Carvalho 2000, hereafter MdC00), and 431 clusters observed at the Palomar Observatory 1.5m telescope (Gal et al. 2000, hereafter G00, and in preparation). The CCD images were taken in the g, r and i filters of the Thuan & Gunn (1976) photometric system, with typical - magnitude errors of 0.12 in g, 0.10 in r, and 0.16 in i at . We have also observed 22 control fields in order to assess the background contribution. More details concerning the data reduction, photometry, and catalog construction can be found in MdC00 and G00.
From this original sample we excluded 120 clusters observed with a small field of view CCD, and 31 very low redshift () clusters, for which only the core region can be observed with our images. Also, 26 cluster fields which exhibited galaxy counts comparable to the mean background, and one cluster with a bright star occupying of the CCD region, were excluded from the analysis. Since 2 Abell clusters had repeated observations from G00 and MdC00, our final sample comprises 295 clusters. It is important to note that at variance with previous studies, the sample presented in this work is representative of all richness class clusters (21% , 50% , 21% , and 8% ). No further selection regarding richness, morphology or degree of sub-clustering was applied when determining our sample. Spectroscopic redshifts for 77 clusters were obtained from the literature, and for the remainder photometric redshifts were estimated with an rms accuracy of approximately 0.04 using the methodology described in MdC00.
3. Analysis of the Butcher-Oemler Effect
The BO effect can be measured by comparing the fraction of blue galaxies in clusters at different redshifts. The color-magnitude (CM) relation was determined by fitting a linear relation to the red galaxy envelope using the same prescription as in MdC00. Red envelopes were subjectively classified as well-defined or not by visual inspection. Galaxies were defined as blue if they had colors below the linear locus in the CM relation. We used the spectral energy distribution of a typical elliptical galaxy (Coleman et al. 1980) to derive corrections for our sample, and also corrected the data for extinction using the maps of Schlegel et al. (1998). Because the main purpose of this work is to study the evolution of galaxy populations, fainter galaxies play a crucial role. Whereas Butcher & Oemler were limited to brighter galaxies by their photographic data, our CCD sample allows us to probe significantly deeper, selecting galaxies with r magnitude between and , inside a region of radius Mpc around the cluster. This fixed linear size was chosen because our CCD images cover a field of radius Mpc at , and we want to study the same physical region and the same galaxy luminosity range for the entire sample. We assume a cosmology with Km s-1 Mpc-1, and , in which (Lin et al. 1996).
Most () of the clusters in our sample are at , so that the Mpc central region, and the entire luminosity range between and can be observed. Clusters at higher redshifts are limited at brighter absolute magnitudes and a correction was applied in order to compare the fraction of blue galaxies in these clusters with the rest of our sample. The lower redshift clusters suffer from the opposite problem, since the brighter galaxies will be saturated, and we are also limited by the field of view. Details about these corrections can be found in MdC00, the only difference being that in the present work we adopt a more conservative brighter limiting magnitude of instead of .
The blue and total counts contain a mix of cluster members and background galaxies. Background variations place a fundamental limit on the accuracy of measurements: no matter how well one determines the mean background from a number of control fields, the background estimate for any particular cluster is no more accurate than the scatter in the control fields. For each cluster, we measured the effect of this scatter by computing using background corrections from the 22 individual control fields scaled to the area of the CCD and the CM relation appropriate to that cluster. The final is given by the median and the rms is based on the central two quartiles of the distribution. Simple propagation of errors through the equation would give an overestimate because and are correlated. The usual assumption that the error in is mainly due to Poisson statistics in the background-corrected cluster counts does not properly take into account the background variations and errors thus derived are about three times smaller than ours when applied to the same data.
The final fractions of blue galaxies for the entire sample are shown in the upper panel of Figure 1. For those clusters with multiple observations, we have used the observation with smaller . Clusters with spectroscopic and photometric redshift measurements are indicated by solid and open circles respectively. The individual error bars are not presented to avoid confusion in the plot, but the median is 0.071. The lower panel presents only clusters that have: (1) , (2) spectroscopic redshift measurements, and (3) a well-defined CM relation. The - errors are indicated for these clusters. In both panels, the solid lines indicates a linear fit derived from the clusters with (, with an rms scatter of for the entire sample shown in the upper panel, and , with an rms of for the sample shown in the lower panel). The fits were done with the GaussFit program (Jefferys et al. 1988) taking into account the measurement errors in . The dashed line indicates the rms scatter around the fit, and while the upper panel shows a larger scatter, the two derived relations are the same within the errors. A clear trend of strong evolution with redshift is seen. A test applied to the fit presented in the upper panel results in 1.36 if only errors are considered, and 1.13 when the uncertainties in the photometric redshifts are also taken into account. Such small is due however to large measurement errors in this sample. A higher of 1.72 is obtained for the subsample of clusters with smaller and spectroscopic redshift (lower panel of Figure 1).
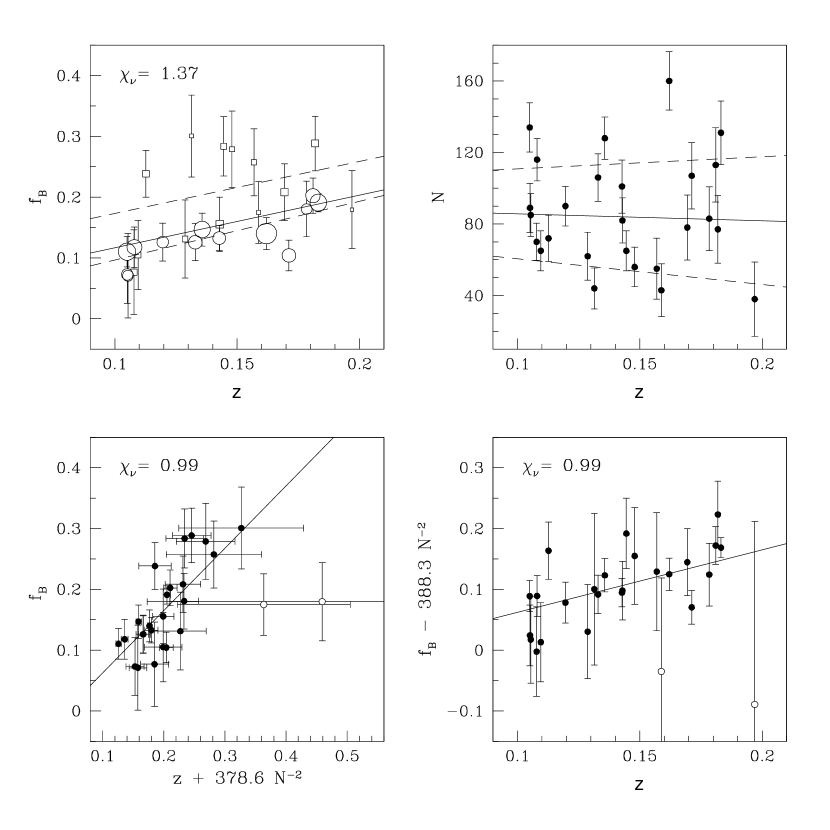
Richness is a natural second parameter which might cause the range in at given redshift. The left upper panel of Figure 2 shows the diagram with symbol sizes scaled by , the number of galaxies between and , inside Mpc, after background correction. Only clusters from the lower panel in Figure 1 and at redshifts between 0.1 and 0.2, where no corrections needed to be applied to compute , are presented in this figure. The solid line is the best-fit linear relation for the 26 clusters shown, and the dashed lines indicate the relations obtained when the sample is subdivided in two 13 cluster samples according to richness. The slopes of the three relations are the same within the errors ( for the entire sample, for the subsample of richest clusters, and for the poorest ones). Although the uncertainties are large, the rate of evolution is approximately constant for all richnesses, and there is clearly an effect, with richer clusters tending to lower . The suggestion by Andreon & Ettori (1999) that the observed increase of with redshift is caused by missing poor clusters at higher redshift is therefore no longer tenable, because any such selection effects would serve to decrease the redshift evolution of . The evolution in is real, and takes place in all richness classes.
To ensure that richness and redshift are not correlated in this subsample, we plot in the right upper panel of Figure 2. The best-linear fit () is indicated by the solid line, and the dashed lines represent adding/subtracting - uncertainties to its coefficients. Richness and redshift are uncorrelated in this sample.
To gauge the richness importance, we investigate relations with various richness dependences (, , , and ), and found that correlates slightly better with . The final best-fit relation for the data, when both redshift and richness are considered, and taking into account the errors in and , is , with . The test indicates with confidence (, for 25 to 24 degrees of freedom) that richness is responsible for the improvement observed in . Richness is therefore extremely important in determining and it is in fact enough to account for the scatter observed in a simple relation. In the lower left panel of Figure 2 we plot vs. , which represent an edge-on view of the best-fit plane , and in the lower right panel we present the redshift dependence of a richness-corrected-: the redshift evolution is clear.
Although all 26 clusters shown in Figure 2 were used to compute the relations indicated by solid lines in the figure, the two clusters represented by open circles (Abell 520, and Abell 1081) seem to deviate from the trend. These clusters also have the largest (derived from the scatter in the 22 control regions), and if excluded from the fitting, the relation changes to (), indicating a slightly stronger redshift dependence.
Finally, we used 11 clusters with ROSAT X-ray luminosities to check for correlations with , but this small sample did not allow any conclusions. There is a possible trend of increasing with redshift in the sense found by Andreon & Ettori (1999) in BO’s original sample. However, there is no clear trend of with , arguing against any contamination of the relation by selection effects. A comparison of the X-ray luminosities of these clusters with their could provide new insight to the BO effect, and we are in the process of obtaining X-ray fluxes and upper limits from the RASS (Rosat All Sky Survey) for all of these clusters, as well as a larger sample of new clusters generated from DPOSS-II.
We stress that these results are not to be directly compared with fractions of blue galaxies as originally defined in BO84. The most important reason for differences is the magnitude range used to calculate . The number of blue galaxies increases at fainter magnitudes and it is therefore natural that our measurements are in general higher. Also, the usage of a rigid physical scale for all clusters, instead of regions determined individually for each cluster according to its density profile, should yield different estimates. When is computed using the same absolute magnitude range used by BO84, we find signs of evolution that are stronger than originally suggested in their work, and which are consistent with recent works by Rakos & Schombert (1995) and MdC00. Limiting our sample at brighter absolute magnitudes however increases the (and ) because of the smaller galaxy count statistics, and probes a smaller fraction of the cluster population.
4. Summary and Conclusions
We compute for 295 randomly selected Abell (1989) clusters, including galaxies as faint as to sample a larger range of the luminosity function and provide better statistics in each cluster. The resulting shows a stronger trend with redshift than did as originally defined by BO84, consistent with the idea that the BO effect is stronger among the late-type spirals and irregulars which dominate the galaxy populations at intermediate and lower luminosities.
This is the first sample large enough to allow the study of the variations at a given redshift. A test applied to a simple linear relation shows that the scatter in at a given redshift is consistently larger than the measurement error, indicating a real cluster-to-cluster variation. We investigate the richness dependence of the Butcher-Oemler effect, and find a strong correlation between and galaxy counts in the sense that poorer clusters tend to have larger than richer clusters at the same redshift. The inclusion of poor clusters tends therefore to increase the slope of the relation, and is another factor (together with the inclusion of fainter galaxies) responsible for the stronger evolution observed in this sample when compared to previous works based mostly on rich clusters.
We show that the fraction of blue galaxies in a cluster can be completely determined by its redshift and richness (within the measurement errors). The evolution in with redshift is real, and occurs at approximately the same rate for clusters of all richnesses.
References
- (1) Abell G.O., 1958, ApJS, 3, 211.
- (2) Abell G.O., Corwin H.G., Olowin R.P., 1989, ApJS, 70, 1.
- (3) Andreon S., Ettori S., 1999, ApJ, 516, 647.
- (4) Butcher H. & Oemler A.Jr., 1978, ApJ, 219, 18.
- (5) Butcher H. & Oemler A.Jr., 1984, ApJ, 285, 426.
- (6) Caldwell N. & Rose J.A., 1997, AJ, 113, 492.
- (7) Coleman G.D., Wu C-C., Weedman D.W. 1980, ApJS, 43, 393.
- (8) Connolly A.J., Csabi I., Szalay A.S., 1995, AJ, 110, 6.
- (9) Couch W.J., Ellis R.S., Sharples R.M., Smail I., 1994, ApJ, 430, 121.
- (10) Couch W.J., Barger A.J., Smail I., Ellis R.S., Sharples R.M., 1998, ApJ, 497, 188.
- (11) Djorgovski S.G., Gal R.R., Odewahn S.C., de Carvalho R.R., Brunner R., Longo G., and Scaramella R., 1999, in Wide Field Surveys in Cosmology, eds. S. Colombi, Y. Mellier, and B. Raban, Gif sur Yvette: Eds. Frontières p. 89.
- (12) Dressler A., 1980, ApJ, 236, 351.
- (13) Dressler A., Oemler A.Jr., Butcher H.R., Gunn J.E., 1994, ApJ, 430, 107.
- (14) Dressler A., Oemler A.Jr., Couch W.J., Smail I., Ellis R.S., Barger A., Butcher H.R., Poggianti B.M., Sharples R.M, 1997, ApJ, 490, 577.
- (15) Fasano G., Poggianti B.M., Couch W.J., Bettoni D., Kjærgaard P., Moles M., 2000, ApJ, in press.
- (16) Gal R.R., de Carvalho R.R., Brunner R., Odewahn S.C., Djorgovski S.G., 2000, AJ, 120, 540.
- (17) Jefferys, W.H., Fitzpatric M.J., McArthur B.E., 1988 Celest. Mech., 41, 39
- (18) Kodama T. & Bower R.G., 2000, submitted to MNRAS.
- (19) Larson R.B., Tinsley B.M., Caldwell N., 1980, ApJ, 237, 692.
- (20) Lin H., Kirshner R.P., Shectman S.A., Landy S.D., Oemler A., Tucker D.L., Shechter P.L., 1996, ApJ, 464, 60.
- (21) Margoniner V.E. & de Carvalho R.R., 2000, AJ, 119, 1562.
- (22) Metevier A.J., Romer A.K., Ulmer M.P. , 2000 AJ, 119, 1090.
- (23) Oemler A.Jr., Dressler A., Butcher H.R., 1997, ApJ, 474, 561.
- (24) Rakos K.D., Schombert J.M., 1995, ApJ, 439, 47.
- (25) Rakos K.D., Odell A.P., Schombert J.M., 1997, ApJ, 490, 201
- (26) Schlegel D.J., Finkbeiner D.P., Davis M., 1998, ApJ, 500, 525.
- (27) Smail I., Edge A., Ellis R., Blandford R., 1998, MNRAS, 293, 124.
- (28) Thuan T.X., Gunn J.E., 1976, PASP, 88, 543.