XMM-Newton monitoring of X-ray variability in the quasar PKS~0558–504 ††thanks: Based on observations with XMM-Newton, an ESA Science Mission with instruments and contributions directly funded by ESA Member States and the USA (NASA).
We present the temporal analysis of X-ray observations of the radio-loud Narrow-Line Seyfert 1 galaxy (NLS1) PKS~0558–504 obtained during the XMM-Newton Calibration and Performance Verification (Cal/PV) phase. The long term light curve is characterized by persistent variability with a clear tendency for the X-ray continuum to harden when the count rate increases. Another strong correlation on long time scales has been found between the variability in the hard band and the total flux. On shorter time scales the most relevant result is the presence of smooth modulations, with characteristic time of 2 hours observed in each individual observation. The short term spectral variability turns out to be rather complex but can be described by a well defined pattern in the hardness ratio–count rate plane.
Key Words.:
Galaxies: active – Galaxies: fundamental parameters – Galaxies: nuclei – X-rays: galaxies1 Introduction
Active Galactic Nuclei (AGN) are variable in every observable wave band. The X-ray flux exhibits variability on shorter time scales than any other energy band, indicating that the emission occurs in the innermost regions of the central engine. Therefore, a study of the X-ray variability is a powerful tool providing upper limits on the sizes of the emitting regions and the masses of central black holes and it allows one to probe the extreme physical processes operating in the inner parts of the accretion flow close to the event horizon. Although X-ray variability has been observed in AGN for more than two decades, its origin is still poorly understood. Narrow-Line Seyfert 1 galaxies (NLS1) often display rapid, large amplitude X-ray variability as well as extreme long term changes (Forster & Halpern forst (1996), Boller et al. (1997), Brandt et al. (1999)), and therefore they represent the ideal class for an X-ray temporal analysis.
| Observation date | Duration | Modea | Filterb |
|---|---|---|---|
| 00/2/7 UT11:15-13:19 | 7.2 ks | FF | M |
| 00/2/7 UT14:28-16:02 | 5.4 ks | LW | M |
| 00/2/10-11 UT23:26-3:23 | 14.0 ks | FF | T2 |
| 00/3/2 UT18.15-21:42 | 12.4 ks | FF | M |
| 00/5/24 UT17:21-21:07 | 13.6 ks | SW | M |
a Full Frame (FF), Large Window (LW), Small Window (SW).
b Medium (M), Thin 2 (T2).
PKS~0558–504 () is one of the few radio-loud NLS1. In X-rays it is characterized by a steep spectrum [the photon index ranges between 2.2 and 3.1, obtained from different instruments and energy bands (a detailed spectral analysis of XMM-Newton observations has been performed in a separate paper, O’Brien et al. (2001))], high luminosity [, with ], and strong variability. A Ginga observation (Remillard et al. (1991)) showed an increase of the X-ray flux by in 3 minutes, implying the presence of a relativistic flare. Recent ROSAT High Resolution Imager (HRI) observations (Gliozzi et al. (2000)) confirmed the presence of strong and persistent X-ray variability, which suggests the presence of a rotating black hole, and ruled out external contributions to the high luminosity and variability from other nearby sources.
In this paper we report the results of four XMM-Newton observations of PKS~0558–504 taken with the European Photon Imaging Camera (EPIC) PN, which is the best suited instrument on board the ESA satellite for timing analysis purposes, due to its high time resolution. In Sect.2 we describe the observations and data reduction. The long and short term X-ray variability are discussed in Sect.3 and Sect.4, respectively. Sect.5 contains the main conclusions and a summary.
2 Observations
PKS~0558–504 was observed with the EPIC PN camera during orbits 30, 32, 42 and 84 (corresponding to February 7 and 10, March 2 and May 24, respectively). The camera was operated in different observing modes and with various filters. In the Full Frame mode all the pixels of all CCDs are read out with time resolution of 70 ms and the full field of view ( 30′) is covered. In the Partial Window modes (Large Window and Small Window) a two dimensional imaging readout over part of the CCDs array is performed with increased time resolution (48 ms and 6 ms, respectively). The primary reason for using filters is that the EPIC CCDs are not only sensitive to X-ray photons, but also to IR, visible and UV light. Therefore for objects with high optical to X-ray flux ratio, the X-ray signal might be contaminated by those photons. This is not the case of PKS~0558–504, for which different filters were used only for calibration purposes. Table 1 provides a summary of the individual observations. The data reduction and analysis were performed using the last release of the XMM-Newton SAS (Science Analysis Software) package. From the available observations, the last reprocessed data sets without any indication of timing problems and only single events (i.e. events where the charge released by a photon is contained in a single CCD pixel) have been analyzed. The main reason for using only singles is related to the energy dependence in the relative fraction of “multiple” events. To quantify their contribution, a test with all valid events has been performed. The main effect is an increase of the count rate by and variations of the hardness ratio by , which would introduce additional uncertainties. Light curves were obtained by extracting photons from circular region of radius of 33″ around the source center and subtracting the background taken from a source-free region (which amounted to ). After confirming the lack of significant variability on time scales less than minutes, the photons were binned into 200 s intervals providing a good signal to noise ratio. PKS~0558–504 was chosen as a CAL/PV target with the purpose of investigating the photon pile-up in the EPIC cameras. With this aim we compared the spectra from the central pixels with those from the outer parts of the PSF and found no significant indication for photon pile-up.
3 Long term variability

In Fig. 1 we show the total light curve for PKS~0558–504 from February 7 to May 24 2000. Each data point is an average count rate over the individual observation in the range 0.2-10 keV. The indicated error of , represents the dispersion around the mean and gives an idea of the variability within each observation. The error bar is particularly large for the first data point because we merged two exposures (with very different mean count rates) taken during orbit 30 nearly one hour apart. The total light curve is characterized by a moderate variability, if compared with the ROSAT light curve where the count rate varied by a factor 5 in less than 3 days (Gliozzi et al. (2000)). In the EPIC PN light curve the most prominent variation in the count rate is by a factor of 2 over a period of 20 days.

We sought evidence for spectral variability by computing the hardness ratios as a function of the total 0.2-10 keV flux. As hardness ratio we define the difference between the count rates in the band and those in the band, divided by the 0.2-10 keV count rate. These ranges where chosen to provide a good signal to noise in both the soft and the hard light curves. The hardness ratios versus the total count rate with data from each observation binned in 2000 s intervals is shown in Fig. 2. The presence of a positive correlation was quantitatively tested by performing a linear least square fit, which confirmed the result at 5 confidence level. On long time scales the spectral variability is correlated with flux variations such that the spectrum becomes harder when the count rate increases.
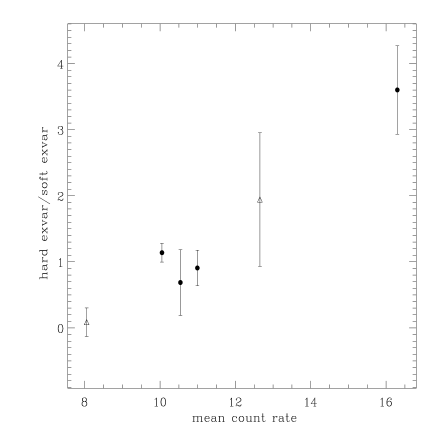
Another interesting correlation was found between the variability in the hard band and the total count rate . The variability was studied using the excess variance (Nandra et al. (1997)), which is obtained by computing the variance of the overall light curve, subtracting the variance due to measurement error and dividing by the mean squared. Care must be taken in interpreting the excess variance of different observations as it is related to the length and the sampling of the time series (e.g. Leighly 1999a ). However this drawback is circumvented in our analysis by considering the ratio between the excess variance in the hard band and that in the soft range during each individual observation. Fig. 3 shows a clear correlation between the hard to soft excess variance ratio and the mean count rate in the 0.2-10 band: the contribution of the hard band to the variability increases and becomes dominant as the mean count rate increases. From a direct inspection of the individual values of the excess variance in the soft and hard band, this behaviour turns out to be due more to the actual increase of the hard variability than to a depletion of the soft variability level.
Based on ROSAT and ASCA data Fiore et al. (1998) and Leighly (1999b ) reported the presence of correlations between variability and X-ray luminosity and the steepness of the X-ray spectrum. A first analysis seems to indicate that the XMM data of PKS~0558-504 are consistent with the previous results, however a detailed study of such correlations is beyond the scope of this paper. A spectral study of the XMM observations of PKS~0558-504 can be found in O’Brien et al. (2001).

4 Short term variability
The PKS~0558–504 EPIC PN light curves for each individual observations, binned into 200 s intervals, are shown in Fig. 4. Strong and persistent X-ray flux variability is observed during each observation. The most prominent increase in the count rate is observed during orbit 30 (February 7), when the 0.2-10 keV flux increased by a factor 2 in less than 4 hours. On the other hand the most extreme temporal variation in the count rate occurred on February 10, when the count rate decayed by in 1500 seconds. This value is in agreement with that measured by the EPIC MOS during orbit 84 (O’Brien et al. (2001)), which led to the calculation of a lower bound for the radiative efficiency which exceeds the theoretical maximum for a non rotating black hole, under the assumption that the photon diffusion through a spherical mass of accreting matter is dominated by Thomson scattering.
A visual examination of the individual light curves indicates that all of them show a similar long term variability pattern with a common rise time of about 2 hours and, in some cases, small amplitude flares superimposed. The best method to quantify time variability without the problems encountered in the traditional Fourier analysis technique in case of unevenly sampled data is a structure function analysis (e.g. Simonetti et al. (1985), Hughes et al. (1992)). The first-order structure function is the mean deviation for data points separated by a time lag , . One of the most useful features of the structure function is its ability to discern the range of time scales that contribute to the variations in the data set: the characteristic time scales of the variability are identified by the maxima and slope changes in the plane. For a stationary random process the structure function reaches a plateau state for lags longer than the longest correlation time scale. If a light curve contains cycles of period , the will rise to a maximum at (Smith et al. (1993)).
| Orbit | Count ratea | |||
|---|---|---|---|---|
| 30a | ||||
| 30b | ||||
| 30tot | ||||
| 32 | ||||
| 42 | ||||
| 84 |
a The errors on the count rate represent the dispersion around the mean.
b Excess variances are in units.

Fig. 5 shows that all the observations have either a relative or absolute maximum around 2 hours. This means that a common typical time scale (which probably reflects the similar rise time in the light curves) characterizes all observations. In addition, during orbits 30 and 84 a further characteristic time scale around 3 hours seems to be present. A first confirmation for the presence of quasi-periodicity in the temporal behaviour of PKS~0558–504 comes from a periodogram analysis, which yielded a strong signal at 2.3 hr. However, further longer observations are necessary for a firm confirmation.
In order to seek evidence for spectral variability and for its origin on short time scales we have split each of the broad band light curves into a hard and a soft light curve and plotted the hardness ratios versus the time. While during orbits 32 and 84 (when the flux was at intermediate values) no significant spectral variability was found, orbits 30 and 42 present an interesting and somewhat puzzling spectral and temporal behaviour shown in Fig. 6 and Fig. 7, respectively. The mean count rates and the excess variances in the soft, hard and broad bands are summarized in Table 2.

During the first exposure of orbit 30 the variability, quantified by the excess variance is strongly dominated by the soft photons (, for the soft and the hard band respectively), with the soft flux steadily increasing and the hard fluctuating around a constant value. As a consequence, while the total flux increases the hardness ratio decreases in time, with a slope of /hr obtained from a linear least square fit. A totally different trend is observed during the second exposure, starting just one hour later. In this case the variability is dominated by the hard flux (, for the hard and soft band, respectively), which increases faster than the soft emission and seems to peak before it. The hardness ratio is steadily increasing with the total flux and the time (slope: /hr). A similar spectral behaviour is observed during orbit 42: the variability is strongly dominated by the hard flux () and the spectrum becomes harder when the total count rate increases (slope: /hr).
On the basis of the five exposures available (two for orbit 30 and one each for orbits 32, 42 and 84), the spectral variability on short time scales of PKS~0558–504 can be summarized in the following way: when the average broad band count rate is at a low level (the mean value is around ), the variability is dominated by the soft photons and the hardness ratio decreases as the total flux raises. Conversely, when the average count rate is above a certain level ( and for the second exposure of orbit 30 and orbit 42, respectively), the variability is dominated by the hard band and the spectrum becomes harder when the count rate increases. At intermediate values of count rate (the mean is around both for orbit 32 and 84), the variability in the two bands is very similar and no significant spectral variability is detected.

5 Summary and conclusions
We have presented the results of the EPIC PN observations of the NLS1 PKS~0558–504 taken during the Cal/PV phase. We found:
-
•
During the XMM pointings PKS~0558–504 showed a moderate but persistent variability both on long (months) and short (minutes and hours) time scales.
-
•
Strong correlations between hardness ratio and total flux have been found. When the mean flux is above a certain threshold, the spectrum becomes harder as the count rate increases. When the flux is below a certain level, the spectral behaviour is in the opposite sense. At intermediate count rates no significant spectral variability is observed.
-
•
A further strong correlation between the broad band flux and the variability (expressed in terms of excess variance) in the hard energy band has been discovered: the contribution to the total variability of the hard band increases and becomes dominant as the mean count rate raises.
-
•
In all the observations the variability is characterized by smooth similar modulations, with typical time scale hr, determined with the structure function analysis.
-
•
The most extreme temporal variation of the count rate implies a radiative efficiency slightly larger than the theoretical maximum for accretion onto a Schwarzschild black hole. It is important to point out that this is a strictly lower limit, since during our analysis only single events (which represent of the total X-ray photons collected) have been used.
A detailed model of PKS~0558–504 which accounts for all timing and spectral features discovered is beyond the scope of this paper. Therefore, we limit ourselves to some general considerations. The most intriguing result is the tentative detection of a common characteristic time scale of 2 hours. However a confirmation of this characteristic time scale has to await for longer observations, to sample a higher number of cycles. A more detailed analysis to assess its significance and robustness (e.g. as in Boller et al. (2001)) is deferred to a follow-up publication. This time scale might be associated to periodic phenomena occurring in the accretion disk, whose contribution seems to be dominant also on the basis of the spectral analysis of EPIC MOS data (O’Brien et al. (2001)). Two possible explanations which need to be quantitatively tested are: i) the presence of a hot spot orbiting the black hole and ii) the precession of the inner part of the accretion disk caused by misalignment of black hole and disk rotational axes. An alternative tempting hypothesis involves the presence of a jet: as PKS~0558–504 is a radio-loud object, beamed emission from a jet could partly contribute to the brightness and variability in X-rays. Radio-loud quasars are known to have flatter X-ray spectral indices than radio-quiet ones, and they are also known to be brighter X-ray sources (e.g. Yuan et al. (1998)). A widely accepted explanation for this fact is that the X-ray emission includes an additional harder component associated with the radio jet. In this scenario a naive interpretation of the temporal and the spectral variability associated with changes of the broad band flux, involves the presence of either a precessing jet or moving knots with helical trajectories in a relativistic magnetized jet (Camenzind & Krockenberger came (1992)). At this point it is worth noticing that also in one other of the few radio-loud NLS1, RX J0134.2–4258, the spectral variability (characterized, as in our case, by a hardening of the spectrum during the flux increase) was tentatively interpreted as due to the jet emission (Grupe et al. (2000)).
The exciting results from the temporal analysis of a few short exposures demonstrate the extraordinary capabilities of XMM, in particular in light of the long observations possible in virtue of the highly eccentric orbit.
Acknowledgements.
The XMM - Newton project is supported by the Bundesministerium für Bildung und Forschung / Deutsches Zentrum für Luft- und Raumfahrt (BMBF/DLR), the Max-Planck Society and the Heidenhain-Stiftung. EPIC was developed by the EPIC Consortium led by the Principal Investigator, Dr. M.J.L. Turner. The consortium comprises the following Institutes: University of Leicester, University of Birmingham, (UK); CEA/Saclay, IAS Orsay, CESR Toulouse, (France); IAAP Tuebingen, MPE Garching, (Germany); IFC Milan, ITESRE Bologna, IAUP Palermo, (Italy). EPIC is funded by: PPARC, CEA, CNES, DLR and ASI. MG acknowledges support from the European Commission under contract number ERBFMRX-CT98-0195 (TMR network “Accretion onto black holes, compact stars and protostars”).References
- et al. (1997) Boller Th., Brandt W.N., Fabian A.C., Fink H.H., 1997, MNRAS 289, 393
- et al. (2001) Boller Th., Keil R., Trümper J. et al., 2001, A&A 365 (this issue)
- et al. (1999) Brandt W.N., Boller Th., Fabian A.C., Ruszkowski M., 1999, MNRAS 303, L53
- (4) Camenzind M., Krockenberger M., 1992, A&A 255, 59
- et al. (1998) Fiore F., Laor A., Elvis M., Nicastro F., Giallongo E., 1998, ApJ 503, 607
- (6) Forster K., Halpern J.P., 1996, ApJ 468, 565
- et al. (2000) Gliozzi M., Boller Th., Brinkmann W., Brandt W.N., 2000 A&A 356, L17
- et al. (2000) Grupe D., Leighly K.M., Thomas H,-C., Laurent-Muehleisen S.A., 2000, A&A 356, 11
- et al. (1992) Hughes P.A., Aller H.D., Aller M.F., 1992, ApJ 396, 469
- (10) Leighly K.M., 1999a, ApJS 125, 297
- (11) Leighly K.M., 1999b, ApJS 125, 317
- et al. (1997) Nandra K., George I.M., Mushotzky R.F., Turner T.J., Yaqoob T., 1997, ApJ 476, 70
- et al. (2001) O’Brien P.T., Reeves J.N., Turner M.J.L. et al., 2001, A&A 365 (this issue)
- et al. (1991) Remillard R.A., Grossman B., Bradt H.V., Ohashi T., Hayashida K., et al., 1991, Nat 350, 589
- et al. (1985) Simonetti J.H., Cordes M.J., Heeschen D.S., 1985, ApJ 296, 46
- et al. (1993) Smith A.G., Nair A.D., Leacock R.J., Clements S.D., 1993, AJ 105, 437
- et al. (1998) Yuan W., Brinkmann W., Siebert J., Voges W., 1998, A&A 330, 108