XMM-Newton survey of the low-metallicity open cluster NGC 2516
We present the first results of an XMM-Newton EPIC survey of NGC 2516, a southern low-metallicity open cluster with an age close to the Pleiades. The attained limiting sensitivity is of erg sec-1 cm-2 in the 0.1–4.0 keV bandpass. This has been achieved by summing the data of the MOS and PN cameras of two distinct observations for a total exposure time of 33 ks and by analyzing the summed data set with the wavelet detection algorithm developed at Osservatorio Astronomico di Palermo (OAPA) that has yielded over 200 X-ray detections. Using data just from a single exposure or from a single camera would have reduced by a factor 2–4 our limiting sensitivity and would have resulted in 25–40% less X-ray detections. To date, 129 detections have as counterparts one or more of the 540 photometrically selected cluster members in the surveyed region, for a total of 147 likely detected members, with unique identification in 112 cases. We derive the X-ray luminosity functions (XLF) of NGC 2516 members of different spectral types and compare them with those of the more metal rich, approximately coeval Pleiades cluster, finding the NGC 2516 photometrically selected dG and dK stars less luminous than the Pleiades. The XLFs of the NGC 2516 and of the Pleiades dM stars are indistinguishable. We compare the XMM-Newton results with those recently obtained with Chandra.
Key Words.:
Open clusters and associations: NGC 2516 – Stars: coronae – X-rays: stars – Stars: open clusters1 Introduction
NGC 2516 has been chosen as an XMM-Newton calibration target in order to “bore sight” the alignment of the X-ray telescope as well as the relative positions of the EPIC cameras CCDs since it is a region rich of X-ray emitting young stars. Apart from this role in the early phase of the XMM-Newton mission, NGC 2516 plays an important role in the study of stellar physics. It is a southern, relatively nearby ( 387 pc; Jeffries et al. (1997)), open cluster with metallicity below solar ([Fe/H] = 0.320.06, Jeffries et al. (1997); 0.42, Cameron (1985); 0.180.08, Jeffries et al. (1998)), affected by moderate extinction (), and an age ( 108 yr) similar to that of the Pleiades.
Because of its metallicity, it plays a crucial role in exploring the relation between stellar structure, metallicity, and coronal emission level. Such a relation is expected to exist since metallicity affects the depth of the convection zone that in turn should affect the efficiency of dynamo action, of which X-ray luminosity is a proxy (cf. discussion in Micela et al., 2000). Indeed Jeffries et al. (1997), based on ROSAT-PSPC data, have found that the brightest X-ray luminous dG NGC 2516 members are less luminous than the brightest X-ray luminous solar-metallicity, similar age, dG in the Pleiades. More recently Harnden et al. (2000), based on Chandra data, have found that the median X-ray luminosity of NGC 2516 dF stars is higher than that of the Pleiades, while there is an indication of the NGC 2516 dG and dK being less X-ray luminous than the Pleiades (albeit this result can be subject to uncertainties in assessing member status). The availability of deep XMM-Newton data allow us to further investigate this matter.
Our paper is organized as follows: in §2 we will describe the X-ray data and analysis, in §3 we will describe the results we have obtained and in §4 we will summarize and discuss our findings.
2 X-ray Observations and data analysis
| Obs ID | RA (h m s) | Dec (d m s) | Exp. Timea | Clean Exp. Timeb | Obs Date |
|---|---|---|---|---|---|
| A | 7 58 33 | 60 52 54 | 7.7 ks | 7.2 ks | 12 March 2000 |
| B | 7 58 29 | 60 53 32 | 20.0 ks | 18.6 ks | 6 April 2000 |
| C | 7 58 29 | 60 53 32 | 17.0 ks | 15.1 ks | 7 April 2000 |
| D | 7 58 18 | 60 47 13 | 29.2 ks | 22.8 ks | 10 June 2000 |
a - Exposure times are for the PN camera. The MOS camera ones usually differ only by a few hundreds of seconds, except for observation D for which MOS exposure times are 2 ks shorter. b - Cleaned exposure times are essentially the same for MOS and PN cameras.
During the calibration phase, lasted until July 1-st 2000, NGC 2516 has been observed 4 times (cf. Table 1) with the XMM-Newton EPIC constituted of 2 MOS (Turner et al. (2000)) and 1 PN (Strüder et al. (2000)) cameras. In all cases observations have been performed with the thick filter in the optical path. The four data sets differ not only for exposure times, but also for the influence of random rapid increases in the background level that occurs with erratic durations as result of intense flux of soft protons in the earth’s magnetosphere, pseudo-focussed by the mirror system (cf. Jansen et al. (2000); Turner et al. (2000); and Strüder et al. (2000)). Since those episodes dominate the overall background level, in order to achieve the deepest limiting sensitivity we have screened out those offending time segments. The resulting “cleaned” exposure times are summarized in Table 1. As a matter of fact, for these four observations, we have to reject only a small fraction of the exposure times, but with a substantial reduction in the background level. Outside of these episodes we have observed a quite stable background level. Data have also been cleaned to remove electronic noise that affects the MOS cameras and defects in CCD chips, such as dead or hot pixels. Most of the data-cleaning procedure is currently performed by the Standard Analysis System (SAS) reduction chains (procedures emchain and epchain), but a few hot pixels in the MOS cameras and one hot column in the PN camera have been removed afterwards. We have also rejected those events that because of their characteristics are unlikely to be bona-fide X-rays111 As a technical detail we have retained only those events whose PATTERN is 12 and FLAG is 10..
We have analyzed the observations B and C that are pointed toward the same direction. As a first step we have considered the data of the three EPIC cameras, 2 MOS (Turner et al. (2000)) and 1 PN (Strüder et al. (2000)) and of the B and C observations, separately. By cross-matching the individual source lists we have been able to derive: i) the relative spatial registering of the two MOS cameras (their mean relative alignment is currently of 1′′ with a rms of 3′′) as well as that of the PN one; ii) a preliminary absolute spatial registering of the MOS cameras that is currently accurate to 3′′ as measured by the median offset between X-ray and optical positions. These latter are taken from the catalogue we have used for identification purpose. By cross-matching the positions of the more than 100 sources detected by using the SAS task edetect_chain on the individual MOS and PN data sets of the observation B we have found that at the time this work was done (end of Sept. 2000) an offset and a rotation are required to reconcile the PN and MOS astrometry; the major effect being a shift of the MOS derived positions of about 10′′ north of the PN ones. We have verified that the derived correction parameters work well also for observation C. As we have discussed (cf. also Fig. 2 below), the MOS astrometry is in reasonable agreement with optical positions, hence we have “moved” the PN data to the MOS astrometric system and have summed in a single data set the 6 distinct MOS and PN data sets of the observations B and C.
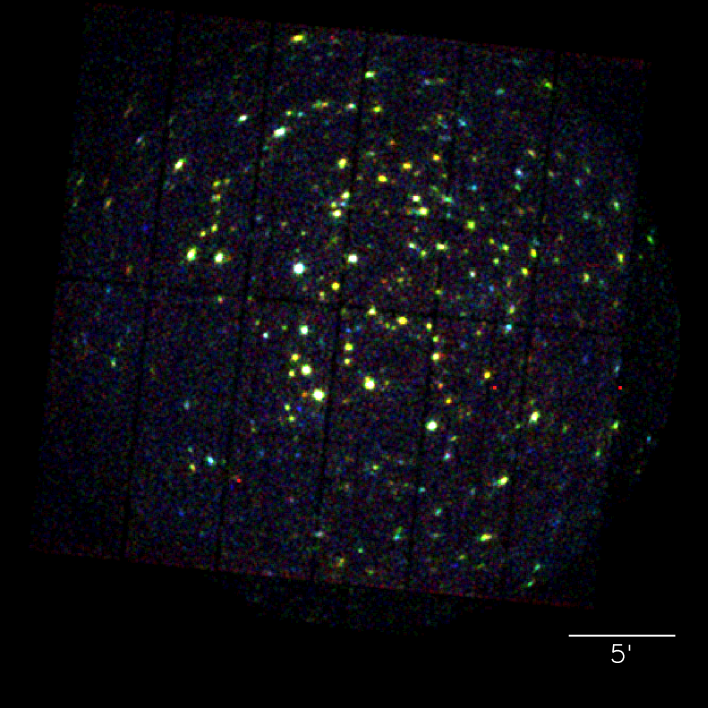
Since our aim was to reach the deepest limiting sensitivity and we are interested in the study of coronal emission from normal stars we have further restricted our following analysis to photons with energy in the 0.3–4.0 keV bandpass222Events with energy below 0.3 keV are largely unrelated to bona-fide X-rays.. With this choice we have reduced the number of image counts (largely dominated by background events in our case) from 376.0 to 259.5 kcnt, i.e. we have effectively reduced the background level by about 45%. The resulting summed image is shown in Fig. 1, with different color coding for the spectral distribution of collected counts in each image pixel. Summed data have then been searched for deriving the final list of sources (see below).
It is worth mentioning that the data have been analyzed without including the spacecraft history file (i.e. no detailed aspect information was available to us at the time this work has been done) and the pointing of the telescope was assumed to be stable at the nominal value. The quality of the resulting summed image makes us confident that fluctuations in spacecraft pointing have introduced only minor effects.
At the time this work has been done SAS had not full provision for the analysis of summed data sets, so we have to use tools coming from various packages (SAS, IRAF, FTOOLS, IDL) as well as some ad-hoc developed code. In particular, source detection on the summed data set has been performed with a wavelet transform (WT) detection algorithm developed at Osservatorio Astronomico di Palermo specifically for the XMM-Newton EPIC data. The basic features of this code are inherited from the ROSAT/PSPC version (Damiani et al. 1997a,b). Briefly, it performs a multi-scale analysis of the data, efficiently detecting sources ranging in size from point-like to a few arcminutes. The newest features of the XMM-Newton WT code include: the operation on images with pixel size of 2′′, the full scan of the entire image at all explored scales to take advantage of the almost uniform width (HEW 15′′) of the XMM-Newton PSF (cf. Jansen et al. (2000)). Further details on this algorithm will be presented by Damiani et al. (in preparation). In the present application we have searched the image at four distinct scales from 4′′ to 11′′.3, more than adequate for detecting point-like sources. In order to derive the appropriate detection threshold that limits spurious detections to the desired number (chosen here as 1 per field) we have performed a large set of simulations of pure-background EPIC images with the same exposure map and the same background level as the actual data set we have analyzed. We have found 208 sources (with one predicted spurious) and have measured their net counts. Sources as faint as 25–30 counts have been detected.
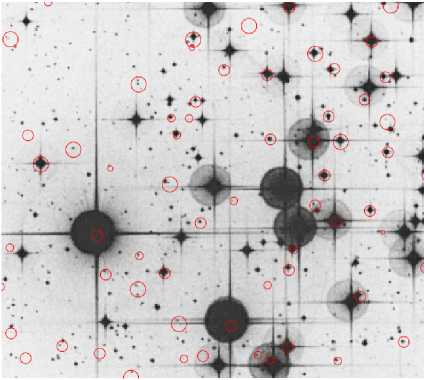
Given the assumption that we have made on pointing stability, it is quite reassuring that the overall attained positional accuracy is quite good and is within expectations. This is well illustrated in Fig. 2 where we have overlayed circles centered at the X-ray source positions on the DSS image of the central part of the surveyed region.
2.1 X-ray flux and luminosity determination
In order to derive source count rates we have computed (using SAS) the exposure maps for the 6 (3 cameras 2 observations) distinct data sets we have used deriving the total exposure map that we have adopted in the rest of our analysis. We have to remember that the MOS (Turner et al. (2000)) and PN (Strüder et al. (2000)) cameras have distinctly different effective areas, or in other words the number of counts collected for a given source is different in the MOS and PN cameras. In order to circumvent this difficulty we have computed from the actual data the ratio of MOS1, MOS2 and PN source counts. The median of the ratio of PN and single-MOS collected counts, in the 0.3–4.0 keV band, is 2.5, i.e. on average the PN camera collects 2.5 times more counts than each single MOS camera. This factor has been included in the derivation of the summed exposure map. We recognize that a) this factor could be a function of source intrinsic spectrum and b) its determination is subject to uncertainties since measured ratios have a somewhat large scatter. In deriving X-ray flux we have assumed a conversion factor from counts to intrinsic source flux in the 0.1–4.0 keV bandpass333We have chosen this bandpass for easy comparison with published ROSAT and Chandra results., as computed (using PIMMS) for a Raymond-Smith spectrum with =0.54 keV and cm-2, of erg cm-2 cnt-1 for a single MOS camera. We note that this broad band conversion factor is rather insensitive to metallicity variations up to a factor 3. With the above conversion factor, the net exposure time of 33 ks of the summed B+C data set, translates to an equivalent 150 ks of a single MOS camera (or to an equivalent 60 ks of the PN camera).

The single-MOS equivalent rate of weaker sources is cnt sec-1 (indeed we have detected only three sources below this value), that corresponds to erg sec-1 cm-2, well below the limiting sensitivity ( erg sec-1 cm-2), achieved by the 60 ks ROSAT-PSPC observation analyzed by Jeffries et al. (1997), and with a spatial resolution (EPIC FWHM 6′′) better than the PSPC whose PSF had a FWHM of 20′′. Summing all the available data allows us to reach the deepest possible limiting sensitivity. With the data taken just with observation B we would have reached a limiting sensitivity of erg sec-1 cm-2, and erg sec-1 cm-2 for a single MOS and the PN cameras, respectively. Summing up the data of all cameras for the observation B we would have reached a limiting sensitivity of erg sec-1 cm-2, detecting only about 160 sources. From the above numbers, is is also clear that, for exposure greater than 20 ks EPIC enters in the background-limited regime and the limiting sensitivity does not scale linearly with exposure time444Thanks to the sharp Chandra PSF an ACIS-I observation starts to become background-limited for exposure time greater than 200 ks..
The deepest (i.e. on-axis) limiting sensitivity of the present XMM-Newton 33 ks observation is similar to that attained, again on-axis, with a 20 ks Chandra ACIS-I observation (Harnden et al. (2000)), and it varies by a factor 2 within the central 11 arcmin region (to be compared with a factor 5 variation in the case of Chandra); in other words the present XMM-Newton observation has a total grasp (for the FOV in common) that is 2 times better than the Chandra one. Since the present observation has been done with the thick filter we expect that, under the assumption of an approximately constant background level, the attainable limiting sensitivity (in the somewhat soft band we have considered) could benefit from the use of the medium (or the thin) filter.
In order to gain further confidence in the adopted procedure we have compared the XMM-Newton EPIC X-ray luminosities with those derived from Chandra observations (Harnden et al. (2000)) for the members detected by both observatories. The resulting scatter plot in Fig. 3 shows a good agreement, especially if one considers source variability, of which we have found clear evidence in the XMM-Newton data, as well as different source spectra. As matter of fact we have detected 108 out of the 147 Chandra ACIS-I sources, and we have detected 34 new sources in the common FOV. A large fraction of the new sources falls in the external part of the Chandra FOV. About half of the sources missed with EPIC have been detected in the central part of the Chandra FOV corresponding to a somewhat external and less sensitive region of the EPIC FOV, the others are likely to be variable. As stated above we have found clear evidence of variability that will be discussed in a forthcoming paper. Deeper limiting sensitivity will be reached by including in a future analysis the data from observations A and D 555Since we are already in the background-limited regime we estimate to improve the limiting sensitivity by a factor for the about twofold increases in the exposure time..
3 Results
3.1 Cluster Members and Identifications
| Spectral Type: | B | dA | dF | dG | dK | dM |
|---|---|---|---|---|---|---|
| Entire XMM-Newton FOV | ||||||
| Observed | 31 | 43 | 34 | 80 | 205 | 146 |
| Detected | 14 | 11 | 16 | 31 | 49 | 26 |
| Perc. Det. | 45% | 26% | 47% | 39% | 24% | 18% |
| XMM-Newton and Chandra Survey common FOV | ||||||
| Observed | 23 | 23 | 17 | 32 | 67 | 40 |
| Detected | 10 | 8 | 14 | 19 | 32 | 14 |
| Perc. Det. | 43% | 35% | 82% | 59% | 48% | 35% |
| Sp. | color | NGC 2516 | Pleiades | |
|---|---|---|---|---|
| type | range | Ent. FOV | Restr. FOV | |
| B | 0 | 28.75 | 28.75 | … |
| dA | 0 0.3 | (28.75) | (28.75) | … |
| dF | 0.3 0.5 | 28.91 | 29.35 | 29.20 |
| dG | 0.5 0.8 | (28.92) | 28.96 | 29.25 |
| dK | 0.93 2.2 | (28.74) | 28.91 | 29.21 |
| dM | 2.2 | (28.67) | (28.67) | 28.85 |
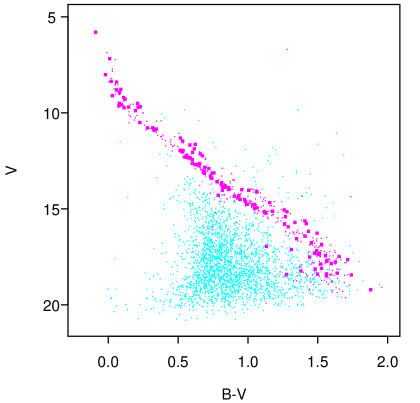
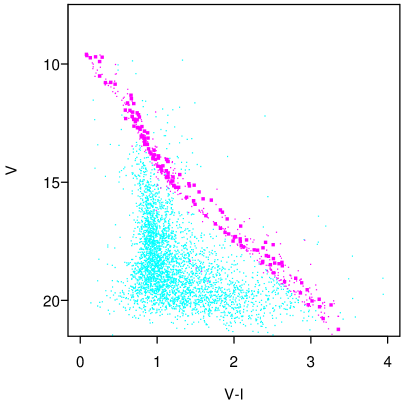
Color-magnitude diagrams (CMD) of the NGC 2516 photometrically determined members in the present survey are shown in Fig. 4, together with all available photometric data of surveyed non-members. Photometry for the fainter stars is from a new catalogue (Jeffries, Thurston and Hambly, in preparation), while for stars brighter than it is a collection of data coming from various sources (cf. Jeffries et al. (1997)). Cluster membership has been assigned by selecting stars within bands around fiducial main sequences in HR diagrams of vs. and vs. , following a procedure described by Thurston (2000) and reported by Harnden et al. (2000). Our final list comprises those stars fulfilling one of the above criteria666We have verified that adopting the more restrictive selection in which both criteria have to be meet does not change our results., when all three colors are available, and the vs. criterion alone, for the reddest stars having no measurement. In summary, we have 540 likely photometric members out of 4117 objects with known photometry and falling in the XMM-Newton field-of-view (FOV). Table 2 gives the number of members observed and detected (and the detected fraction) grouped according to spectral types (B, dA, dF, dG , dK, and dM) photometrically assigned on the basis of reddening-corrected color ranges. One late-type giant falls in the FOV and has not been detected. In the same table we report also the same quantities, but for the restricted FOV in common with the Chandra survey (Harnden et al. (2000)). Identifications with X-ray sources have been performed through positional matching with a match radius of 10′′. We have chosen this somewhat generous value to account for current limitation in the absolute aspect reconstruction. Indeed with a match radius smaller than 8′′ we would have lost bona-fide identifications. Over the entire FOV we have found 112 detections having a single cluster member as counterpart, 16 detections having 2 members as counterparts and 1 detection having 3 members as counterparts. The percentage of chance coincidence between cluster members and X-ray sources is 7%, making us confident on the reliability of our identification procedure. The table shows also that in the entire XMM-Newton FOV 24% of surveyed cluster members have been detected, while the detection fraction increases to 47% in the smaller region in common with Chandra. We will see in the following that distinguishing between those two regions is important in interpreting some of our results.
There are 79 (208129) detections not associated with known cluster members. We have found at least one counterpart (in the catalogue we have used) for other 39 sources, however we expect 28 spurious identifications (by chance coincidence) among the non-members. Since we have found 81 counterparts among the non-members, about 34% of them are likely to be spurious identifications. Many of these objects, as well as the non-identified ones, are likely to be of extragalactic nature, a few others identified with stars above the NGC 2516 main sequence, should be at smaller distances than NGC 2516, and they are likely members of the young nearby stellar population present in all X-ray surveys (Favata et al. (1993)), or given the pointing direction, members of the Gould Belt (Guillout et al. (1998)). Due to the “fuzzy” main-sequence definition at faint magnitudes, a fraction of the sources identified with red stars could be faint cluster members.
3.2 X-ray Luminosity Functions
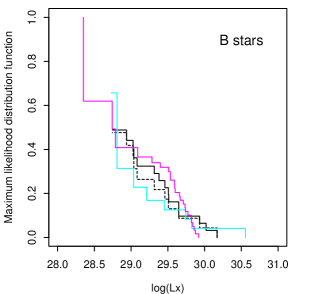
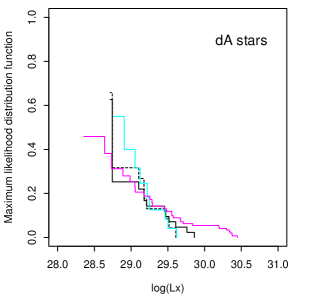
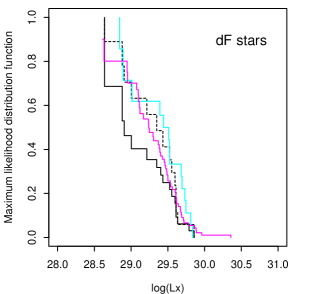
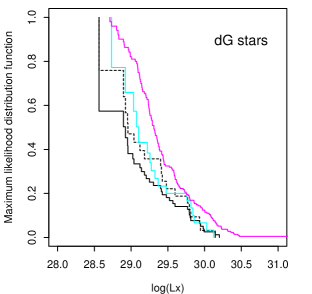
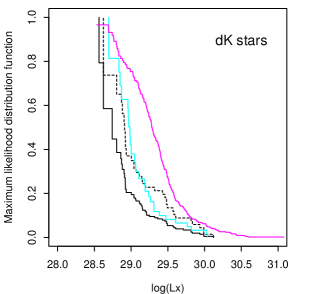
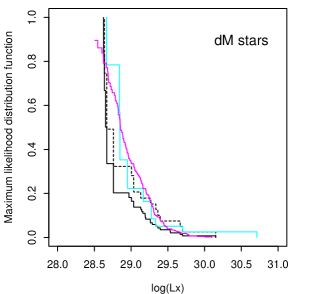
Including detections and upper-limits and making use of the maximum-likelihood Kaplan-Meier estimator of integral distribution functions in case of censored data (cf. Schmitt (1985); Feigelson and Nelson (1985)) we have computed the X-ray luminosity functions shown in Fig. 5 for various groupings of spectral types (B, dA, dF, dG, dK, and dM). In some cases XLFs do not reach the unity since there are upper limits below the lowest detection so that we have no information below this value. In general, the XLFs computed over the entire XMM-Newton FOV tend to be lower than those computed in the more restricted FOV. Applying two-sample tests for censored data, we found the difference being highest in the case of dK stars (confidence level above 99%), and less significant (confidence level 93%) for the dF and dM stars, while for the B, dA, and dG stars the test is inconclusive. In the case of dF, dK and, more marginally, dG stars the XLFs computed over the entire FOV have a lower medians than that derived in the more restricted FOV.
For all the considered spectral types the NGC 2516 XMM-Newton XLFs derived considering only the stars in the Chandra FOV are statistically indistinguishable from those derived with Chandra. In the case of B, dA, and dG stars we have not found statistical significant difference between the XLFs derived over the entire XMM-Newton FOV and those derived from Chandra data (Harnden et al. (2000)), while we have found an indication (at 95% confidence level) of difference in the cases of dF and dM stars, and a clear difference (at a confidence level higher than 99.9%) in the case of dK stars, but, as we explain below, field star contamination can be a plausible explanation for these findings.
In comparing the NGC 2516 XMM-Newton XLFs with those of the Pleiades (Micela et al. (1999)) we have found that, irrespectively of the region of the XMM-Newton FOV we are considering, the XLFs of B, dA and dF stars cannot be distinguished (above the 90% confidence level), while the XLFs of dK stars are different at a confidence level higher than 99.9%. Considering the entire XMM-Netwon FOV the XLFs of dG and dM stars are different at 99.9% level, but, when we limit the analysis to the Chandra FOV, the statistical confidence reduces to 97% in the case of dG stars, and no difference can be found for the dM stars.
The NGC 2516 XLFs of dG and dK we have derived over the entire EPIC FOV reinforce the suggestion based on Chandra data that NGC 2516 members are less X-ray luminous than the Pleiades members of analogous spectral type. This results is particularly strong in the case of dK stars. Table 3, which compares the median values for NGC 2516 and the Pleiades, indicates that X-ray luminosities are highest for dF and dG stars.
4 Summary and Conclusions
NGC 2516 was chosen as a calibration target in order to “bore sight” the alignment of the X-ray telescope with the XMM-Newton detectors, however this cluster is of particular scientific interest since, being metal-poor with respect to the Sun, it allows us to explore the effect of metallicity on coronal emission level. Using a 33 ks long EPIC data set obtained by summing the data, all taken with the thick filter, of the three distinct EPIC cameras of two distinct co-pointed observations we have reached a limiting sensitivity of erg sec-1 cm-2 and have detected 208 sources. Using only data from a single observation and/or from the MOS or PN cameras alone we would have reached a factor 2–4 worst sensitivity and would have detected substantially less sources. The attained limiting sensitivity has allowed us to derive luminosity functions of NGC 2516 members with a larger number of detected members with respect to the Chandra survey (Harnden et al. (2000)). Together with better photometry made available to us before publication (Jeffries, Thurston and Hambly, in preparation), the XMM-Newton calibration observations have enabled us to investigate the late-type population of cluster members and to explore their coronal emission properties.
dG and dK stars in NGC 2516 tend to be less luminous than the same spectral type Pleiades members reinforcing the indication coming from the recent analysis of Chandra observations (Harnden et al. (2000)). NGC 2516 dM members have the same coronal emission level of their Pleiades counterparts, confirming the ROSAT HRI-based suggestion of Micela et al. ((2000)) that the activity level for dM stars is insensitive to a change of a factor of two in stellar metallicity. On the other hand, we find that the median value for NGC 2516 dF-type stars when evaluated on the entire EPIC FOV is lower than that of the Pleiades, while it has been found higher than that of the Pleiades analyzing Chandra data. Indeed when we restrict the analysis to the dF stars in the Chandra survey FOV we recover the Chandra result. Since the Chandra FOV is offset pointed with respect to the XMM-Newton one, we do not think that the above findings can be explained by considering that we have preferentially included members surveyed in the lower sensitivity outer part of the XMM-Newton FOV where we would expect a lower detection percentage. A more viable explanation is that the true members are spatially concentrated, whereas the contaminating non-members are uniformly distributed. In such a picture the Chandra observation is pointed where the cluster members are concentrated while the present XMM-Newton survey is pointed in a less central cluster region, explaining our finding. However other explanations are possible and further investigations are required.
Lacking astrometric proper motion studies and extensive radial velocity surveys of NGC 2516 stars we have been forced to base our study on photometrically selected members. Such selection is subject to contamination from field stars that by chance have the same magnitude and colors as true NGC 2516 members. Based on the very good quality of the photometry we have used, clearly shown by the CMDs in Fig. 4, we think that contamination should not be too severe (but it could be as large as 15–20%). However, it is clear that to be able to draw firmer conclusions regarding metallicity effects on coronal emission it is crucial that an improved list of members be obtained complementing available photometric data with high precision proper motion studies (unfortunately NGC 2516 average motion is only marginally different from the solar reflected one) and with an extensive campaign of radial velocity measurements.
Acknowledgements.
Based on observations obtained with XMM-Newton, an ESA science mission with instruments and contributions directly funded by ESA Member States and the USA (NASA). EPIC was developed by the EPIC Consortium (P.I., Dr. M. J. L. Turner). The consortium comprises the following Institutes: University of Leicester, University of Birmingham, (UK); CEA/Saclay, IAS Orsay, CESR Toulouse, (France); IAAP Tuebingen, MPE Garching,(Germany); IFC Milan, ITESRE Bologna, Osservatorio Astronomico di Palermo, Italy. EPIC is funded by: PPARC, CNES, DLR and ASI. SS, GM, FD and EF acknowledge partial support by Agenzia Spaziale Italiana and Ministero della Ricerca Scientifica e Tecnologica. NG is supported by the European Union (Marie Curie Individual grant; HPMF-CT-1999-00228). KRB and JPP acknowledge the financial support of the UK Particle Physics and Astronomy Research Council.References
- Cameron (1985) Cameron L. M. 1985, A&A, 147, 39
- Damiani et al. (1997a) Damiani F., Maggio A., Micela G., Sciortino S. 1997a, ApJ, 483, 350
- Damiani et al. (1997b) Damiani F., Maggio A., Micela G., Sciortino S. 1997b, ApJ, 483, 370
- Favata et al. (1993) Favata F., Barbera M., Micela G., Sciortino S. 1993, A&A, 277, 428
- Feigelson and Nelson (1985) Feigelson E. D., Nelson P. I. 1985, ApJ, 293, 192
- Guillout et al. (1998) Guillout P., Sterzik M.F., Schmitt J.H.M.M., Motch C., Neuhaeuser R., 1998, A&A, 337, 113
- Jansen et al. (2000) Jansen F., Lumb D., Altieri B. et al. 2001, A&A, 365 (this issue)
- Jeffries et al. (1997) Jeffries R. D., Thurston M. R., Pye J. P. 1997, MNRAS, 287, 350
- Jeffries et al. (1998) Jeffries R. D., James D. J., Thurston M. R. 1998, MNRAS, 300, 550
- Harnden et al. (2000) Harnden F. R., Jr., Adams N. R., Damiani F., et al. 2000, ApJL, in press.
- Micela et al. (1999) Micela G., Sciortino S., Harnden F. R. Jr., et al. 1999, A&A, 341, 751
- Micela et al. ((2000)) Micela G., Sciortino S., Jeffries R.D., Thurston M.R., Favata F. 2000, A&A, 357, 909
- Schmitt (1985) Schmitt J.H.M.M. 1985, ApJ, 293, 178
- Strüder et al. (2000) Strüder L., Briel, U., Dennerl, K. et al. 2001, A&A, 365 (this issue)
- Turston (2000) Thurston M. R. 2000, Ph. D. Thesis, University of Birmingham
- Turner et al. (2000) Turner M. J. L., Abbey, A., Arnaud, M. et al. 2001, A&A, 365 (this issue)