Damped Lyman- absorption from a nearby Low Surface Brightness galaxy11affiliation: Based on observations with the NASA/ESA Hubble Space Telescope, obtained at the Space Telescope Science Institute, which is operated by the Association of Universities for Research in Astronomy, Inc., under NASA contract NAS5-26555. 22affiliation: Based on observations obtained with the Apache Point Observatory 3.5 m telescope, which is owned and operated by the Astrophysical Research Consortium.
Abstract
Ground-based & HST images of the nearby galaxy SBS 1543+593 () show it to be a Low Surface Brightness (LSB) galaxy with a central surface brightness of mag arcsec-2 and scale length 0.9 kpc, values typical for the local LSB galaxy population. The galaxy lies directly in front of the QSO HS 1543+5921 (); an HST STIS spectrum of the quasar reveals a damped Ly (DLy) line at the redshift of the interloper with an H I column density of (H I), as well as several low-ionization metal lines with strengths similar to those found in the Milky Way interstellar medium. Our data show that LSB galaxies are certainly able to produce the DLy lines seen at higher redshift, and fuels the speculation that LSB galaxies are a major contributor to that population of absorbers.
1 Introduction
In the course of spectroscopic follow-up observations of quasar candidates in the Hamburg Quasar Survey, a redshift of was measured for the QSO HS 1543+5921. However, Schmidt-plate images showed the object to be very extended, suggesting that the QSO might be centered on a low redshift galaxy. Follow-up observations by Reimers & Hagen (1998, hereafter RH98) found the QSO to be aligned with the foreground galaxy SBS 1543+593, and measurement of an H II region in a spiral arm revealed the galaxy to be at .
Although detecting QSOs close to nearby galaxies is not difficult, finding one which shines through the center of a galaxy and which is bright enough to be observed spectroscopically with HST is extremely rare. In this paper we present ground-based and HST optical images of SBS 1543+593 and show that the galaxy is actually a Low Surface Brightness (LSB) galaxy. We also present an HST spectrum of the background QSO HS 1543+5921, which reveals a damped Ly (DLy) absorption line at the redshift of the foreground galaxy.
2 Imaging: Galaxy Properties
Three 300 sec -band exposures of the QSO-galaxy pair were taken 05 Aug 2000 at the ARC 3.5 m telescope using SPIcam at the Apache Point Observatory. A 2048x2048 SITe CCD was binned on-chip 2x2 to produce 0.28x0.28 arcsec pixels. The data were reduced in the conventional way and calibrated photometrically with nearby standard stars. Although conditions were not photometric, calibrators were taken shortly after images of SBS 1543+593, and are believed to result in a photometric zero point good to within mags.
The coadded data resulted in an image similar to that shown in RH98, and are not reproduced here. We used these data, however, to produce a surface brightness profile of the galaxy, shown in Figure 1. The profile near the center of the galaxy is obviously contaminated by flux from the QSO and the bright star identified by RH98, but the remaining points can be well fit with a standard exponential profile, , where is the central surface brightness in mag arcsec-2, is the radius from the galaxy’s center, and is the scale length. The fit to the data in Figure 1 shows that the galaxy has mag arcsec-2 and a scale length of 7 arcsec, or 0.9 kpc at the redshift of the galaxy.111, where is the Hubble constant, and is assumed throughout this paper We make no correction to for galaxy inclination since the optical depth effects in LSB galaxies are not known, and may be less significant than in High Surface Brightness (HSB) galaxies if the dust content in LSB galaxies is lower. If dust does play a significant role in LSB galaxies, then is an upper limit and the galaxy may be fainter. The total -band magnitude of the galaxy, can be derived from the fit to the surface brightness profile, , in good agreement with a simple integration of the counts which excludes star and QSO. This corresponds to an absolute magnitude of .
We can compare the properties of this galaxy with those found for other local LSB galaxies by correcting the surface brightness in the observed -band to that in the -band. de Blok et al. (1996) find that for a sample of nearby LSBs, , which gives mag arcsec-2 for SBS 1543+593. Compared to the sample studied by de Blok et al. (1995), SBS 1543+593 is a regular LSB galaxy, with and close to the median values of and kpc for local LSB galaxies.
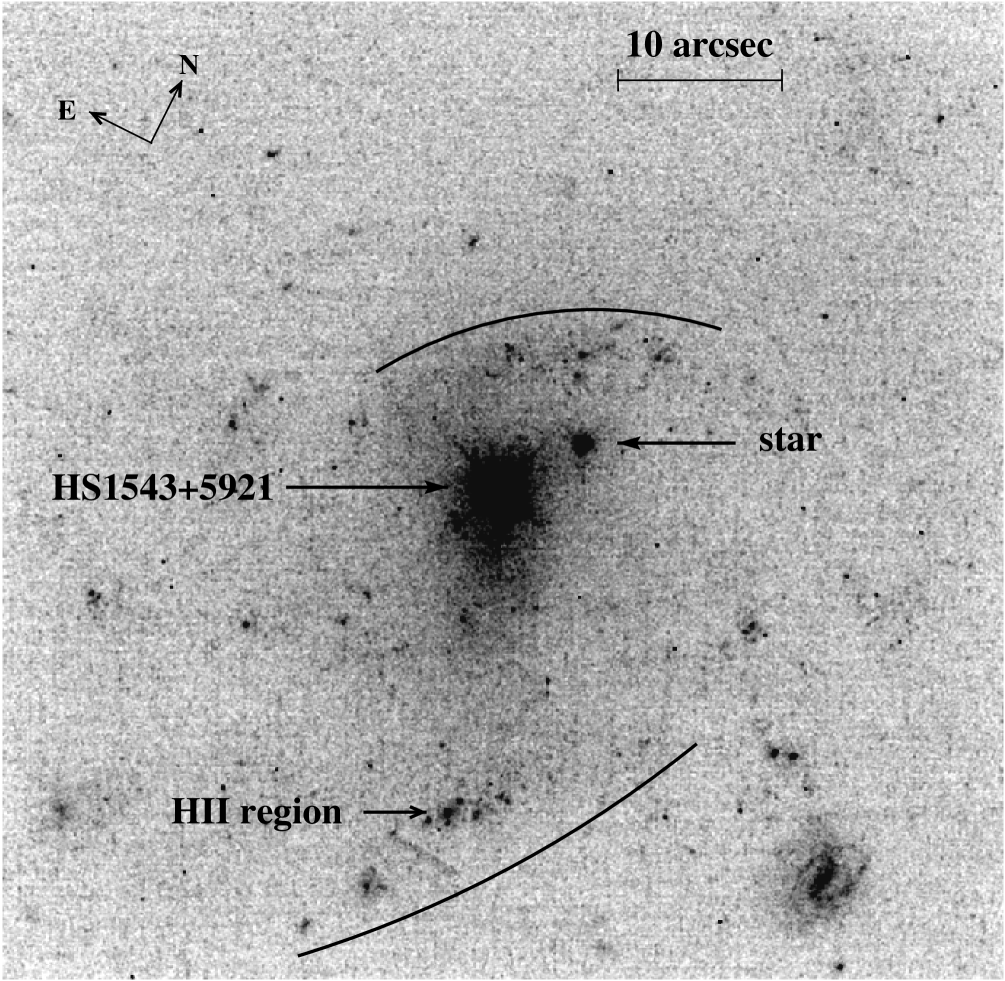
Three HST STIS images were taken of the QSO-galaxy pair on 18 Sep 2000 with the CCD detector and no filter. The three exposures were medianed to remove cosmic rays, and hot pixels were identified and set to a local background. The coadded image represents a total exposure time of 802 sec and is reproduced in Figure 2, with the data smoothed by a boxcar filter of size 3x3 pixels to show the LSB features better. The field of view is x50 arcsec and the throughput of the detector is such that the image records photons with wavelengths between 2000 and 11,000 Å, with the sensitivity peaking at 5852 Å. The image shows that SBS 1543+593 is composed of two primary spiral arms, largely defined by H II regions within the arms. In Figure 2 we mark the outer regions of these two arms with curves. The H II region observed spectroscopically by RH98 is marked, and is seen to break up into several discrete regions. There may be evidence for additional spiral structure in the image; for example, a faint diffuse region to the left of the “H II region” label at the bottom left of Figure 2 may itself be an H II region and mark the end of a faint spiral arm which winds back towards the more prominent southern H II cluster already discussed. A second galaxy bottom right of the figure, which can be seen in RH98’s image, and identified by them as a point source, is here easily resolved into a barred spiral. No redshift is measured for this galaxy, but given the small angular size and high surface brightness, it is probably background to SBS 1543+593.
3 STIS spectroscopy: damped Ly from SBS 1543+593
Three STIS FUV-MAMA spectra were obtained 18 Sep 2000 with the G140L grating and 52x0.5 aperture for a total exposure time of 2139 sec (HST Archive dataset o5l301010). To improve the signal-to-noise of the spectrum over that derived from the pipeline calibration, we used the IRAF apall routine to extract the individual exposures from the x2d file, paying particular attention to the subtraction of geocoronal Ly and O I emission which filled the aperture. The co-added data were normalized using a fifth-order cubic spline, and a portion of the resulting spectrum is shown in Figure 3. Not shown in that figure is a broad emission line centered at 1397.8 Å, which we identify as Ne VIII from the QSO, giving an emission redshift of . The value of the flux at 1220 Å is ergs cm-2 s-1 Å-1.
Absorption lines in the spectra were identified, and equivalent widths measured, using standard procedures, and lines found arising from SBS 1543+593 are listed in Table 1. Ly is clearly seen from the galaxy at precisely the redshift expected, and appears to be slightly stronger than Galactic Ly. Strong lines of Si II , O I +Si II , and C II are detected at strengths similar to Milky Way absorption lines. Although the region blueward of Ly is confused at this resolution, it is likely that we also detect Si II blended with Galactic Si II . We may also detect Si II at 1200.8 Å, but, compared to the other Si II lines, the absorption may be too strong to be from the 1190 Å line alone. Although the Milky Way N I triplet is expected to be present, the predicted wavelength of the line does not match this feature well. Interestingly, with Galactic co-ordinates of and , this sightline passes through the middle of High Velocity Cloud (HVC) Complex C (Wakker & van Woerden 1991). However, for the two lines at 1200.8 and 1204.9 Å to be identified as Ly from the HVC Complex, they would have to have velocities of and km s-1 respectively, velocities much too large to be associated with HVCs. There are no other obvious absorption line systems which can be identified in the spectrum that could give rise to metal lines at the wavelength of the 1200.8 Å feature, so its identification remains ambiguous.
Measurement of the neutral hydrogen column density along the line of sight is complicated by the shape of the Line Spread Function (LSF) generated by the G140L grating and 52x0.5 aperture. The resolving power of the G140L is measured to be between 200300 km s-1 (Kimble et al. 1998), but the LSF is not gaussian, and is composed instead of a central narrow core with broad, extended wings. Although the widths of the Ly absorption lines from both the Milky Way and SBS 1543+593 are much greater than the FWHM of the core of the LSF, the inclusion of extended wings means that part of the absorption profile is over a velocity interval at least as large as the intrinsic widths of the Ly lines. The result is that the core of the lines do not reach a flux of zero as might be expected for damped lines if the LSF were a gaussian only a few hundred km s-1 wide.
Hence, to model the Ly lines from the Galaxy and from SBS 1543+593, we have convolved theoretical line profiles with the available LSF222Available from the STIS web pages at www.stsci.edu calculated at 1200 Å. The H I column density from our own Milky Way is known to be (H I) from, e.g., the Bell Labs H I Survey (Stark et al. 1992)333Obtained from asc.harvard.edu/toolkit/colden.jsp. The signal-to-noise of the Galactic Ly absorption line is poor, due to the subtraction of intense geocoronal Ly emission; the minimum and maximum extent of the subtracted profile is shown bottom of Figure 3, demonstrating that the spurious point at 1209.4 Å, and the pixels separating the Galactic and extragalactic Ly which seem anomalously high, are a result of the subtraction of the geocoronal Ly. Hence we fitted theoretical line profiles to the Ly absorption lines keeping (H I) fixed for the Milky Way absorption, while allowing the redshift, column density and Doppler parameter to vary for absorption from SBS 1543+593. The resulting fits are shown in Figure 3. The profile for Milky Way absorption well fits the data, despite using a value of (H I) known a priori, and for SBS 1543+593 we derive (H I). We note that by not using an LSF with extended wings, assuming a simple gaussian LSF, and correcting the baseline of the spectrum so that the cores of the Ly lines reached zero flux, (H I) would be over-estimated by dex. A value of (H I) is consistent with that derived from simply calculating (H I) from the measured equivalent width assuming a damped line: for (Ly) Å (a lower limit since part of the line is lost though blending with Milky Way Ly) we derive (H I).
Errors on the derived value of (H I) are hard to quantify precisely, due to uncertain systematic errors, but providing the line is damped, (H I) is probably accurate to within 0.1 dex. It seems likely, therefore, that SBS 1543+593 is responsible for a DLy line. We note, however, that at the resolution of these observations, it is still possible that the line could be composed of several individual components whose distribution of column densities and Doppler parameters with velocity mimics a single DLy profile. This would mean that the total (H I) could be less than the derived (H I). If true, however, the similarities in equivalent width between the Milky Way metal absorption lines and those arising in the LSB galaxy would imply that the extragalactic interstellar gas was of a higher metallicity than that intercepted locally. Higher resolution observations would confirm the damped nature of the Ly line.
| (Å) | (Å) | (Å) | ID |
| 1200.8 | 1.601 | 0.23 | Si II ? |
| (+N I at ?) | |||
| 1204.9 | 1.781 | 0.22 | Si II |
| + Si II at | |||
| 1226.5 | 9.151 | 0.32 | Ly |
| 1272.2 | 1.07 | 0.18 | Si II |
| 1314.2 | 1.30 | 0.15 | O I +Si II |
| 1347.5 | 1.19 | 0.12 | C II |
| 1 Lower limits—blended with Milky Way lines | |||
4 Discussion
Our optical and spectroscopic data have shown that SBS 1543+593 is a LSB galaxy causing a DLy system at in the spectrum of HS 1543+5921. This makes it the lowest redshift DLy system discovered outside of the local group. The identification of DLy from a known LSB is important, for the following reasons. So far, results from ground-based and HST imaging of fields around QSOs known to show DLy lines have been surprising, with the detection of a whole variety of galaxy types, including normal early and late-type HSB spirals, and amorphous LSB galaxies, identified as responsible for the absorption (Steidel et al. 1993, 1994; Lanzetta et al. 1997; Le Brun et al. 1997; Rao & Turnshek 1998; Pettini et al. 2000). This wide variety of absorber types has led to the speculation that DLy systems may not simply signal the presence of normal gas-rich spiral galaxies after all, as has been postulated since their discovery (Wolfe et al. 1986). It is important to note, however, that in most cases there exists no redshift information for the purported absorbers. Proximity to the line of sight is no guarantee that an ‘identified’ object is the absorber, since there are often several absorption systems at redshifts other than that of the DLy line along the QSO line of sight. If galaxies are responsible for these other systems, then the chance of mis-identification is high (particularly if DLy systems do not arise in normal galaxies). Hence the detection of a DLy line from SBS 1543+593 is unique, in that we know unequivocally that the absorber is an LSB galaxy.
It also seems likely that if SBS 1543+593 were moved to a redshift similar to those of the DLy systems already studied, it would be extremely difficult to detect, partly due to its low surface brightness and partly due to its close proximity to the QSO and its small angular size. In fact, in this case, it is more likely that the nearby barred spiral galaxy south-west of the pair, which we take to be background to SBS 1543+593, would be identified as the DLy absorber if no redshift information were available.
Our observations of SBS 1543+593 support the idea that LSB galaxies may contribute significantly to the population of DLy absorbers, as initially suggested by Impey & Bothun (1989). Although finding a DLy from an LSB galaxy does not prove that all DLy systems are LSB galaxies, our detection does prove that LSB galaxies can produce such systems.
Perhaps more significant is the detection of this QSO-galaxy pair in the first place. Finding any bright QSO shining through the center of a nearby galaxy is extremely rare, and it is intriguing that an LSB galaxy is the interloper. LSB galaxies are believed to be relatively free of dust, and hence optically thin to the photons of background objects — these may therefore be the best types of galaxies to allow the light of quasars to shine through. This potential selection effect has been a concern for interpreting the copious abundance measurements of high-redshift DLy systems: if a particular type of galaxy preferentially favors QSO light passing through it, then the derived metallicities are only applicable for that type of galaxy. There are also theoretical bases for the idea that LSB galaxies hold most of the high column density H I cross-section: for example, Jimenez et al. (1999) predicted that HSB disks consume neutral gas too fast to explain the observed evolution in the neutral gas mass density with redshift, and that consumption of hydrogen by LSB galaxies better fits the abundance measurements.
The mere existence of the QSO-galaxy pair discussed herein seems to strongly support these views. Unfortunately, just how common such QSO/LSB-galaxy alignments are at higher redshift will always be difficult to determine, due to the intrinsic faintness of the galaxies, especially if the galaxy is close to the QSO sightline as with this pair. Finally, we note that HS 1543+5921 is bright enough to be used to measure abundances in the interstellar medium of SBS 1543+593 with further HST observations. The current data do not have sufficient resolution for reliable metallicity estimates, so follow-up UV observations would be extremely valuable. Comparison of gas metallicities from a known LSB galaxy with higher redshift DLy systems would be useful in deciding if LSB galaxies are, in general, responsible for the absorption. Measurement of the alpha-to-iron elemental abundances in SBS 1543+593 could also be used to derive the star-formation history of the galaxy, and relative metal abundances may provide insight into its dust content. Lastly, comparison of the kinematic structure of metal lines arising from SBS 1543+593 could be matched to global H I kinematics derived from 21 cm emission maps of the galaxy, and to profiles seen in high-redshift DLy lines which are believed by some authors to be indicative of rotating disks.
References
- de Blok et al. (1996) de Blok, W. J. G., McGaugh, S. S., & van der Hulst, J. M. 1996, MNRAS, 283, 18
- de Blok et al. (1995) de Blok, W. J. G., van der Hulst, J. M., & Bothun, G. D. 1995, MNRAS, 274, 235
- Impey & Bothun (1989) Impey, C. & Bothun, G. 1989, ApJ, 341, 89
- Jimenez et al. (1999) Jimenez, R., Bowen, D. V., & Matteucci, F. 1999, ApJ, 514, L83
- Kimble et al. (1998) Kimble, R. A. et al. 1998, ApJ, 492, L83
- Lanzetta et al. (1997) Lanzetta, K. M., Wolfe, A. M., Altan, H., Barcons, X., Chen, H. W., Fernandez-Soto, A., Meyer, D. M., Ortiz-Gil, A., Savaglio, S., Webb, J. K., & Yahata, N. 1997, AJ, 114, 1337
- Le Brun et al. (1997) Le Brun, V., Bergeron, J., Boisse, P., & Deharveng, J. M. 1997, A&A, 321, 733
- Pettini et al. (2000) Pettini, M., Ellison, S. L., Steidel, C. C., Shapley, A. E., & Bowen, D. V. 2000, ApJ, 532, 65
- Rao & Turnshek (1998) Rao, S. M. & Turnshek, D. A. 1998, ApJ, 500, L115
- Reimers & Hagen (1998) Reimers, D. & Hagen, H. . 1998, A&A, 329, L25
- Stark et al. (1992) Stark, A. A., Gammie, C. F., Wilson, R. W., Bally, J., Linke, R. A., Heiles, C., & Hurwitz, M. 1992, ApJS, 79, 77
- Steidel et al. (1993) Steidel, C. C., Dickinson, M., & Bowen, D. V. 1993, ApJ, 413, L77
- Steidel et al. (1994) Steidel, C. C., Pettini, M., Dickinson, M., & Persson, S. E. 1994, AJ, 108, 2046
- Wakker & van Woerden (1991) Wakker, B. P. & van Woerden, H. 1991, A&A, 250, 509
- Wolfe et al. (1986) Wolfe, A. M., Turnshek, D. A., Smith, H. E., & Cohen, R. D. 1986, ApJS, 61, 249