XMM-Newton EPIC Observation of SMC SNR 010272.3††thanks: Based on observations with XMM-Newton, an ESA Science Mission with instruments and contributions directly funded by ESA Member states and the USA (NASA).
Results from observations of the young oxygen-rich supernova remnant SNR 0102$-$72.3 in the Small Magellanic Cloud during the calibration phase of the XMM-Newton Observatory are presented. Both EPIC-PN and MOS observations show a ringlike structure with a radius of 15″ already known from Einstein, ROSAT and Chandra observations. Spectra of the entire SNR as well as parts in the eastern half were analyzed confirming shocked hot plasma in non-uniform ionization stages as the origin of the X-ray emission. The spectra differ in the northeastern and the southeastern part of the X-ray ring, showing emission line features of different strength. The temperature in the northeastern part is significantly higher than in the southeast, reflected by the lines of higher ionization stages and the harder continuum. Comparison to radio data shows the forward shock of the blast wave dominating in the northern part of the SNR, while the southern emission is most likely produced by the recently formed reverse shock in the ejecta. In the case of the overall spectrum of SNR 0102$-$72.3, the two-temperature non-equilibrium ionization model is more consistent with the data in comparison to the single plane-parallel shock model. The structure of SNR 0102$-$72.3 is complex due to variations in shock propagation leading to spatially differing X-ray spectra.
Key Words.:
Shock waves – ISM: supernova remnants – Galaxies: Magellanic Clouds – X-rays: ISM1 Introduction
SNR 0102$-$72.3 is one of the brightest X-ray sources in the Small Magellanic Cloud (SMC) and was discovered by the IPC instrument onboard the Einstein Observatory (Seward & Mitchell SM81 (1981)). The Einstein HRI resolved a shell-like supernova remnant (SNR), and optical emission is seen from a variety of filaments rich in oxygen and neon (Dopita & Tuohy DT84 (1984)) arranged in an incomplete clumpy ring with radius of about 12″. Enrichment in the element oxygen is indicative for remnants of a type II SN explosion. The maximum velocity of the optical filaments [O iii], not visible in H (Dopita et al. D81 (1981)), was found to be up to 6500 km/s (Tuohy & Dopita TD83 (1983)). The bright O iii knots, assumed to be dense ejecta clumps or Rayleigh-Taylor fingers of ejecta (density 1 cm-3), correspond in some parts well with bright X-ray features (Gaetz et al. G00 (2000)) but in other parts not. The estimated ionization timescale of adds to the origin of the X-ray emission being a shock heated X-ray plasma in a state of non-equilibrium ionization (NEI). Radio observations of SNR 0102$-$72.3 with 3″ resolution in the 6 cm wavelength band by Amy & Ball (AB93 (1993)) unveiled an outer radio shell diameter of 40″5″. The radio emission is found to lie predominantly outside the bright X-ray emission but within an outer faint X-ray rim of 44″ (Gaetz et al. G00 (2000)). Hayashi et al. (H94 (1994)) reported on a broadband spectrum of SNR 0102$-$72.3 gained from the ASCA SIS instrument showing most of the emission from SNR 0102$-$72.3 lying in the 0.5 – 2.3 keV energy band. The most prominent line features were interpreted as He-like K, H-like K and K emission from ionized atoms of the elements oxygen, neon and magnesium. Their difficulties to describe the overall spectrum with simple NEI models was interpreted as an inhomogeneous abundance pattern within the emitting plasma and possibly two components, namely forward shock in the interstellar medium (ISM) and reverse shock in the ejecta, contributing to the overall X-ray emission. XMM-Newton with its high sensitivity now enables spatially resolved spectroscopy on various parts of SNR 0102$-$72.3. The following section describes the details of the observation and the data. Spectra from the selected regions are presented and fitted in Sec. 3. Finally, the results are discussed in Sec. 4.
2 Data
| Orbit | Obs. ID | Start Time | End Time | Pointing Direction | Filter | |
|---|---|---|---|---|---|---|
| RA | Dec | |||||
| 65 | 0123110201 | 16. Apr. 2000, 19:06:50 | 17. Apr. 2000, 01:27:02 | 01 03 50.00 | 72 01 55.0 | thin |
| 65 | 0123110301 | 17. Apr. 2000, 03:41:01 | 17. Apr. 2000, 09:44:33 | 01 03 50.00 | 72 01 55.0 | medium |
SNR 0102$-$72.3 was observed by the XMM-Newton (Jansen et al. J01 (2001)) in April 2000 during its calibration phase (see Table 1). There were two observations with different filters, thin and medium. In order to study the morphologies of the SNR, XMM-Newton EPIC-MOS (Turner et al. T01 (2001)) data were used. The MOS camera collected the emission of the complete SNR, whereas in the EPIC-PN (Strüder et al. S01 (2001)) observations the SNR was split into two parts by CCD chip borders. The EPIC-MOS data was processed through the XMM-Newton Science Analysis System (XMM-SAS) and events in the energy band of 0.2 – 3.0 keV were selected. Fig. 1 shows an overlay of the image created from the EPIC-MOS thin filter observation and contours of a radio image of the 4790 MHz observations at the Australia Telescope Compact Array (ATCA).
The region centered on SNR 0102$-$72.3 was observed as part of the ATCA mosaic observations of the SMC with a baseline of 375 m at frequencies of 1420 and 2370 MHz with a corresponding angular resolution of 90″ and 45″ . ATCA observations in snap-shot mode at 4800 and 8640 MHz were undertaken for specific regions of interest including SNR 010272.3. The baseline of these observations were as well 375 m and we achieved resolution of 30″ and 15″, respectively (Filipović & Staveley-Smith FS98 (1998)). Amy & Ball (AB93 (1993)) studied the SNR 0102$-$72.3 at 4790 Hz, but with higher resolution (3″). We made use of their data and merged it with our observations (Filipović et al. F98 (1998) and references therein) to compensate for possible short space missing flux.
As can be seen in Fig. 1, the radio emission of the SNR is highest in the north whereas the brightest knots in X-rays are found in the south. The emission from non-thermal electrons which forms the radio ring, is located outside the bright X-ray ring, especially in the north. This is in good agreement with the comparison of Chandra ACIS data with the radio image of Amy & Ball (AB93 (1993)) by Gaetz et al. (G00 (2000)). Due to higher spatial resolution of Chandra, the ACIS image shows a detailed structure of the SNR not available to XMM, and it was found that the radio emission is mainly located between the bright X-ray ring and the rim of faint X-ray emission.
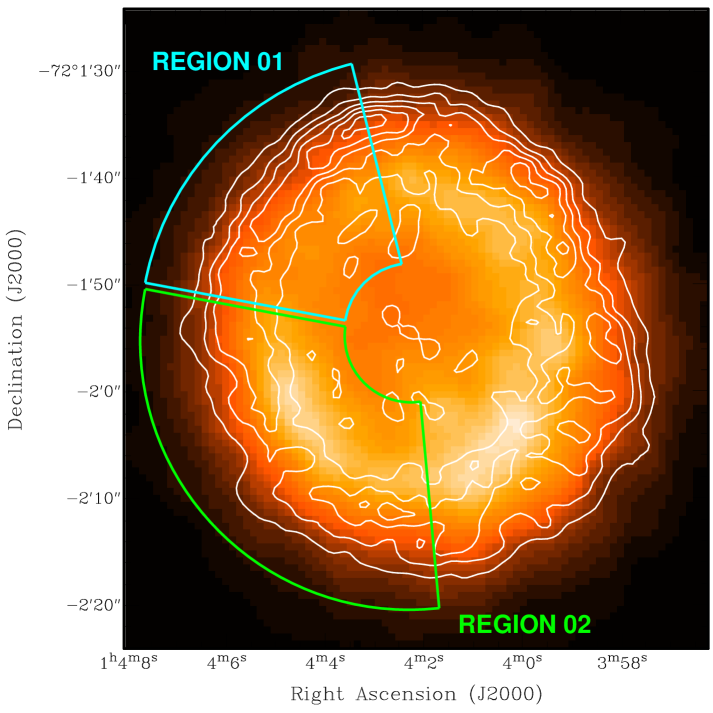
For spectral studies we analyzed the EPIC-PN data. The effective exposure times were 15.5 ksec and 10.9 ksec, respectively. We used the standard processed data from XMM-SAS and selected single pattern events only. On the EPIC-PN detector the remnant was located in the CCD chips No. 4 and 7, unfortunately divided into two parts, the larger (eastern) part lying on chip No. 7. For spectral analysis of the SNR we selected a circular region of radius 40″ around the center of the X-ray ring. Events in a ring with inner radius of 38 and outer radius of 88 on the chips No. 4 and 7, excluding out of time events, were used to estimate the background. In addition we extracted two regions of the X-ray emission with inner radius of 8″ and outer radius of 25″ which is thought to arise mainly from the hot ejecta. The first region (hereafter REGION 01) matches the northern part on the chip No. 7 starting from 10° to 80° counterclockwise from the north, and covers the faintest part of the X-ray ring. REGION 02 is selected from 80° to 185° including the southeastern bright emission of the SNR.
3 X-ray spectrum

For each selected region spectra were created from both the thin and medium filter data separately. In order to combine both observations, the two different spectra were fitted in XSPEC simultaneously with either model. In Fig. 2 the thin filter spectrum of SNR 0102$-$72.3 is shown. Additionally the best double VGNEI fit (for details see below) is plotted and the positions of the He-like emission lines of O vii, Ne ix, Mg xi, Si xiii, and S xv as well as the H-like lines of O viii and Ne x are marked. These lines have been confirmed in the XMM-Newton RGS spectrum of the same pointings (Rasmussen et al. R01 (2001)).
Simply looking at the spectra of the northeastern and southeastern parts (Fig. 3 and Fig. 4) makes a more prominent line emission of the He-like ions of oxygen and neon compared to the line emission of the H-like ions in the southeastern spectrum obvious. In the spectrum of REGION 01 the higher ionized O viii and Ne x clearly are brighter. Even for the ions of magnesium this difference is visible. The spectrum of REGION 02 shows a striking line feature of Mg xi around 1.34 keV with a steep fall-off at higher energies. REGION 01 however gives a spectrum with a less prominent Mg xi line feature and a less steep fall-off towards the higher energy end, where the location of the H-like Mg xii is expected (1.47 keV).


Due to these He-like and H-like emission lines of oxygen and neon, as well as other He-like lines, the spectra could not be modeled by one non-equilibrium ionization (NEI) model. Thus we used two generalized NEI components with time varying temperature (VGNEI, Borkowski B00 (2000)). The model VGNEI describes a homogeneous neutral gas which was initially cold, but is heated spontaneously. The ionized plasma is not in thermal equilibrium for small ionization timescales s cm-3, i. e. the electron temperature is lower than the ion temperature. The temperatures vary with time. Beside the parameters temperature (keV), heavy-element abundances, and the ionization timescale , the ionization timescale averaged temperature (keV) is determined. For the two VGNEI components, the abundances were tied together, while the temperatures and the ionization timescales remained free parameters.
Furthermore we applied a plane-parallel shock model (VNPSHOCK) which takes different NEI states into account. Essential parameters of the model are the mean shock temperature (keV), postshock electron temperature (keV) immediately behind the shock front, and the ionization timescale . In collisionless shocks in SNRs electrons and ions are presumably not in thermal equilibrium. The electrons are heated by Coulomb collisions with ions which have higher temperatures in the postshock plasma. Far behind the shock front, electron temperature becomes equal to ion temperature for higher .
| REGION 01 | REGION 02 | entire SNR | |||||
| parameter | value | (90% c.r.) | value | (90% c.r.) | value | (90% c.r.) | unit |
| generalized NEI (double VGNEI) | |||||||
| SMC | 8.74 | (8.01 – 9.31) | 8.13 | (1.49 – 24.9) | 6.93 | (5.05 – 9.57) | 1020 cm-2 |
| 1. NEI component: | |||||||
| 1.14 | (1.10 – 1.26) | 1.06 | (0.46 – 1.58) | 0.80 | (0.73 – 0.91) | keV | |
| 0.81 | (0.76 – 0.83) | 1.2 | (0.30 – 13) | 3.9 | (3.4 – 5.0) | 1011 s cm-3 | |
| 2.44 | (2.34 – 2.57) | 0.91 | (0.56 – 1.99) | 0.71 | (0.63 – 0.75) | keV | |
| EM1 (frac.) | 0.58 (0.68) | 1.7 (0.76) | 6.2 (0.84) | 1058 cm-3 | |||
| 2. NEI component: | |||||||
| 4.52 | (3.25 – 5.47) | 1.04 | (0.30 – 1.13) | 0.79 | (0.62 – 0.92) | keV | |
| 0.11 | (0.10 – 0.12) | 0.16 | (0.01 – 1.0) | 0.18 | (0.07 – 0.34) | 1011 s cm-3 | |
| 3.13 | (2.68 – 3.22) | 0.74 | (0.72 – 0.76) | 0.81 | (0.26 – 1.88) | keV | |
| EM2 (frac.) | 0.27 (0.32) | 0.54 (0.24) | 1.2 (0.16) | 1058 cm-3 | |||
| Oxygen abundance | 1.6 | (1.3 – 1.7) | 3.9 | (3.3 – 4.1) | 4.7 | (4.4 – 9.3) | |
| Neon | 4.2 | (4.0 – 4.6) | 5.9 | (5.3 – 6.2) | 7.1 | (5.9 – 13.5) | |
| Magnesium | 2.3 | (2.1 – 2.5) | 3.2 | (2.9 – 3.5) | 3.0 | (2.7 – 3.3) | |
| Silicon | 1.0 | (0.8 – 1.3) | 0.9 | (0.7 – 1.2) | 0.8 | (0.6 – 0.9) | |
| Iron | 0.6 | (0.5 – 0.7) | 0.7 | (0.5 – 0.8) | 0.5 | (0.4 – 0.7) | |
| red. | 1.10 | 1.63 | 1.76 | ||||
| plane-parallel shock (VNPSHOCK) | |||||||
| SMC | 0.99 | (0.00 – 1.29) | 1.95 | (0.99 – 2.19) | 0.37 | (0.00 – 0.69) | 1020 cm-2 |
| 1.15 | (0.86 – 1.19) | 0.08 | (0.01 – 0.18) | 0.08 | (0.01 – 0.20) | keV | |
| 5.65 | (5.64 – 5.66) | 3.76 | (3.54 – 3.82) | 4.20 | (4.10 – 4.30) | keV | |
| 1.1 | (1.0 – 1.2) | 1.0 | (0.9 – 1.1) | 1.1 | (1.0 – 1.2) | 1011 s cm-3 | |
| Oxygen abundance | 0.8 | (0.7 – 0.9) | 1.1 | (1.0 – 1.2) | 1.1 | (1.0 – 1.2) | |
| Neon | 1.4 | (1.3 – 1.5) | 2.4 | (2.3 – 2.5) | 2.6 | (2.5 – 2.7) | |
| Magnesium | 0.9 | (0.8 – 1.0) | 1.3 | (1.2 – 1.4) | 1.5 | (1.4 – 1.6) | |
| Silicon | 0.3 | (0.2 – 0.5) | 0.3 | (0.2 – 0.4) | 0.4 | (0.3 – 0.5) | |
| Iron | 0.3 | (0.2 – 0.4) | 0.2 | (0.2 – 0.3) | 0.3 | (0.2 – 0.4) | |
| red. | 1.21 | 1.84 | 2.52 | ||||
Notes:
EM1 and EM2 are emission measures of the two VGNEI components. Fractional values are given in brackets. For the entire SNR, EM1 and EM2 from the EPIC-PN spectra do not correspond to the total values of the SNR, because a part of the emission was not detected due to the CCD gap.
Abundances are relative to solar values.
The 90% confidence range for temperature, ionization timescale and abundances are given in brackets. The confidence range for abundances are calculated by fixing and at best fit values.
The absorption consists of fixed foreground absorption with galactic of (Dickey & Lockman DL90 (1990)) and an additional absorption column density which is a free fit parameter with fixed abundances of 0.2 typical for the interstellar gas in the SMC (Russell & Dopita RD92 (1992)). The resulting parameters of the simultaneous two-observation-fit for the entire SNR and the two regions are given in Table 2.
In all selected regions fitting the spectrum results in an overabundance of oxygen, neon, and magnesium (see Tab. 2). Using the double VGNEI model, two ionization timescales were determined differing in one order of magnitude, s cm-3 and s cm-3. The lower component dominates in the softer part of the spectrum below 0.8 keV. The higher ionization states are reproduced by the higher component which is prominent in the higher energy end of the spectrum.
In REGION 01 the determined temperatures are the highest both in the double VGNEI model and the VNPSHOCK model with temperatures higher than 1 keV. This is the part with the lowest emission along the X-ray ring. Both the shape of the spectrum and the temperatures indicate that this region is more highly ionized than in the south.
In REGION 02 and the entire SNR spectrum the temperatures are lower, but the abundances higher than in REGION 01. REGION 02 includes the brightest part of the X-ray ring visible in the analyzed EPIC-PN observation and the abundances of oxygen, neon, and magnesium are higher than in the northeast with 3.9, 5.9, and 3.2 relative to solar in the double VGNEI model, respectively. The comparison of the spectra of the entire SNR and REGION 02 makes clear that the temperatures and the abundances are almost the same. Although there is a slight difference in the ionization timescale of the higher component of the double VGNEI-model, which is higher in the entire spectrum, the observed X-ray emission of the SNR is dominated by the emission from REGION 02. Furthermore the He-like emission lines of S xv could be identified around 2.45 keV in the overall spectrum, since the spectrum extends up to 6 keV thanks to good photon statistics. For the whole SNR the single plane-parallel shock model yields an unsatisfying fit. This corroborates the results of ASCA observations that the X-ray emission of the SNR originates from at least two different thermal plasma states (Hayashi et al. H94 (1994)).
4 Discussion
SNR 0102$-$72.3 is a young SNR with an estimated age of about 1000 yr (Tuohy & Dopita TD83 (1983)), which is no longer in the free expansion phase. Most of the X-ray emission originates from a bright ring with radius 14″ and a mean FWHM of 5″ caused by a reverse shock propagating through the ejecta (Gaetz et al. G00 (2000); Hughes et al. H00 (2000)). The XMM-Newton EPIC observations confirm this overall picture.
The spectra of the northeastern and southeastern regions of the SNR can be fitted with a two component NEI model, each component with a characteristic single ionization timescale. The emission lines of the two highest ionization stages of oxygen and neon, as well as the two values for point out, that there is an ongoing shock ionization. This effect differs in the northeastern and the southeastern part of the SNR which can be seen in the unequal spectra of these regions (Fig. 3 and Fig. 4). The plasma temperature for the northeastern part is up to 4 times higher than in the rest of the SNR, indicating that the shock velocity is higher in this region (). Though most of the X-ray emission of the SNR arises from the hot ejecta, in the northeastern part the forward shock of the blast wave propagating into the ISM becomes important, verified in radio observations showing synchrotron emission right behind the blast wave which can be seen in Fig. 1. The X-ray emission of the entire SNR is dominated by the ejecta emission, which can be seen in the significant similarity between the overall spectrum and the spectrum of the southeastern region.
All the spectra extracted from EPIC-PN data were better reproduced by the two component NEI model than in a single plane-parallel shock model. The two NEI components differ not only in temperatures, but much more significantly in the ionization timescale . While the lower component values themselves are similar for both selected regions as well as for the overall spectrum, the higher value is the lowest in the northeastern region. In this part of the SNR, also the fractional emission measure of the higher component is smaller than in the southeastern region or the whole SNR. Since in the southeastern (and the entire SNR) the ratio of the bright X-ray emission originating from the inner parts of the SNR (i.e. the bright X-ray ring) to the X-rays from the outer parts is higher (see Fig. 1), the higher component can be assigned to the bright X-ray ring, outlining regions with higher densities. The implied density distribution around the SNR ring is also supported by the extended overall shape along the southwest to northeast axis, which was already reported by Gaetz et al. (G00 (2000)) and can be verified in Fig. 1. This is indicative of a less decelerated expansion in that direction. Chandra observations have shown that there is evidence for a spatially varying distribution of the ionization stages and the existence of a reverse shock in the ejecta (Gaetz et al. G00 (2000); Flanagan et al. F01 (2001)). The results obtained from the spectral analysis of the XMM-Newton EPIC-PN data show that there are differences in the plasma states between various parts of the SNR with spatial temperature and ionization stage variations, contributing to its complicated structure.
Acknowledgements.
The authors wish to thank Andrew Rasmussen for the valuable referee report. The XMM-Newton project is supported by the Bundesministerium für Bildung und Forschung / Deutsches Zentrum für Luft- und Raumfahrt (BMBF/DLR), the Max-Planck Society and the Heidenhain-Stiftung.References
- (1) Amy, S.W., Ball, L. 1993, ApJ, 411, 812
- (2) Borkowski, K.J. 2000, Rev. Mex. Astron. Astrofis., 9, 288
- (3) Dickey, J.M., Lockman, F.J. 1990, ARA&A, 28, 215
- (4) Dopita, M.A., Tuohy, I.R., Mathewson, D.S. 1981, ApJ, 248, L105
- (5) Dopita, M.A., Tuohy, I.R. 1984, ApJ, 282, 135
- (6) Filipović, M.D., Jones, P.A., White, G.L., Haynes, R.F. 1998, A&AS, 130, 441
- (7) Filipović, M.D., Staveley-Smith, L. 1998, in The Magellanic Clouds and Other Dwarf Galaxies, ed. Richtler T., Braun J.M., Shaker Verlag, Aachen, 137
- (8) Flanagan, K.A., Canizares, C.R., Davis, D.S., Dewey, D., Houck, J.C., Schattenburg, M.L. 2001, in X-ray Astronomy 2000, eds. Giacconi R., Stella L., Serio S., Palermo, to be published in PASPC
- (9) Gaetz, T.J., Butt, Y.M., Edgar, R.J., et al. 2000, ApJ, 534, L47
- (10) Hayashi, I., Koyama, K., Ozaki, M., et al. 1994, PASJ, 46, L121
- (11) Hughes, J.P., Rakowski, C.E., Decourchelle, A. 2000, ApJ, in press
- (12) Jansen, F., Lumb, D., Altieri, B., et al. 2001, A&A, 365 (this issue)
- (13) Rasmussen, A.P., Behar, E., Kahn, S.M., den Herder, J.W., van der Heyden, K. 2001, A&A, 365 (this volume)
- (14) Russell, S.C., Dopita, M.A. 1992, ApJ, 384, 508
- (15) Sault, B., Killeen, N. 1999, MIRIAD users Guide, ATNF
- (16) Seward, F.D., Mitchell, M. 1981, ApJ 243, 736
- (17) Strüder, L., Briel, U.G., Dennerl, K., et al. 2001, A&A, 365 (this issue)
- (18) Tuohy, I.R., Dopita, M.A. 1983, ApJ 268, L11
- (19) Turner, M.J.L., Abbey, A., Arnaud, M., et al. 2001, A&A, 365 (this issue)