\headnoteAstron. Nachr. 00 (0000) 0, 000–000 \makeheadline
Surface photometry of NGC 3077
We present surface photometry of the irregular galaxy NGC 3077 using two data sets: photographic plates and CCD images. Isophotal contours, luminosity and colour distributions as well as position angle and ellipticity curves show that NGC 3077 is similar to an elliptical galaxy in the outer regions with a disturbed blue centre. The outer isophotes 22-25mag/ are approximately centred on the dynamical centre, showing no clear evidence of the interaction with M81, the inner ones are disturbed by the dominant contribution of a reddened young population. END \keywGalaxies: individual (NGC 3077) – Galaxies: Surface photometry END
1 Introduction
Surface photometry is one of the oldest techniques in modern Astronomy. The first attempt of surface photometry was done in Helwan observatory in Egypt by Reynolds 1913. In quanititative analysis of the structure of galaxies, some of the two-dimensional data are reduced to one-dimensional luminosity profiles. The shape of the surface brightness profile took more attention and has been put forward as a new extragalactic distance indicator (c.f. Binggeli & Jerjen 1998).
NGC 3077 is a member galaxy of the M81 interacting group of galaxies. It lies 46′ south-east of the spiral galaxy M81. Two HI bridges connect it with its neighbouring galaxies M81 and M82 (cf. Yun et al. 1994, Thomasson and Donner 1993). It was classified as an Irr II galaxy (Sandage 1961). The centre of NGC 3077 is dusty and exhibits many compact blue knots, in addition to condensed HII regions embedded in diffuse ionized gas (Barbieri et al. 1974). In this paper we performed detailed continuum surface photometry to investigate the morphology and the colour distribution of the galaxy NGC 3077.
2 Observation and data reduction
CCD observations and photographic Schmidt plates were used in this study.
The photographic observations have been done using the 134/200/4000 Schmidt
telescope of the Karl-Schwarzschild Tautenburg observatory. 9 plates of the
M81/M82 field, containing also NGC 3077, were
taken in February/March 1978 by F. Börngen and R. Ziener, in the passbands
U, B and V (4, 3 and 2 plates respectively).
The photographic observations were scanned, linearized, coadded and corrected for sky background as usual, see more details in Bronkalla et al. 1980.
The CCD observations were obtained using the 1.23m telescope on Calar Alto, equipped with a TEK CCD camera.
The characteristics of the CCD camera are listed in Table 1.
The exposures were taken with Johnson-Cousins U, B, V, R, I and
filters.
The journal of observation is presented in Table 2.
Flatfields were obtained during morning and evening twilight,
from which a master flat has been made.
Inspection of flat frames revealed the presence of non-uniform low frequency
light variations, which are different from night to night and from frame to frame for each band.
This introduces uncertainties into the flat-field calibration
of a few percent especially in the edges of the field.
The image processing system MIDAS is used for data reduction.
All frames are matched carefully in position using the foreground stars in the
field, and transformed to a common coordinate system.
The elimination of cosmics was done by building a difference frame for each
pair of frames and masking the cosmics in each of them. The masks were used to
get a mean frame for each filter. After these steps, bright foreground
stars were removed by interpolation from
neighbouring pixels, in order to exclude their contribution to the galaxy’s light.
The most difficult task in the data reduction was the estimation of the sky
background. This is due to i) the presence of a bright star in the NW side
of the galaxy with its extended wings superimposed on the galaxy,
ii) the residual fluctuations due to bad flat fielding in the frames,
iii) the galaxy fills nearly the CCD frames.
It was difficult, therefore, to find blank areas in our CCD frames with negligible contribution of the galaxy.
Two-dimensional linear interpolation was used to estimate the sky background intensity in our CCD images.
Published aperture photometry for NGC 3077 is used to transform our instrumental
magnitudes to the standard Johnson-Cousins system. A convenient compilation of
photoelectric magnitudes of galaxies is published by Longo & de Vaucouleurs (1983, 1988).
Figure 1 shows two CCD images in B and I filters with different
display scales to illustrate the structure in the inner and outer parts of NGC 3077.
| Pixel size | 24x24 |
|---|---|
| Format | 1024x1024 pixels |
| Image scale at f/8 | 0.502 arcsec/pixel |
| Field of view | 8.5′x8.5′ |
| Readout noise | 1.5 |
| Gain | 20 |
| U | B | V | R | I | ||
|---|---|---|---|---|---|---|
| Exposure in | 1500,1500 | 1000,1000 | 500,500,500 | 300,100 | 500,300 | 1500,1500 |
| seconds | 300,100 | |||||
| Observers Notni, P. and Ritzmann, B.-M. | ||||||
| Date February 5-6, 1995 | ||||||
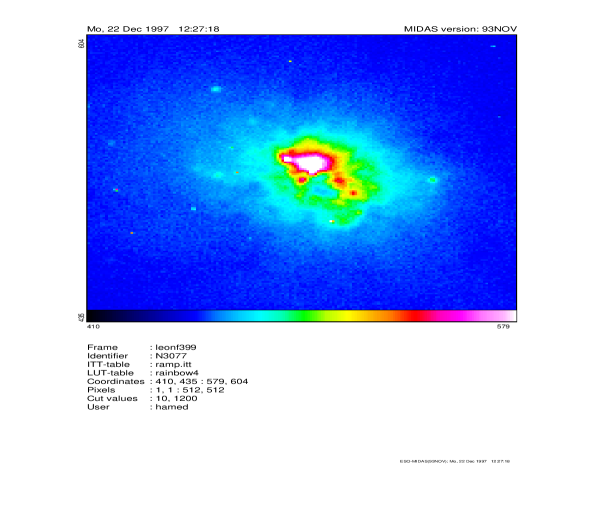
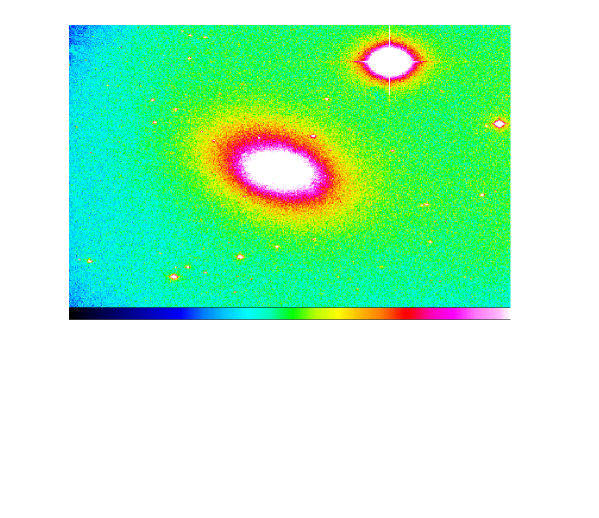
Note the intensity coding scales at the bottom of the frames.
3 Surface photometry
3.1 Isophotes
Surface brightness profiles are constructed in a way that minimizes the noise in the outer region and preserves the structure in the central region of the frames. After smoothing the images by different amounts using a running mean, ellipse fit contours are obtained by fitting the images with a set of ellipses using a Fortran program written by Bronkalla. This program serves to interpolate between the single matrix points to find the coordinates of any selected brightness level and to join these coordinates by a closed contour. They are plotted in Figure 3 for the range from 19.0 to 24.5 using the photographic B plates. The isophotes in the central part lack symmetry due to the dust obscuration and the asymmetric distribution of a young population, while smooth elliptical contours are seen in the outer region at 22-24.5.
3.2 Luminosity profile
Figure 3 shows the derived luminosity profiles from the CCD and photographic measurements presented as surface brightness in mag/ versus the semimajor axis length. The surface brightness profiles of the photographic data of the main body of the galaxy in the outer region, , fit an exponential law very well in the form:
| (1) |
where is the extrapolated surface brightness at the centre and is the scale length. Their values in U, B and V are listed in the Table 3.
Deep images of irregular galaxies often reveal that the inner active star
forming regions are embedded in smooth halos which qualitatively resemble
diffuse dwarf elliptical galaxies.
This fact led several authors to suggest a close structural relation
between elliptical and irregular dwarfs. NGC 3077 belongs to this class of
Irregulars.
| U | B | V | |
|---|---|---|---|
| ) | 21.16 | 21.18 | 20.30 |
| ) | 39.63 | 42.14 | 41.77 |
| 698 pc | 742 pc | 735 pc |
3.3 Integral luminosity and total magnitude
The integral magnitudes and colours of the galaxy NGC 3077 are obtained in U, B and V using the photographic data. To calculate the apparent integrated luminosity of the galaxy, one should sum the luminosities enclosed within each elliptical isophote. Each isophote was fitted by an ellipse of semi-axes and . The luminosity (), enclosed in an eliptical ring of area () between two successive isophotes is given as:
where is the mean intensity of two isophotes (, ) and , the area inside of the isophotes.
Then the summing of all ’s will give the apparent integrated luminosity up to the detected outer isophotes. To get the integral brightness of the whole galaxy, one should extrapolate to equal zero or, equivalently, the semi-major axis to infinity; for more details about this method see Ali 1993. Table 4 gives the luminosities and the total magnitudes, calculated to the detected outer isophotes of the surface brightness and to infinity. The absolute magnitudes are corrected for the foreground Galactic extinction, = 0.05, given by Burstein and Heiles 1984. We obtain a total B-magnitude, of 10.73, and an integrated B-V = 0.790.03, while de Vaucouleurs et al. (1991) report = 10.610.13 and B-V = 0.750.01. The absolute magnitudes and luminosties are calculated using a distance of Mpc (Freedman et al. 1994).
| U | B | V | U-B | B-V | |
|---|---|---|---|---|---|
| Apparent magnitude to | 11.01 | 10.93 | 10.14 | ||
| outer isophotes () | (24.25) | (24.5) | (23.75) | ||
| Total apparent magnitude | 10.76 | 10.73 | 9.94 | 0.03 | 0.79 |
| Absolute magnitude | -17.28 | -17.27 | -18.01 | ||
| Total luminosity () | 1.58 | 1.33 | 1.42 | ||
| Solar absolute magnitude | 5.72 | 5.54 | 4.87 |
3.4 Ellipse-fit parameters
The ellipse parameters are derived as a function of the semimajor axis length using our two data sets: CCD and photographs (see Figures 4 and 5). The position angle (measured from north through east), the position of the centres of the contours (), and the ellipticity (1- b/a)) show considerable variations with the semimajor axis length in the disturbed central region . For however, the parameters are nearly stable. The large size of the Schmidt plates, which cover the fainter parts of the galaxy NGC 3077 with precise sky subtraction, let us to use the photographic measurements to get the mean values of the ellipse parameters in the outer region. The position angle () and ellipticity curves are nearly constant in the region of , with a mean value of = 44.5 and = b/a = 0.74 0.02, see Figure 4 ( =44.9, 43.7, 44.3 and = 0.76, 0.74, 0.73 in U, B and V respectively). From the value of we derive a probable value of the inclination (i) to the line of sight, with the assumption that the isophotal surfaces of the galaxy can be approximated by ellipsoids of true axis ratio = c/a which project as ellipses of axis ratio = b/a. The relation between , and is
| (2) |
as recommended by Heidmann et al. 1972, who tabulated values for all galaxy types. We obtain = using = 0.33, the value corresponding to elliptical galaxies. Our values for the position angle (), the axial ratio () and the inclination agree well with those of Barbieri et al. 1974 ( = , = 0.7, = ).
4 Colour distribution
Figure 6 shows the integrated colours at selected points choosen along lines parallel to the major axis in NGC 3077; they are compared to theoretical calculations for population models of different age published by Bressan et al. 1994 (hereafter BCF94). The right-hand panel is the two-colour diagram for positions north of the major axis, while the left one is for southern positions; both contain identical scan locations on the axis, including the optical centre. The colours of the inner brighter parts, (open circles), and those of the underlying galaxy, (crosses), are shown for the flux integrated within apertures with different radii, which are small at the central region of the galaxy and increase gradually with distance from the centre to have approximately constant error bars. The resulting colours have been corrected for reddening due to foreground dust in the Galaxy. The colour excess is 0.05 mag in the direction of NGC 3077 (Burstein & Heiles 1984). The colour excess relations for other wavelengths bands ( , and (see Grebel & Robert 1995) are used to derive the correction required for other colour excesses, mag and mag.
The colour distribution in NGC 3077 shows two distinct features. Firstly there is a concentration of low surface brightness regions in a small confined area in the red with mean U-B = 0.3, B-V = 0.85 and R-I= 0.6. This mean colour agrees well with a population of age 2.8 yr in the BCF94 models with Z = 0.02, or of age 1.6 yr with Z =0.05. The second feature is a bluer trend in the high surface brightness area, due to a dominant contribution from a young blue population reddened by dust in the observed colours. No significant difference in the colour distributions was found between the north (right panel) and south (left panel) parts of the galaxy with respect to the major axis. If we shift the blue observed colour of the central region in the two-colour UBV diagram parallel to the reddening line, see Figure 6, we find that the intrinsic colours of the blue population correspond to a range of ages between 4 and 100 Myr. In the BV/RI-diagram, the age cannot be derived with any confidence.
We will demonstrate in a companion paper how the observed mixed colour can be disentangled to derive the distribution of the two main populations (see Abdel-Hamid & Notni 2000).
5 Conclusion
A study of the brightness and colour distribution of NGC 3077 shows that this galaxy consists of a blue disturbed centre embedded in a smooth elliptical structure; this structural type is common in irregular galaxies. The lack of symmetry in the inner region is due to the presence of a young stellar population reddened by dust. The colours of this young population indicate ages between 4 and 100 Myr, whereas the mean age of the dominant population in the outer region of NGC 3077 is 3 yr. The age range of the young central population suggests that the ongoing encounter with M81, which commenced a few hundred million years from now (eg. Thomasson and Donner 1993), serves as a trigger for the star formation in the galaxy’s core.
Acknowledgements.
This work is part of the dissertation of H.A., financially supported by a DAAD grant, and carried out in the Astrophysikalisches Institut Potsdam (AIP). H.A. gratefully appreciates the kind and fruitful hostpitality in AIP. W. Bronkalla did most of the reduction of the photographic plates. This research has made use of NASA/IPAC Extragalactic Database (NED), which is operated by the Jet Propulsion Laboratory, Caltech, under contract with NASA. \refer\aba\rfAbdel-Hamid H. & Notni P.: 2000, this issue, p….. \rfAli G. B.: 1993 Msc. thesis, Cairo university, Astronomy dep. \rfBarbieri C., Bertola F. & di Tullio G.: 1974 A&A 35, 463. \rfBinggeli B. & Jerjen H.: 1998 A & A 333, 17 \rfBressan A., Chiosi C. & Fogotto F.: 1994 ApJS 94, 63. \rfBronkalla W., Notni P. & Tiersch H.: 1980 Astron. Nachr. 301, 217. \rfBurstein D. & Heiles C. : 1984 ApJS 54, 33. \rfde Vaucouleurs G., de Vaucouleurs A., Crowin H., Buta R.J., Paturel G. & Fouqué P.: 1991, “Third Reference Catalog of Bright Galaxies”, New York, Springer. \rfFreedman W.L. et al.[15 authors]: 1994 ApJ 427, 628. \rfGrebel E.K. & Roberts W.J.: 1995 ApJS 109, 293. \rfHeidmann J., Heidmann N. & de Vaucouleurs G.: 1972 Mem. Roy. Astron. Soc. 75, 85 \rfLongo G. & de Vaucouleurs, A. : 1983, 1988 “A general catalogue of photoelectric magnitudes and colors … ”. The University of Texas Monographs (two volums). \rfReynolds R.H. : 1913 MNRAS 74, 132. \rfSandage A.R.: 1961, “The Hubble Atlas of Galaxies”, Washington D.C, Carnegie Institute of Washington. \rfThomasson, M., and Donner, K.J.: 1993, Astron.Astrophys. 272,153. \rfYun M.S., Ho P.T. & Lo K.Y.: 1994 Nature 372, 530. \abe\addressesHamed Abdel-Hamid
National Research Institute of
Astronomy and Geophysics
11421 Helwan, Cairo
Egypt.
E-mail hamid@nriag.sci.eg or hamed_a2000@yahoo.com
Peter Notni
Astrophysikalisches Institut Potsdam
D – 14482 Potsdam
Germany
E-mail pnotni@aip.de