Extremely red galaxy counterparts to 7C radio sources
Abstract
We present imaging of seven radio galaxies from the 7C Redshift Survey (7CRS) which lack strong emission lines and we use these data to investigate their spectral energy distributions (SEDs) with models which constrain their redshifts. Six of these seven galaxies have extremely red colours () and we find that almost all of them lie in the redshift range . We also present near-infrared spectroscopy of these galaxies which demonstrate that their SEDs are not dominated by emission lines, although tentative lines, consistent with H at and , are found in two objects. Although the red colours of the 7CRS galaxies can formally be explained by stellar populations which are either very old or young and heavily reddened, independent evidence favours the former hypothesis. At at least of powerful radio jets are triggered in massive () galaxies which formed the bulk of their stars several Gyr earlier, that is at epochs corresponding to redshifts . If a similar fraction of all radio galaxies are old, then extrapolation of the radio luminosity function shows that, depending on the radio source lifetimes, between 10 – 100 % of the near-IR selected extremely red object (ERO) population undergo a radio outburst at epochs corresponding to . An ERO found serendipitously in the field of one of the 7CRS radio sources appears to be a radio-quiet analogue of the 7CRS EROs with an emission line likely to be [OII] at . The implication is that some of the most massive elliptical galaxies formed the bulk of their stars at and these objects probably undergo at least two periods of AGN activity: one at high redshift during which the black hole forms and another one at an epoch corresponding to .
keywords:
galaxies: active – galaxies: evolution – galaxies: formation1 Introduction
At both low and high redshifts, powerful radio sources are believed to reside exclusively in giant elliptical galaxies or their progenitors. Surveys of radio galaxies and radio-loud quasars can therefore be used to trace the evolution of such massive galaxies over cosmological timescales. 3C radio galaxies at show extended continuum and emission line structures aligned along their radio axes (McCarthy et al. 1987; Chambers et al. 1987). Investigation of the cause of this so-called ‘alignment effect’ has shown that, while this is not due to the bulk of the stellar population, a single mechanism, e.g. recent star-formation or dust-scattered quasar light, cannot account for all cases (Best et al. 1997). Best et al. and Blundell & Rawlings (1999) have pointed out the importance of factoring in source age to the interpretation of this. However, it is clear that the strength of the alignment effect decreases with decreasing radio luminosity (Lacy et al. 1999a) and is weaker in the observed-frame near-infrared than in the optical (Dunlop & Peacock 1993; Eales et al. 1997). Dunlop & Peacock (1993) found that the colours of lower power radio galaxies are consistent with evolved stellar populations. The same is true of the host galaxies of 3C sources at , once the aligned component has been taken into account (Best et al. 1998).
The reddest radio galaxy in the 3CRR sample of Laing, Riley & Longair (1983) is 3C 65. The light from this object has been shown to be dominated by a very old stellar population ( Gyr; Lacy et al. 1995; Stockton, Kellogg & Ridgway 1995) although a reddened quasar nucleus seems to make some contribution to its red colour (Lacy et al. 1995; Simpson, Rawlings & Lacy 1999). Two extremely red radio galaxies at have subsequently been discovered in the follow-up of the faint Leiden Berkeley Deep Survey (LBDS 53W091 — Dunlop et al. 1996; LBDS 53W069 — Dunlop 1999). Keck spectroscopy of these galaxies shows that their optical continua are dominated by very old stellar populations: ages Gyr according to Spinrad et al. (1997) and Dunlop (1999) although ages are preferred by Yi et al. (2000). These observations indicate very high formation redshifts () for the bulk of stars in such galaxies. Peacock et al. (1998) showed that such high formation redshifts are consistent with our current knowledge of the cosmic power spectrum on Mpc scales.
Near-infrared (near-IR) surveys have discovered a population of galaxies which are very faint or undetected at optical wavelengths (e.g. Elston, Reike & Reike 1988, 1989; Hu & Ridgway 1994). Galaxies with observed colours of have come to be known as Extremely Red Objects (EROs). With the advent of wide-field near-IR detectors it is now possible to detect large numbers of such objects. There are generally two ways in which such red optical to near-IR colours can be achieved; an evolved stellar population at or a highly reddened, dusty starburst or AGN. Much activity is currently focussed on trying to understand which of these two types of object dominate the observed EROs. As yet, there are only a few clear determinations for individual sources. The ERO HR 10 has been found to be a very dusty, ultra-luminous infrared galaxy at (Dey et al. 1999). At the time of writing this is the only near-IR selected ERO which has been shown to have its extreme colours due to dust, however some of the optical counterparts of sub-mm blank-field surveys are also found to be extremely red (Smail et al. 1999). In contrast, there are a couple of EROs which appear to be unreddened evolved stellar populations at (CL0939+4713B - Soifer et al. 1999; HDFS 223251-603910 - Stiavelli et al. 1999). Near-IR spectroscopy by Cimatti et al. (1999) has shown the majority of a sample of nine red galaxies with appear to be old stellar populations at , with only a couple of cases of possible dusty starbursts. Studies with the Hubble Space Telescope (HST) show the majority of EROs to have E/S0 morphologies (Moriondo, Cimatti & Daddi 2000; Stiavelli & Treu 200). The detection of a strong clustering signal in the ERO population (Daddi et al. 2000a) is in agreement with the hypothesis that massive evolved galaxies dominate the population.
The exact nature of extremely red galaxies is an important test of models of galaxy formation and evolution. A high space density of EROs which are evolved, elliptical galaxies at intermediate redshifts would mean high formation redshifts for most massive galaxies. However, if the EROs are due to ongoing dusty star-formation, possibly in mergers, it would support certain hierarchical models for galaxy formation. The likely redshift range of EROs in near-IR samples limited to is . The main reason for the lower redshift limit is that the continuum below the 4000 Å break passes into the observed -band, while the upper redshift limit is the result of an upper limit to the intrinsic stellar luminosity of a galaxy. Note that the radio-selected EROs from the LBDS survey have a co-moving space density times lower than that of the near-IR selected EROs.
We have been working on securing optical identifications and redshifts for a complete sample of 76 radio sources selected at a low radio frequency, namely 151 MHz. The flux-density limit for this sample — the combination of the 7C-I and 7C-II regions of the 7C Redshift Survey (hereafter referred to as the 7CRS) — is Jy and the total sky area covered by regions I and II is 0.013 sr. The flux-density limit is a factor of 25 lower than the 3CRR sample and a factor of 40 higher than the 2 mJy 1.4 GHz LBDS survey (assuming a radio spectral index of 0.8). The lower flux-density selection than the 3CRR sample means we expect little contribution from non-stellar emission to the optical continua of 7CRS radio galaxies (c.f. Lacy et al. 1999a). All the sources have been identified at -band and optical spectroscopy has led to redshifts for 90% of the sample (Willott et al., in prep. and Blundell et al., in prep., will present full details of the 7C-I and 7C-II samples). The seven sources for which optical spectroscopy did not secure a redshift are very faint or invisible in our optical images and have red optical-to-near-IR colours. Four of them are bona-fide EROs with , of which the most extreme example is undetected at -band with . Since complete redshift information is crucial for deducing the nature and evolution of radio sources, we have obtained multi-colour photometry for these objects in order to model their spectral energy distributions (SEDs) and hence constrain their redshifts. In addition, we have obtained some low-resolution near-infrared spectroscopy to search for emission lines and/or breaks in the continuum.
In this paper, we use these observations to constrain the redshifts of these sources and attempt to determine whether their extremely red colours are due to old stellar populations or to the effects of dust reddening on a younger population. In Section 2 we list the objects studied in this paper and discuss their colours in the context of the sources with spectroscopic redshifts in the 7CRS. In Section 3 we present our observations and in Section 4 we describe the SED fitting technique used. A discussion of the SED fitting for individual objects follows in Section 5. In Section 6 we review the reliability of the redshift estimation. In Section 7 we discuss the implications of our findings with respect to radio galaxies, the field ERO population and the galaxy population in general. We report on the serendipitous discovery of a radio-quiet ERO with a spectroscopic redshift of in the appendix. We assume that and consider two spatially-flat cosmologies: , and , .

2 The sample
In this paper we investigate the nature of the seven radio sources without redshifts from optical spectroscopy in the 7C-I and 7C-II regions (based on the 5C6 and 5C7 regions, respectively, of Pearson & Kus 1978). Although the flux-density limit of the survey is based on the 7C survey at 151 MHz, all seven sources without redshifts also happen to be catalogued 5C sources. They are:
| 5C6.17 | (02 06 22.08 +34 14 25.2) |
|---|---|
| 5C6.62 | (02 10 29.70 +32 54 02.7) |
| 5C6.83 | (02 11 11.23 +30 39 50.5) |
| 5C6.242 | (02 18 17.51 +31 03 24.5) |
| 5C7.47 | (08 12 38.81 +24 56 13.8) |
| 5C7.208 | (08 20 18.77 +25 06 21.6) |
| 5C7.245 | (08 22 56.04 +26 53 48.2) |
where the positions in brackets are epoch B1950.0 and refer to the location of the -band identification. Radio positions from the 7C survey and our own VLA maps will be presented in Blundell et al. (in prep.). All these sources have been observed at low spectral resolution with the ISIS spectrograph at the WHT with exposures of between 30 and 60 minutes. Only for 5C7.47 was weak continuum detected; in all other cases no lines or continuum were detected. Details of this optical spectroscopy will be given in Willott et al. (in prep.).
In addition, we include in this study one further source with red optical to near-IR colours, whose redshift was one of the final ones to be secured from our optical spectroscopy runs. This object, 5C7.271 (08 26 00.89 +25 04 01.8, B1950.0) has a redshift (Willott et al., in prep.).
| Name | Telescope+ | Date | Filter | Exposure | Seeing | Magnitude | Magnitude |
|---|---|---|---|---|---|---|---|
| Instrument | time (s) | (arcsec) | 3” aperture | 5” aperture | |||
| WHT+AUX | 95Jan25 | 300 | 0.7 | 24.5 | 24.0 | ||
| INT+WFC | 98Jul27 | 1200 | 1.0 | 22.66 0.15 | 22.11 0.16 | ||
| 5C6.17 | UKIRT+IRC3 | 97Jan29 | 1080 | 0.8 | 20.30 0.11 | 20.10 0.15 | |
| UKIRT+IRC3 | 96Jul29 | 540 | 1.1 | 19.09 0.13 | 18.98 0.20 | ||
| UKIRT+IRC3 | 96Feb13 | 1440 | 1.4 | 18.41 0.07 | 18.03 0.09 | ||
| MCD+IGI | 99Oct10 | 1800 | 1.7 | 24.57 0.45 | 24.3 | ||
| NOT+BRO | 96Jul23 | 1800 | 1.3 | 23.09 0.38 | 22.76 0.45 | ||
| 5C6.62 | UKIRT+IRC3 | 96Jan21 | 1080 | 1.4 | 20.69 0.18 | 20.25 0.21 | |
| UKIRT+IRC3 | 97Jan30 | 480 | 1.1 | 19.01 0.10 | 18.51 0.11 | ||
| UKIRT+IRC3 | 96Jul21 | 540 | 1.0 | 18.04 0.08 | 17.53 0.09 | ||
| WHT+AUX | 95Jan31 | 300 | 0.6 | 24.5 | 24.0 | ||
| INT+WFC | 98Jul27 | 1200 | 1.5 | 23.8 | 23.3 | ||
| 5C6.83 | UKIRT+IRC3 | 97Jan29 | 1080 | 1.2 | 20.24 0.11 | 19.97 0.15 | |
| UKIRT+IRC3 | 97Jan29 | 1080 | 1.1 | 19.21 0.08 | 18.94 0.10 | ||
| UKIRT+IRC3 | 97Feb29 | 1080 | 1.2 | 18.27 0.08 | 18.16 0.13 | ||
| WHT+PFC | 95Nov11 | 1800 | 1.6 | 26.1 | 25.6 | ||
| KECKII+LRIS | 98Oct12 | 300 | 0.6 | 25.2 | 24.7 | ||
| 5C6.242 | UKIRT+IRC3 | 97Jan29 | 1080 | 1.1 | 20.96 0.25 | — | |
| UKIRT+IRC3 | 96Oct29 | 1620 | 1.7 | 19.84 0.40 | — | ||
| KECK+NIRC | 98Oct12 | 540 | 0.6 | 18.75 0.10 | 18.58 0.10 | ||
| WHT+AUX | 95Jan31 | 900 | 0.7 | 23.49 0.12 | 23.72 0.28 | ||
| 5C7.47 | UKIRT+IRC3 | 97Jan29 | 1080 | 0.8 | 21.22 0.30 | —- | |
| UKIRT+IRC3 | 97Jan29 | 1080 | 0.8 | 19.96 0.20 | 19.99 0.25 | ||
| UKIRT+IRC3 | 96Jan21 | 4320 | 1.0 | 19.49 0.10 | 19.34 0.15 | ||
| WHT+AUX | 95Jan31 | 300 | 0.7 | 23.65 0.21 | — | ||
| WHT+AUX | 97Apr07 | 900 | 0.7 | 23.26 0.23 | — | ||
| 5C7.208 | UKIRT+IRC3 | 97Jan29 | 540 | 1.2 | 20.28 0.16 | 19.63 0.15 | |
| UKIRT+IRC3 | 97Jan29 | 540 | 1.1 | 19.17 0.13 | 18.83 0.17 | ||
| UKIRT+IRC3 | 95Mar01 | 1620 | 1.1 | 18.08 0.08 | 17.68 0.06 | ||
| MCD+IGI | 95Nov19 | 1500 | 3.2 | 25.0 | 24.5 | ||
| WHT+AUX | 97Apr07 | 900 | 0.7 | 24.3 | 23.7 | ||
| 5C7.245 | UKIRT+IRC3 | 97Jan29 | 1080 | 0.9 | 21.01 0.18 | 20.69 0.23 | |
| UKIRT+IRC3 | 97Jan29 | 1080 | 0.9 | 19.94 0.13 | 19.50 0.14 | ||
| UKIRT+IRC3 | 95Mar01 | 2700 | 1.2 | 19.14 0.08 | 18.73 0.10 | ||
| MCD+IGI | 95Nov19 | 900 | 2.2 | 24.5 | 24.0 | ||
| WHT+AUX | 97Apr08 | 600 | 0.7 | 24.0 | 23.5 | ||
| 5C7.271 | UKIRT+IRC3 | 97Jan29 | 1080 | 0.8 | 21.02 0.18 | 21.15 0.34 | |
| UKIRT+IRC3 | 97Jan29 | 1080 | 0.8 | 19.78 0.13 | 19.54 0.18 | ||
| UKIRT+IRC3 | 96Jan21 | 1620 | 1.1 | 18.94 0.09 | 18.79 0.13 |
Before we discuss these objects in detail it is instructive to consider the optical/near-IR properties of the 7CRS. In Fig. 1 we show the colour versus redshift diagram for the 7C-I and 7C-II regions of the 7CRS. The quasars are well-separated from the radio galaxies on this diagram and in general have values similar to those expected by redshifting the optically-selected LBQS composite spectrum of Francis et al. (1991). Although there is scatter in the quasar colours it is found that the reddest quasars are those at the highest redshifts. This will be discussed in a future paper. Radio galaxies on the plot have been divided into two groups depending upon their emission line luminosities, as in Willott et al. (2000a). Those with narrow [OII] emission line luminosities are shown as open circles, while those with lower emission line luminosities are shown as open triangles. The solid curves are models featuring an instantaneous starburst at redshift for two cosmological models. At redshifts the colours of the radio galaxies fall nicely on the model curves suggesting that these colours result from very old galaxy populations with little (unobscured) current star-formation. In particular there is an excellent match between the upper envelope of the observed colours and the , model. Deviations to bluer colours can be caused by a small amount of more recent star-formation.
Moving to we find a marked increase in the scatter of the colours of the radio galaxies. This is probably due to a combination of two effects. First, at redshifts higher than , the observed -band samples the rest-frame light below the 4000 Å break. The ratio of fluxes below and above 4000 Å is a very strong function of the amount of current or recent star-formation. Therefore small differences in the amount of recent star-formation will have a more dramatic effect on the observed colour at . Lilly & Longair (1984) showed that the optical/near-IR colours of 3CR galaxies at are inconsistent with a no-evolution model. Their observed colours are similar to those of the bluest 7CRS radio galaxies. For the 3C objects these colours are best explained by recent star-formation in a few cases (Chambers & McCarthy 1990), but in most cases, as further evidenced by large optical polarizations (e.g. di Serego Alighieri et al. 1989; Tadhunter et al. 1992), they are probably caused by an extra non-stellar rest-frame UV component, typically scattered light from the quasar nucleus (see Best et al. 1998).
It is clear from Fig. 1 that the bluer 7CRS galaxies are much more likely to have redshifts measured from optical spectroscopy. There is also a tendency for the galaxies with high emission line luminosities (circles) to be bluer than those with low emission line luminosities (triangles). These observations show that the bluer sources have stronger emission lines and are therefore good candidates for having non-stellar (AGN) and/or starburst components in the rest-frame UV [a similar result was found by Dunlop & Peacock 1993 for radio galaxies from the Parkes Selected Regions (PSR)]. The large scatter observed for the high- 7CRS radio galaxies is however, quite different from the small scatter in this diagram for PSR galaxies. With colours in all cases at , the PSR galaxies are similar to the bluest galaxies in the 7CRS, although this could be partly due to selection effects, since in 1993 only a fraction of the PSR sample had spectroscopic redshifts (and these were most likely to be biased in favour of the bluer objects, as is seen for the 7CRS). At , radio galaxies from the 6CE sample, which has a flux-limit in between those of 3CRR and the 7CRS, also tend to have strong emission lines and blue colours (Rawlings, Eales & Lacy 2000).
Note from Fig. 1 that the reddest 7CRS EROs are not necessarily intrinsically redder (in the rest-frame) than the low-redshift radio galaxies. It is the effect of the steep spectrum of an evolved galaxy below the 4000 Å break passing through the -band which has a marked effect on the observed colour at . There are two 7CRS radio galaxies which are at and have very red () colours. These both have spectroscopic redshifts, have been imaged with the Hubble Space Telescope and are the subject of a future paper.
3 Observations
3.1 Optical and near-infrared imaging
Near-infrared imaging observations in the , and bands were made for all 8 members of the sample studied here using the IRCAM3 detector on the United Kingdom InfraRed Telescope (UKIRT). A deeper -band image of 5C6.242 has since been obtained from the Keck telescope equipped with NIRC (thanks to C. Steidel). Table 1 details these observations. The near-IR images were generally taken in multiples of 9 minutes, with a minute at each position of a 9-point mosaic with typical offsets of 10 arcsec. This method provides good flat-fielding and sky-subtraction and enables cosmic rays and bad pixels to be easily removed. The basic data reduction steps were (i) subtract dark frame; (ii) flat-field using a flat created from median–filtered object images; (iii) mosaic and combine the individual object images correcting for atmospheric extinction, using a bad pixel mask and cosmic ray rejection; (iv) fit astrometric solution using stars from HST Guide Star Catalogue or APM catalogue; (v) aperture photometry subtracting off the background. In all cases (except 5C7.208 – see Section 5) the radio source counterpart could unambiguously be identified in the -band image by comparison with the radio images in Blundell et al. (in prep.).
All the near-IR imaging was performed in photometric conditions apart from the -band image of 5C6.242. From photometric standards observed before and after this target we estimate that there was 0.8 mag of extinction in -band; during the course of the 27 minute exposure the magnitudes of bright objects in the field varied by 0.6 magnitudes. We therefore assign a large uncertainty of mag to the -band magnitude of this object.
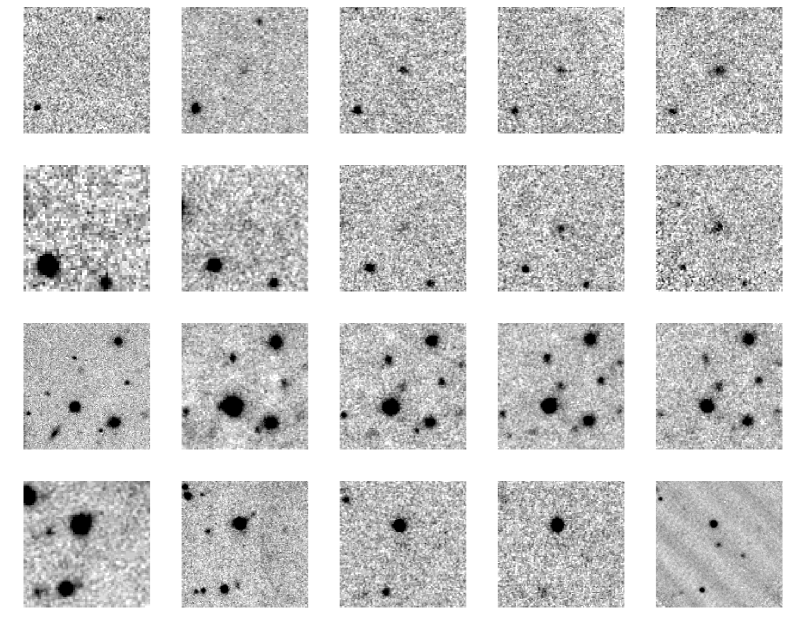
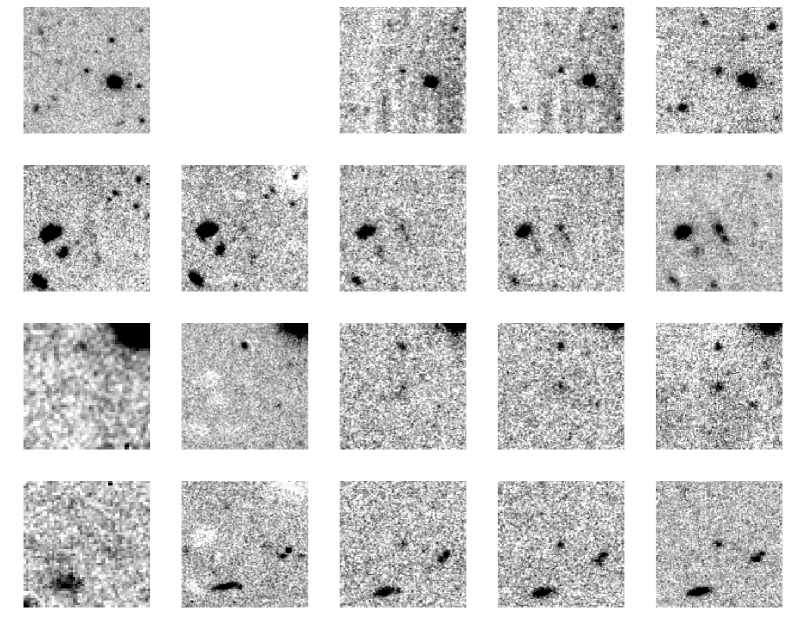
Optical (- and -band) images were obtained from a range of telescopes and instruments as detailed in Table 1. 5C7.47 was not observed in -band. The data were reduced using standard procedures. The steps involved were (i) subtract bias frame; (ii) flat-field using twilight sky or dome flats; (iii) correct for atmospheric extinction; (iv) subtract sky background (including fringing for some -band images); (v) combine individual frames (when appropriate), rejecting cosmic rays; (vi) astrometry; (vii) aperture photometry. For about half the targets no reliable identification at the position of the near-IR counterpart was found in either or both the optical images. In these cases we have adopted a 2 upper limit on their fluxes as indicated by the symbol in Table 1. The optical and near-IR images are shown in Figs. 2 and 3.
3.2 Infrared spectroscopy

| Name | Instrumental | Wavelength | Date | Exposure | Slit width | Line flux limit |
|---|---|---|---|---|---|---|
| Setup | Coverage (m) | time (s) | (arcsec) | (W m-2) | ||
| 5C6.17 | 40 l mm-1 + L | 1.5 — 2.1 | 97Dec30 | 2400 | 2.4 | |
| 5C6.62 | 40 l mm-1 + L | 1.5 — 2.1 | 97Dec29 | 3360 | 4.8 | |
| ” | 40 l mm-1 + L | 1.9 — 2.5 | 97Dec13 | 2400 | 4.8 | |
| 5C6.83 | 40 l mm-1 + L | 1.5 — 2.1 | 97Dec11/30 | 4480 | 4.8 | |
| 5C7.208 | 75 l mm-1 + S | 1.5 — 2.1 | 97Jan30 | 1600 | 2.4 | |
| ” | 40 l mm-1 + L | 1.9 — 2.5 | 97Dec12 | 1320 | 4.8 | |
| 5C7.245 | 75 l mm-1 + S | 1.5 — 2.1 | 97Mar13 | 2160 | 2.4 | |
| ” | 75 l mm-1 + S | 1.9 — 2.4 | 97Mar13 | 1600 | 2.4 |
We observed 5 of the 7 galaxies without optical spectroscopic redshifts with the CGS4 near-infrared spectrograph on UKIRT. The aim of these observations was to search for emission lines or continuum breaks to determine the redshifts. All the targets were observed in the -band and some were also observed in the -band. -band was chosen because it is where one would expect to observe H over much of the redshift range with no bright lines in the optical (). Details of the observations are given in Table 2. The observing method used was that of Eales & Rawlings (1993) and involved 2x2 sampling, which achieves Nyquist sampling by stepping the array by 0.5 resolution elements and ensures that each wavelength is sampled by 2 pixels (to facilitate bad pixel removal). Conditions were photometric throughout.
The observations were reduced in a standard way. Briefly, the steps involved were (i) combine flat-fielded observations taken at different positions along the slit; (ii) wavelength calibrate using sky OH emission lines and subtract residual background; (iii) extract 2 pixel (1.2 arcsec) and 6 pixel (3.6 arcsec) wide aperture spectra from the 2-D images; (iv) combine ‘positive’ and ‘negative’ spectra; (v) flux-calibrate using standard stars; (vi) remove atmospheric absorption by dividing by normalised A or F stars.
Weak continua were detected in all these spectra. No obvious breaks in the continua were found, but our limits on any break are not very stringent. For two objects, possible emission lines were observed in the -band spectra. For the other objects we are able to place limits on any emission lines in regions covered by the spectra. For 5C6.62, the possible line is at m and has a FWHM velocity width of 1700 km s-1. The line flux is W m-2, so the detection is at the 3 level. For 5C7.245, the observed probable line is also at about the 3 level with a flux of W m-2. The line centre is m and the FWHM is 1200 km s-1. In both cases the line widths are at roughly the level of the instrumental resolution, so they may be intrinsically narrower than this. Fig. 4 shows the extracted spectra with these features marked. The most likely emission line to detect in -band is H, because of the suspected redshifts of for these objects. Making the assumptions that these lines are real and identifying them with H leads to redshifts of for 5C6.62 and for 5C7.245. In Section 5 we will discuss how these values fit with other evidence.
The expected H fluxes for 7CRS radio galaxies at can be determined from the emission line — radio correlation discussed in Willott et al. (1999). It is found that the typical flux should be W m-2. This is similar to the limits obtained from spectroscopy. Therefore our inability to detect lines in most sources does not rule out that they have H in the -band. In fact, this shows that our detection of a line in two sources is just as expected, given the scatter in this relationship. More importantly, the lack of very strong lines dominating the near-IR emission (and the spectroscopic detection of continua in all cases) enables us to be confident about modelling the SEDs of these sources in terms of continua.

4 SED fitting
The tightness of the near-infrared Hubble diagram (also known as the relation) for 3C radio galaxies (Lilly & Longair 1984) has led to its widespread use as a redshift indicator for radio galaxies for which no spectroscopic redshift has been obtained (e.g. Dunlop & Peacock 1990). However, Eales et al. (1993) found that there is increased scatter beyond and this limits its usefulness at faint magnitudes as a redshift indicator. In Fig. 5 we show the relation for the 3CRR, 6CE and 7CRS complete samples of radio galaxies. Eales et al. (1997) found that 6CE galaxies at were systematically fainter at -band than 3C galaxies of the same redshift. This correlation between -band luminosity and radio luminosity is confirmed with the addition of the 7CRS data (Fig. 5) and appears to be present across the whole redshift range of the sample. This casts serious doubt on naive use of the relation as a redshift indicator.
Observations show that the -band light is dominated by stars for most of the objects on this plot, with negligible non-stellar contamination in most cases (e.g. Best et al. 1998; Simpson et al. 1999). Since the -band light of galaxies is dominated by stars of approximately solar mass (which make up the bulk of the total stellar mass of galaxies), the -band luminosity is a good tracer of the total stellar mass of the galaxies. The model curves on Fig. 5 show non-evolving and passive evolution and galaxies as a function of redshift. The passive evolution model assumes the stars in the galaxies formed at .
It is clear that there is some evolution in the relation for radio galaxies, especially for low values of . However, as noted by Lilly & Longair (1984) and Eales et al. (1997), passive evolution of galaxies formed at high redshift () is sufficient to explain the observations. We find that a range of luminosities between and is required to account for the radio galaxies. The high luminosities show that all these radio galaxies are very massive ( in stars) — a feature which is key to our discussion in Section 7. The diagram for the 3CRR, 6CE and 7CRS samples will be discussed in more detail in a future paper (see also Lacy, Bunker & Ridgway 2000).
Given the fairly large scatter in this relationship at high-redshifts we conclude that the only reliable redshift constraints that can be inferred are for and for . It is clear that for objects fainter than (i.e. all those in this study) no firm upper limit on the redshift can be obtained from the relation (particularly because at the highest redshifts, the -band is actually probing optical light which is far more easily contaminated by non-stellar light). It is for this reason that we have obtained the data presented here in order to better constrain the redshifts of these radio galaxies.
The imaging data allow us to place strong constraints on the observed-frame optical–near-IR spectral energy distributions of these extremely red objects. If one assumes that the observed SED is dominated by light from a stellar population in the galaxy, then the redshifts can be well-constrained (possible deviations from this assumption will be discussed in Section 5). Often just three variables are considered in this type of work: redshift, age of the stellar population and a normalisation (equivalent to the luminosity or mass of the galaxy). However, in the light of the continued debate about the nature of EROs, it is also beneficial to include an extra variable — the reddening of the SED by dust.
In the fitting procedure we describe here, a sample of 12 simple stellar populations (instantaneous burst) from the GISSEL96 models of Bruzual & Charlot (in prep.) are adopted for the galaxy SEDs. These models have ages of 0.01, 0.05, 0.1, 0.3, 0.6, 1.0, 1.4, 2.0, 2.5, 3.0, 3.5, 4.0 Gyr. The range of ages adopted were chosen because of the expectation that many of the galaxies would be old ellipticals. Therefore we want increased time resolution (in terms of the logarithm of the age) at large ages, especially since the shape of the SEDs does not change greatly for ages above 2 Gyr. We only consider solar metallicities, since there is a well-known degeneracy between metallicity and age; one should always bear in mind that an old galaxy SED can probably be equally well-fit by a younger galaxy with higher metallicity (Worthey 1994). We have not incorporated more complex models such as ongoing star-formation or combined multiple-age populations, since this would lead to a large increase in the number of models. For our purposes the instantaneous burst models should be sufficient, since they give a lower limit to the age.
The question of what effect dust-extinction has on the observed SED of a dusty galaxy is complex and poorly understood. Scattering and absorption, combined with the uncertainty of the dust distribution relative to the light distribution as a function of wavelength, complicate this issue. We assume here that the effects of dust extinction follow the extinction law of Calzetti (1997). We consider extinctions in the range in steps of 0.1; for the Calzetti law, the visual extinction .
For the above range of models, we have calculated the expected observed , , and colours as a function of redshift, taking into account the filter/detector response. Thus for a range of model -magnitudes (within of the observed -magnitude), we have model magnitudes in all bands. These were then converted to fluxes and compared to the observed fluxes using a test to determine the goodness-of-fit as a function of redshift, age and reddening. In the case of non-detection of the object in one of the filters, the flux in this filter was set to zero and the photometric error obtained from the image. The reduced was calculated by dividing by the number of data points.
Figs. 6 and 7 show the results of this fitting process for the 7C—I (5C6) and 7C—II (5C7) sources respectively. For each source the left panel shows the optical and near-IR photometry, overlaid with the best-fit reddened [ – dotted line] and unreddened [ – solid line] galaxy models. The parameters of the best-fits are given in the bottom-right corner of the panel along with the reduced . The centre and right panels show the reduced contours as a function of age and redshift (centre) and age and reddening (right). Fits with reduced were found for six objects and the remaining two had best-fit reduced . To estimate the errors on the best-fit parameters we consider all models with reduced as acceptable.
The results for each object will be discussed in the following section. A general point to note is the fairly wide range of parameters that provide acceptable fits for the objects. The degeneracy of age and reddening appears to be the strongest cause of this as shown by the diagonal shape of contours in the age-reddening plane (from old and dust-free at top-left to young and dusty at bottom-right). In contrast there is little correlation between redshift and age in the contours and the best-fit redshifts are in most cases similar for both the reddened and unreddened cases. Thus we will be able to provide strong constraints on the redshifts of these sources. However, the degeneracy between age and reddening (and also that between metallicity and age) make it very difficult to firmly constrain the ages of these objects from broad-band photometry alone.


5 Notes on individual sources
5C6.17
This is a large (47 arcsec) double radio source with a probable but weak radio core (detected at the 3 level). The presence of extended lobe emission and the large angular size strongly suggest a redshift (Blundell, Rawlings & Willott 1999). The near-IR counterpart is at the core position (within the uncertainties of the registration of the radio and optical astrometry frames, arcsec). This object is clearly extended in the 1 arcsec seeing and images. It lies in a fairly empty field with no companion galaxies detected in any of the images within a 10 arcsec radius.
The non-detection at -band gives (5 arcsec diameter aperture magnitudes are used here because the source is quite extended). However, its detection at -band gives which indicates a steepening of the SED between and . This steepening is best interpreted as the 4000 Å break falling between these bands. The SED fitting procedure supports this conclusion with a best-fit redshift of . The SED is fit slightly better by a heavily reddened stellar population and a 0.6 Gyr galaxy reddened by provides the best-fit, but no reddening and an age of 4 Gyr is still acceptable. There is a secondary minimum in the contours at , but we think this redshift extremely unlikely given the radio structure, the magnitude and the lack of a Lyman- emission line in the optical spectrum. With a 5 arcsec magnitude of , 5C6.17 falls at the faint edge of the relation at . For redshifts , this source would be over a magnitude fainter than the mean relation, so such low redshifts are unlikely on these grounds as well as being ruled out by the SED fitting.
At we would expect to have detected [OII] from the narrow line region in our optical spectrum with a flux in the range (Willott et al. 1999). The 3- limit on any narrow emission line in our 1 hour WHT spectrum is . Therefore reddening of the narrow line emission by (depending upon the intrinsic line luminosity) would be sufficient to render the line undetectable in our spectrum. In the case of no reddening, then the emission line strength of this object would have to be particularly weak relative to the other objects in the 7CRS at . It should also be noted that a redshift in the range 1.04 to 1.06 would place the [OII] line in the region of high atmospheric absorption and slightly higher redshifts possibly into the strong OH sky lines. Hence our inability to detect the [OII] emission line if 5C6.17 is at is not a serious concern.
5C6.17 has a redshift constrained to and the best-fit value of is adopted.
5C6.62
This is a double radio source with a weak core and angular size of 34 arcsec (Blundell et al., in prep.). The position of the near-IR/optical identification is coincident with the radio core. There is significant extended emission around the hotspots, one of which contains no compact features. These radio properties are suggestive of . The radio source identification is clearly extended in the 1 arcsec seeing and images and there are hints in the and images of an extension/companion to the south-east, although better images would be necessary to confirm this.
The galaxy is detected in all the filters, although the and -band detections have low signal-to-noise ratios (SNR); 3 arcsec aperture magnitudes are used to improve the SNR. 5C6.62 has a very red colour of 6.6. Between the and bands the SED is virtually a power-law with a slight flattening of the slope towards . The power-law slope with no sign of a break indicates that dust-reddening may be important in this object. Due to the rather large errors on the optical data, there are a wide range of models which provide acceptable fits and the plots are complex. The best-fit models are at , but the formal redshift range allowed by the fitting is . Only higher redshifts are strongly ruled out.
This is one of the two sources to have probable emission lines in their near-IR spectra. Taking the line to be H gives a redshift of . Note that 5C6.62 is the brightest object at -band out of those studied in this paper, with . The fact that it is resolved removes the possibility that a quasar component dominates. On the relation, this magnitude corresponds to 7CRS/6CE sources with . The evidence from the relation would appear to rule out the higher redshifts () compatible with the fitting. Assuming the redshift of from the spectroscopy, Fig. 6 shows the highest likelihood at this redshift () is for a young (100 Myr) galaxy with very high reddening []. This is clearly ruled out on luminosity grounds since it implies 2 magnitudes of reddening at the observed -band and an intrinsic . This is clearly not feasible for a radio galaxy. However, Fig. 6 also shows that a wide range of ages at fall within the region and therefore zero (or at least minimal) reddening is also acceptable.
The redshift of 5C6.62 is not well-constrained by the SED fitting. We adopt a redshift of based on the possible emission line detection in the -band spectrum. Taking into account the -band luminosity we find that the possible redshift range is .
5C6.83
This is a 14 arcsec double radio source (Blundell et al., in prep.). No radio core is detected, but the assumed near-IR counterpart lies midway between the two hotspots. The radio source lies in a crowded field with many objects visible in the optical and near-IR images. The brightest object is a star, but the next two brightest objects are both extended and would appear to be low redshift galaxies in a group/cluster. It is not possible to tell if all the fainter objects are resolved or not, but it appears that the radio source counterpart is slightly extended in the near-IR images.
Because of the good seeing in all images and fairly compact nature of the galaxy, 3 arcsec aperture photometry is used. The galaxy is undetected in the and images and has a colour . From the to bands the SED is equivalent to that of a galaxy population beyond the 4000 Å break. This constrains the redshift to . The sharp drop down to the faint and limits, combined with the near-IR data, can be fit by either an old stellar population with no dust reddening or a younger, heavily reddened population. Note that the best-fitting model has a reduced of 1.55, just beyond that formally acceptable. This model has an age of 0.6 Gyr and . The degeneracy between age and dust allows older, less-dusty models with only a small increase in . The redshift for this galaxy is well-constrained by the fitting process and although no formal range can be determined, Fig. 6 suggests that a range of is appropriate.
The magnitude of 18.0 is consistent with according to the relation. This redshift is in the difficult region without bright emission lines in optical spectra. The fitting allows redshifts up to . Redshifts in the range may be possible, but they would require a Ly line which is either intrinsically weak or extinguished by dust (e.g. Charlot & Fall 1993). We are left with the redshift range of , with a most-likely value of .
5C6.242
This is a small (5 arcsec) double radio source with a weak core. The near-IR counterpart is co-incident with the radio core. The Keck-II -band image with 0.6 arcsec resolution shows the counterpart to be resolved but fairly compact. There is another extremely red galaxy 7 arcsec south-west of the radio source. The bright object just north of the radio source is a star.
5C6.242 is not detected in our deep WHT -band image and there is only a hint of the object in the Keck -band image which is not statistically significant. It is detected in all the near-IR images. 3 arcsec aperture photometry is used because of the low SNR of the and detections. This is the reddest of all the objects studied in this paper with , although this may be because it has the deepest -band data and several other sources have only lower limits on their colours. The shape of the photometry from to is similar to that of a galaxy above the 4000 Å break, implying a redshift . The flux-density then plummets down to the and bands. The colour of is astonishing. The best-fit () model has a redshift of , age Gyr and . As with 5C6.83, an unreddened old galaxy gives a marginally worse fit. However, this model has an age of 4.0 Gyr at a redshift of 2.2, which is not allowed by some cosmological models (see Section 7.1).
With a -magnitude of 18.5, the relation suggests that 5C6.242 is extremely unlikely to be at . This is supported by the SED fitting which also excludes models at a high level of confidence. As with 5C6.83, we use Fig. 6 to get a rough range of allowed redshifts from the fitting. We conclude that the redshift of 5C6.242 lies in the region with a most-likely value of (although this requires weak Ly).
5C7.47
The optical/near-IR counterpart is co-incident with the position of this compact, but resolved (angular size arcsec) radio source (Blundell et al., in prep). This object is probably resolved in the good-seeing , and -band images. There is a bright () galaxy 7 arcsec west of the radio source which has optical and near-IR colours consistent with a galaxy at . There are two very red () objects within 20 arcsec of 5C7.47. The optical spectrum of one of these objects (ERO J081539+2446.8) has an emission line which is likely to be [OII] at . This object is discussed in detail in the appendix. Within 30 arcsec of 5C7.47 there are a large number of faint galaxies visible in both the and -band images. These galaxies have magnitudes of and . They would appear to be part of a cluster, although with their bluer colours than ERO J081539+2446.8 they may not be at the same redshift. In fact, they have similar colours to 5C7.47 and the cluster may host the radio source.
5C7.47 is unusual in our sample studied here because it is both the bluest galaxy with and the faintest at -band with a magnitude of 19.5 (3 arcsec aperture photometry used). The optical spectrum (60 minutes integration) shows a faint continuum all the way down to 3900 Å. Hence we can be sure of a redshift below 3.3 because of the absence of any observed Lyman limit. There are no clear emission lines in the spectrum to a 3 limit of . Note that we do not have any -band data for 5C7.47, so constraining the redshift is difficult. In addition the relative brightness at -band compared to that at may be indicating that the flux is dominated by non-stellar emission from the AGN. If this is the case, then the -magnitude cannot help us constrain the redshift and we are left with the data.
The contours from the SED fitting are rather complex and have low values at a range of redshifts. The best-fit model is a young dust-free galaxy at . The rapidly increases at redshifts greater than this, due to the fact that the flux-density is not greatly down on that at and . This would seem to be a fairly firm limit (as it is for all the objects discussed in this paper). If one assumes that the -band point is due to contamination from an AGN (and adopt a limit of for the stellar population), the best-fit redshift would be . The lower redshift limit cannot be determined by the SED fitting because of the small at all low redshifts. However, the fact that 5C7.47 is the faintest at -band suggests a fairly high redshift and the relation shows that is unlikely. Note that this explicitly assumes the host to be a massive galaxy which at least approximately follows the relation. If instead the host is a much less luminous galaxy then it could be at any low redshift (but the compact radio structure with little extended emission would be very unusual for such a low-redshift/luminosity radio galaxy). Adopting this assumption we find that the possible range of redshifts for 5C7.47 is . Once again weak Ly emission would be required for , which would be highly unusual for a powerful radio galaxy with an observed continuum down to virtually the wavelength of redshifted Ly. Therefore we assign a redshift of to 5C7.47.
5C7.208
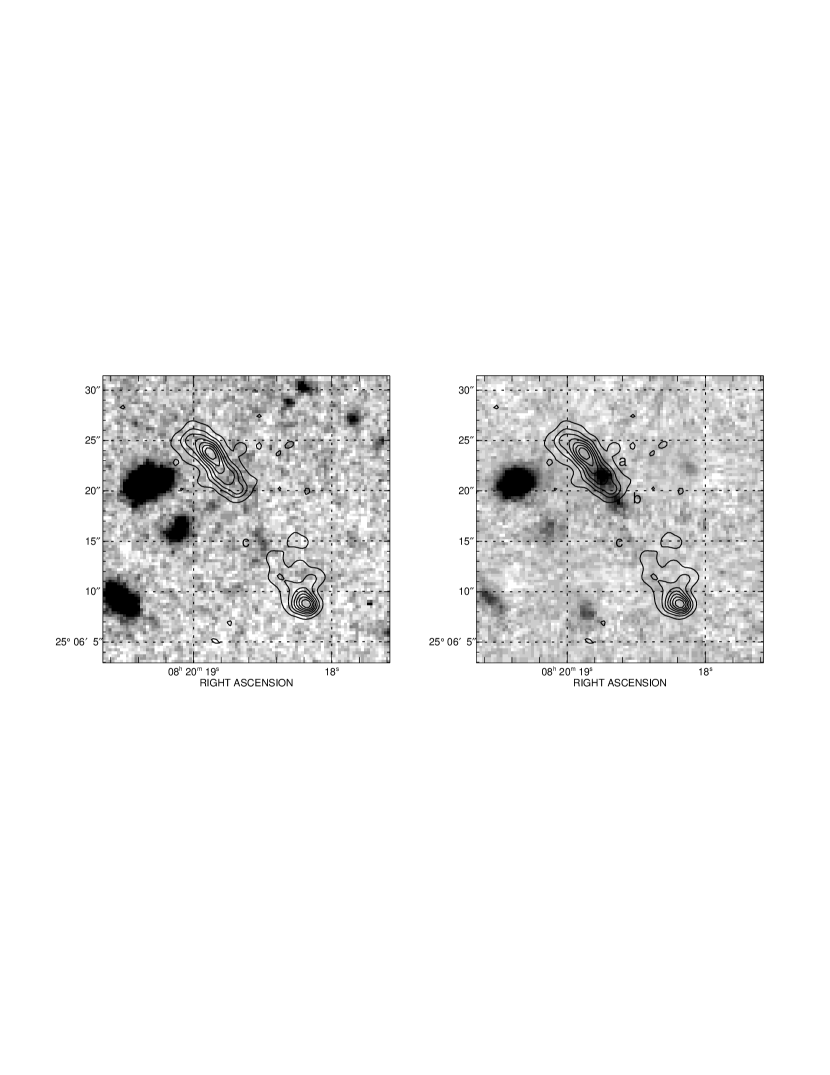
This is an 18 arcsec double radio source with some rather diffuse lobe emission near both hotspots (Blundell et al., in prep.). It is the only source discussed in this paper which shows clear evidence for a radio-optical alignment. There are two near-IR components separated by 2.9 arcsec at a position angle (east of north) of . This is within a couple of degrees of the radio axis (Fig. 8). We define the brighter (at -band) northern component ‘a’ and the fainter southern component ‘b’. There is more faint near-IR emission extending arcsec further south-west along a similar position angle, which we refer to here as component ‘c’. The colours of ‘a’ and ‘b’ are very similar and very red. Component ‘c’ has a much bluer colour and is brighter in the optical than ‘a’ or ‘b’. Lacy et al. (1999a) find some residual alignment effect (often occurring in discrete blobs) in low-luminosity radio sources such as those in the 7CRS. There are several bright, fairly blue galaxies in the field which would appear to be a group at low redshift.
Component ‘a’ is detected at reasonable signal-to-noise in all the images – 3 arcsec aperture photometry has been performed since the seeing was similar in all bands. ‘b’ is just visible in the and images but not at a sufficient significance level, so upper limits to these fluxes have been adopted. The optical spectra of Willott et al. (in prep.) shows weak, patchy continuum from ‘c’, but nothing at all from ‘a’ or ‘b’. No significant emission lines are observed in these spectra. We only consider here the SED of component ‘a’ since we suspect it is the radio source host galaxy (the position in Section 2 and magnitudes in Table 1 refer to this object). Note that since the colours of ‘a’ and ‘b’ are very similar, the modelling described is also applicable to ‘b’. ‘a’ has and is well-fit by a reddened [] young (0.3 Gyr) galaxy at . Unreddened, older galaxies at slightly higher redshifts are also not ruled out. The formal redshift range allowed is .
The flatness between and could be indicating a non-stellar component, but it is also fit by stellar populations as shown in Fig. 7. It is possible that this is a case of an alignment effect, but the spectral shapes of both ‘a’ and ‘b’ are strongly suggestive of stellar populations and not scattered quasar light. The most likely answer is that ‘a’ and ‘b’ are a pair of galaxies at the same redshift, which just happen to be aligned with the radio axis (see West 1991 and Eales 1992 for possible explanations of why companion galaxies may preferentially lie along the radio axes of radio galaxies). The -magnitude of ‘a’ is 17.7, consistent with a redshift .
We conclude that the redshift of 5C7.208 falls somewhere in the range and adopt from the SED fitting. Note that this fit is for a dusty galaxy and this might explain the lack of Ly in our optical spectrum.
5C7.245
This is another small (12 arcsec) double radio source (Blundell et al., in prep.). The north-west hotspot has a strange structure with two peaks in intensity separated by 3 arcsec. The near-IR identification is very close to the southern hotspot, along the radio axis, and definitely extended in the 0.8 arcsec seeing and images. The radio source lies in a fairly blank field with few other galaxies detected on our images.
Undetected in the and bands, 5C7.245 has (5 arcsec apertures used because of the varied seeing of the observations). As for most of the objects previously discussed, the spectrum is fairly flat between and and then drops rapidly to and . The SED fitting suggests an unreddened galaxy at with a formal range of .
The near-IR spectrum shows a probable emission line which we believe to be H at . The SED fitting and -magnitude are fully consistent with this.
5C7.271
This is a very small but resolved ( arcsec) radio source (Blundell et al., in prep.). The near-IR counterpart is co-incident with this radio position and is resolved in the 0.8 arcsec seeing and images. The few other objects in the field appear to be relatively low-redshift galaxies.
5C7.271 is undetected in the and band images and has a lower limit on its colour of (5 arcsec apertures used because of the varied seeing of the observations). The SED fitting gives a wide range of acceptable redshifts () with a best-fit value of . As mentioned in section 2, we acquired a spectroscopic redshift for this source of after we had obtained this imaging data. Since it has colours similar to the other objects studied here, we have used it to check the reliability of our SED fitting procedure. The similarity of the SED-fit redshift to the spectroscopic one is encouraging. Note that for this object there is quite a jump between and , compared to the other sources studied here. This is an indicator of its slightly higher redshift since the 4000 Å break has entered the -band.

6 Robustness of redshift estimates
Constraining the redshifts of all the radio sources in complete samples is extremely important. For example, only a few sources at in a sample such as this would refute the tentative evidence for a high-redshift decrease in the comoving space density of radio sources (Dunlop & Peacock 1990; Willott et al. 2000b). In Fig. 9 we show the redshift distribution of radio galaxies with spectroscopic redshifts in the 7C-I and 7C-II regions of the 7CRS. The seven sources with redshift estimates from this paper are also shown. Note that the distribution for spectroscopic redshifts is not smooth, with a peak at and another small peak at . Whilst redshift distributions such as this are not ruled out by models of the radio luminosity function (for example the dual-population model of Willott et al. 2000b predicts a peak at and another at for a Jy sample), the fact that the ‘hole’ in the redshift distribution occurs at is suggestive of selection effects. This is precisely the redshift range where there are no bright emission lines in optical spectra. Hence it does not seem too surprising that our estimated redshifts for the objects without narrow lines almost all fall in this region. A similar gap is found in the redshift distribution of sources in the 7C-III region, which has a similar fraction of faint red galaxies without spectroscopic redshifts (Lacy et al. 1999b, 2000).
It is informative to compare the redshift distribution of quasars in the 7CRS, which should have a similar redshift distribution to the radio galaxies according to unified schemes (at least for radio luminosities and hence in the 7CRS; see e.g. Willott et al. 2000a). For the quasars (7C-I and 7C-II only), we find no such gap at these redshifts (Fig. 9). This is easily explained because the quasars have strong broad C IV, C III] and Mg II lines in this redshift range, making redshift determinations easy.
This analysis of the redshift distribution supports our redshift determinations in Section 5 being predominantly in the range . Although for any individual object, there is a fair amount of uncertainty (typically ), for the ensemble of objects their redshifts are reasonably well-constrained. None of the galaxies could plausibly be at . At these high redshifts, all of the -band is below the 4000 Å break and a large drop in flux-density from to would be expected. The relative flatness of the SEDs from through to (combined with the sharp decrease in the optical) in all cases provides a very strong argument against such high redshifts. Redshifts less than 1 are unlikely given the lack of [OII] emission and the faint -magnitudes of the galaxies. Therefore we are confident that these redshift estimates are reasonable and this gives the 7C-I and 7C-II samples virtually complete redshifts, making them a powerful database for radio source studies. Initial results using these datasets can be found in Blundell et al. (1999) and Willott et al. (1998,1999,2000a,b).
7 Discussion
7.1 Old or dusty high-redshift galaxies
As we have seen in the fitting process, it is very difficult to be confident about the ages of the galaxies, because of the age–reddening degeneracy (and further uncertainty is due to the age-metallicity degeneracy). Spectroscopy of stellar absorption features will be required to provide strong constraints on the ages (e.g. Spinrad et al. 1997; but see below). This will be difficult even with 8-10 m class telescopes because of the faintness of the galaxies in the optical and the high sky background in the near-infrared. A less robust but more feasible method would be measuring the position of the 4000 Å break which would give a very reliable redshift and an indication of whether heavy dust-reddening is important (e.g. Soifer et al. 1999). Sub-mm detections would be expected for very dusty starbursts.
Two extremely red radio galaxies from the LBDS survey (LBDS 53W069 and LBDS 53W091) have Keck spectroscopy of their rest-frame UV spectra (Spinrad et al. 1997; Dunlop 1999). Fitting these spectra with stellar synthesis models gives ages of Gyr for both galaxies. The ages determined from fitting to the spectral features (which are reddening–independent) are older than those derived from continuum fitting – indicating that for these objects at least, reddening is not significant. Such a high age at this redshift indicates a high formation redshift of (in both of the cosmologies used in this paper) and apparently rules out cosmologies with simultaneously high values of both and . There has since been much controversy about the true ages of these galaxies with more than one group showing that alternative population synthesis models yield much smaller ages in the range Gyr (e.g. Bruzual & Magris 1997; Yi et al. 2000 – but see Nolan, Dunlop & Jimenez 2000). Therefore whilst it may be premature to use such objects as reliable cosmological parameter constraints, the existence of evolved ellipticals at these redshifts do indicate high formation redshifts for most of their stellar populations. Note that we have used the Bruzual & Charlot models in our analysis, which are at the lower end of the controversial range in ages. Also, Spinrad et al. (1997) found that fitting to spectral features in the rest-frame UV gives older ages than application of the Bruzual & Charlot models to broad-band colours. Therefore, our derived ages are certainly lower limits.
Finding similar objects to the LBDS radio galaxies at higher redshifts of (such as several of the objects presented in this paper) requires high formation redshifts even if these galaxies are 2 Gyr old, due to the rapidly decreasing time available at high redshifts. For example, at an age of 2 Gyr corresponds to for , or for , (all assuming km s-1 Mpc-1). Note that for a , Universe with an age of 13 Gyr (equivalent to that of the , Universe with ) km s-1 Mpc-1 is required giving .
Fig 9 shows that in the redshift range , only two of the eight galaxies in the 7CRS had redshifts determined from optical spectroscopy. These two galaxies, 5C6.217 and 5C7.57, do not have such red colours as most of the objects studied here (, Fig. 1). The presence of high-ionization lines in their optical spectra, such as C IV and [Ne V], may suggest this blue light is non-stellar in origin. Together with 5C7.47, we find that 3 of the 8 sources have fairly blue colours, but the remaining 5 all have . This shows that the UV continuum emission in higher power radio galaxies, such as those in the 3C sample, is negligible for the majority of 7CRS sources. At , Best et al. (1998) find the SEDs of 3C radio galaxies to be consistent with old ellipticals once the aligned emission has been accounted for. With just a modest increase in redshift, it would be a surprise to find that they are suddenly all very dusty starbursts. Sub-mm observations of 3C radio galaxies do not indicate a change from old ellipticals to dusty starbursts over this redshift range (Archibald et al. 2000).
Given the evidence above, we will hereafter make the assumption that these red colours are due to old stellar populations and not dust-reddening. Then we find that more than half of the galaxies hosting radio sources at these redshifts must have formed at very high redshifts (and if the three other objects are blue because of non-stellar continuum, they too may have underlying old ellipticals). These objects would appear to be very similar to low redshift ellipticals with little current star-formation. Their formation redshifts will be at for stellar ages Gyr (for , ). There is no evidence that these radio sources are in rich clusters from our images, with just a couple of cases of possible companions at the same redshift (5C7.208 and 5C7.47) but since we are only sensitive to luminous galaxies at these redshifts, one cannot put strong limits on the clustering around these sources.
The question then posed is if, as is normally assumed (e.g. Genzel, Lutz & Tacconi 1998), galaxy-galaxy mergers are the trigger for powerful radio jets, why is there no sign of any associated star-formation in these evolved galaxies? Whilst the theory that most high-redshift () radio galaxies have recent or ongoing massive star-formation (e.g. Chambers & Charlot 1990) has been challenged by the discovery that the UV-excesses in powerful radio galaxies are, at , typically due to non-stellar mechanisms (e.g. Cimatti et al 1997), there are certain clear-cut examples of powerful radio galaxies with huge current star-formation rates, e.g. the radio galaxy 4C41.17 (Dunlop et al. 1994; Dey et al. 1997). A clue to understanding why intense star formation only sometimes accompanies powerful radio jets may come from the very high detection rates achieved by sub-millimetre photometry of the highest-redshift radio galaxies (Archibald et al. 2000), suggesting an especially strong association between powerful radio jets and intense star formation in these systems. These systems differ from, for example the 7CRS galaxies studied here, in three crucial ways: (i) they are observed at earlier cosmic epochs, when gas reservoirs in galaxies were presumably less depleted (e.g. Storrie-Lombardi, McMahon & Irwin 1996); (ii) they possess intrinsically much more powerful jets (e.g. Rawlings & Saunders 1991), and are therefore plausibly much more massive systems (e.g. Efstathiou & Rees 1988); and (iii) their radio sources are necessarily observed years after the jet-triggering event (Blundell & Rawlings 1999). Some combination of these three effects can easily explain the lack of star-formation activity in the 7CRS EROs. Note that the radio source ages for all the 7CRS sources studied in this paper lie in the yr range (from equation 8 of Willott et al. 1999), which are plausibly times long enough after the jet-triggering event that any synchronized star formation has now faded (see also Best et al. 1998). Note that these radio source ages are in any case a factor of more than 10 times less than the time since the cessation of the major epoch of star-formation in these galaxies.
7.2 Relationship to the LBDS EROs
We now investigate how our finding of a large population of very red galaxies at compares with the similar discovery of red radio galaxies in the LBDS sample by Dunlop and collaborators (Dunlop et al. 1996; Spinrad et al. 1997; Dunlop 1999). They found two red radio galaxies with redshifts and in the 53W field of the LBDS survey which has a flux-limit of 2 mJy at 1.4 GHz. Peacock et al. (1998) determined the co-moving space density of these objects to be (adjusted for km s-1 Mpc-1 and assuming , initially). Applying a similar process to the red 7CRS galaxies (of which at least 6 at have - see Fig. 1), we find a co-moving density of . This is a factor of 10 lower than the density in the LBDS survey, which is roughly as expected since the fainter flux limit of the LBDS survey gives a surface density of radio sources times higher than in the 7CRS.
This hints that there is little correlation between the colours of galaxies and their radio luminosity, so long as one is well below the extreme radio luminosities of the 3C sample. For comparison, the typical radio luminosities of galaxies in these samples are (3CRR), 26.7 (7CRS), 25.5 (LBDS) . To get an estimate of the total space density of radio-loud EROs we integrate the radio luminosity function of Willott et al. (2000b) down over 2 orders of magnitude fainter than the 7CRS to . Radio sources with luminosities greater than or equal to this value are almost always due to active nuclei (for comparison M87 has ). If one now assumes a similar fraction of high- radio galaxies at these luminosities are red as in the 7CRS, the number density of very red radio galaxies would be . Note that this calculation does depend upon whether the form of the RLF of Willott et al. (2000b) can be reliably extrapolated this far. This RLF is consistent with the LBDS data, so any errors in the further extrapolation are likely to be minimal. It is worth recalling that these calculations are based on the few radio sources which appear to be extremely red. If the half of radio galaxies which are blue, are blue because of non-stellar emission, then their host galaxies (and indeed those of the quasars which exist in comparable numbers to radio galaxies) may also be very similar to the EROs. Hence all the number densities quoted above should be regarded as lower limits which could increase by a factor of up to if all sources contributing to the RLF at these redshifts (i.e. red radio galaxies, blue radio galaxies and quasars) have underlying evolved host galaxies.
7.3 Relationship to field EROs
The surface density of field EROs with is arcmin-2 (Daddi et al. 2000a; Thompson et al. 1999). A simple calculation (making the crude assumption that these sources lie randomly distributed in the redshift range – see e.g. Thompson et al. 1999) gives a volume density of near-IR selected EROs of . Note that the magnitude limit of this sample is similar to the magnitudes of the faintest 7CRS EROs, so we are comparing similarly luminous galaxies.
In the previous section we found that the number density of radio-loud () EROs is likely to be at least . This is a factor of 30 lower than the density of near-IR selected EROs. Hence we find that a small fraction ( %) of field EROs are likely to be hosting radio-loud AGN (these radio luminosities are much higher than are achievable by a typical ultraluminous starburst galaxy and therefore indicate powering by an active nucleus). This hypothesis is directly testable with a deep VLA survey of a large sample of near-IR selected EROs.
However, it is well-known that luminous radio sources have limited lifetimes ( years) which are much smaller than the Hubble time. The time elapsed between and is approximately 2 Gyr (for , ; the time elapsed is 3.5 Gyr for , ). Therefore if individual radio sources have lifetimes of only years, then the number of galaxies undergoing radio activity during this period would be a factor of 20 greater than that observed. Hence all of the near-IR selected EROs could plausibly undergo such a period of radio activity. A caveat to this is that the typical lifetimes of weak radio sources such as those which would dominate the ERO population are not well-constrained. Low-luminosity, typically FRI structure, sources could have much longer lifetimes of Gyr. In such a case, only % of high- EROs will undergo a period of radio activity at some point (but we note there is evidence that the age of the extended emission in the archetype low-luminosity radio source in M87 is only yr — Owen, Eilek & Kassim 2000 — and this may be typical for low luminosity radio galaxies). It is also possible that radio sources may undergo recurrent bursts of activity again reducing the fraction of EROs which have a period of radio activity at [there is no observational test for recurrent activity over these long timescales ( yr), but multiple radio outbursts over much shorter timescales ( yr) have been observed in a few sources — e.g. Schoenmakers et al. 2000].
The percentage of near-IR selected EROs which host radio-loud AGN derived above ( %) is subject to many uncertainties, not least arising from the masses (and hence -band luminosities) of the host galaxy counterparts being assumed to be similar for both the 7CRS EROs and for radio galaxies with still lower radio luminosities. Indeed, the number counts of EROs at are very steep (Daddi et al. 2000a), i.e. their space density increases sharply with decreasing -magnitude. However, there is no problem with the hypothesis that a significant fraction, and plausibly all, EROs go through an AGN phase at some point during the period corresponding to . The hardness of the X-ray background requires that the space density of optically-obscured quasars exceeds that of optically-luminous quasars (e.g. Comastri et al. 1995; Wilman & Fabian 1999), which in turn are well known to outnumber radio-loud quasars by at least an order of magnitude. Many of the hard X-ray sources discovered in Chandra surveys have very red galaxy counterparts with weak or absent emission lines (Mushotzky et al. 2000; Crawford et al. 2000). These objects may well be the radio-quiet analogues of the 7CRS EROs discussed here (such as the ERO in the field of 5C7.47 which is discussed in the appendix). The hard X-ray properties of the ERO population will be investigated with XMM-Newton and Chandra surveys of ERO fields. Such studies will accurately determine the AGN contribution, but if radio-quiet quasars have limited lifetimes, they will not detect objects which are undergoing inactive phases.
A comparison of the space densities of EROs and present-day ellipticals has been used as a fundamental test of hierarchical galaxy formation models (e.g. Zepf 1997; Barger et al. 1999). Daddi et al. (2000b) use the largest ERO sample currently available to show that the observed numbers of EROs are consistent with simple luminosity evolution models where most elliptical galaxies formed at high redshift. They find that current hierarchical models predict fewer EROs than are observed. It is clear that some fraction of massive galaxies did form at high redshifts and also that many (and plausibly all) of these galaxies are likely to undergo AGN activity at intermediate () redshifts. It is likely that the high redshift starburst which formed the bulk of the stars in these objects was accompanied by an AGN phase during which the massive black hole was formed (Fabian 1999; Silk & Rees 1998). At these high redshifts, radio galaxies appear to have distorted (rest-frame) optical structures (e.g. van Breugel et al. 1998), presumably due to a combination of merging sub-clumps and dust obscuration. Also, the high incidence of SCUBA sub-mm detection of these radio galaxies (Archibald et al. 2000) shows they possess large dust masses and probably have high star-formation rates. The interesting implication from this section is that many massive galaxies then undergo a second bout of AGN activity at . This activity is not accompanied by a significant amount of star-formation, as revealed by the extremely red colours of the galaxies and, we suspect, their lack of sub-mm emission.
8 Conclusions
-
•
We have shown that the optical to near-infrared SEDs of optically faint 7CRS radio sources are well fit by old or dusty galaxies in the redshift range .
-
•
Two galaxies show narrow emission lines in their near-IR spectra which if identified as H give redshifts of compatible with the SED fitting. The fluxes of these lines and the lack of lines in other galaxies are as expected from the correlation between narrow line and radio luminosities for radio sources.
-
•
The reason most of these objects did not have redshifts from optical spectroscopy is that they fall within the redshift range where there are no bright lines in the optical wavelength region.
-
•
Independent evidence suggests that the red colours of these galaxies are not caused by dust-reddening, so they are most likely very old elliptical galaxies which formed at very early epochs. These objects account for of the powerful radio source population at these redshifts. It is possible that the other radio sources are blue due to non-stellar emission and have underlying evolved host galaxies, in which case the space density of radio galaxies with old stellar populations is a factor of 4 greater than determined here.
-
•
We find that of near-IR selected EROs are expected to be radio-loud AGN with radio luminosities . Depending upon the duration of radio activity it is possible that a large fraction (%) of near-IR selected EROs go through such a period of radio activity at some point in their intermediate-redshift () lifetimes.
-
•
We have discovered a radio-quiet extremely red galaxy () ERO J081539+2446.8 in the field of 5C7.47 with an emission line in its optical spectrum. This object is best explained as a radio-quiet analogue of the 7CRS EROs at (see appendix).
-
•
A consistent picture emerges that some of the most massive galaxies formed in violent starbursts with associated AGN activity at high redshift () and then underwent a second bout of AGN activity at intermediate redshifts () but with only a small amount of further star-formation.
Acknowledgements
We would like to thank Mark Lacy, Steve Eales, Gary Hill and Julia Riley for important contributions to the 7C Redshift Survey. Thanks to Andrew Bunker, Dan Stern, Hy Spinrad, Adam Stanford, Arjun Dey and Chuck Steidel for obtaining the Keck data. Thanks to Steve Croft for obtaining the -band image of 5C6.62, Mark Lacy for obtaining the NOT data, and Matt Jarvis for help with some of the near-IR spectroscopy. We acknowledge interesting discussions with Lexi Moustakas and thank the referee Jim Dunlop for a useful referees report. We thank the staff at the WHT, INT and UKIRT for technical support. The William Herschel Telescope and the Isaac Newton Telescope are operated on the island of La Palma by the Isaac Newton Group in the Spanish Observatorio del Roque de los Muchachos of the Instituto de Astrofisica de Canarias. The United Kingdom Infrared Telescope is operated by the Joint Astronomy Centre on behalf of the U.K. Particle Physics and Astronomy Research Council. We acknowledge the UKIRT Service Programme for some of the near-infrared imaging. Some of the data presented herein were obtained at the W. M. Keck Observatory, which is operated as a scientific partnership among the California Institute of Technology, the University of California and the National Aeronautics and Space Administration. The Observatory was made possible by the generous financial support of the W. M. Keck Foundation. The VLA is a facility of the National Radio Astronomy Observatory (NRAO), which is operated by Associated Universities, Inc. under a cooperative agreement with the National Science Foundation. CJW thanks PPARC for support.
References
- [1] Archibald E.N., Dunlop J.S., Hughes D.H., Rawlings S., Eales S.A., Ivison R.J., 2000, MNRAS, in press, astro-ph/0002083
- [2] Barger A.J., Cowie L.L., Trentham N., Fulton E., Hu E.M., Songaila A., Hall D., 1999, AJ, 117, 102
- [3] Becker R.H., White R.L., Helfand D.J., 1995, ApJ, 450, 559
- [4] Best P.N., Longair M.S., Röttgering H.J.A., 1997, MNRAS, 292, 758
- [5] Best P.N., Longair M.S., Röttgering H.J.A., 1998, MNRAS, 295, 549
- [6] Blundell K.M., Rawlings S., 1999, Nature, 339, 330
- [7] Blundell K.M., Rawlings S., Willott C.J., 1999, AJ, 117, 677
- [8] Bruzual G.A., Magris G.C., 1997, in The Ultraviolet Universe at Low and High Redshift, AIP vol. 408 (AIP:Woodbury), 291
- [9] Calzetti D., 1997, AJ, 113, 162
- [10] Chambers K.C., Charlot S., 1990, ApJ, 348L, 1
- [11] Chambers K.C., McCarthy P.J., 1990, 354L, 9
- [12] Chambers K.C., Miley G., van Breugel W., 1987, Nature, 329, 609
- [13] Charlot S., Fall S.M., 1993, ApJ, 415, 580
- [14] Cimatti A., Dey A., van Breugel W., Hurt T., Antonucci R., 1997, ApJ, 476, 677
- [15] Cimatti A., Daddi E., di Serego Alighieri S., Pozzetti L., Mannucci F., Renzini A., Oliva E., Zamorani G., Andreani P., Röttgering H.J.A., 1999, A&A, 352L, 45
- [16] Cimatti A., Villani D., Pozzetti L., di Serego Alighieri S., 2000, MNRAS, 318, 453
- [17] Comastri A., Setti G., Zamorani G., Hasinger G., 1995, A&A, 296, 1
- [18] Crawford C.S., Fabian A.C., Gandhi P., Wilman R.J., Johnstone R.M., 2000, MNRAS, submitted, astro-ph/0005242
- [19] Daddi E., Cimatti A., Pozzetti L., Hoekstra H., Röttgering H.J.A., Renzini A., Zamorani G., Mannucci F., 2000a, A&A, 361, 535
- [20] Daddi E., Cimatti A., Renzini A., 2000b, A&A, in press, astro-ph/0010093
- [21] Dey A., van Breugel W., Vacca W., Antonucci R., 1997, ApJ, 490, 698
- [22] Dey A., Graham J.R., Ivison R.J., Smail I., Wright G.S., Liu M.C., 1999, ApJ, 519, 610
- [23] di Serego Alighieri S., Fosbury R.A.E., Tadhunter C.N., Quinn P.J., 1989, Nature, 341, 307
- [24] Dunlop J.S., 1999, in The Most Distant Radio Galaxies, ed. P.N. Best, H.J.A. Röttgering, M.D. Lehnert, (KNAW Colloq.; Dordrecht: Kluwer), 14
- [25] Dunlop J.S., Peacock J.A., 1990, MNRAS, 247, 19
- [26] Dunlop J.S., Peacock J.A., 1993, MNRAS, 263, 936
- [27] Dunlop J.S., Hughes D.H., Rawlings S., Eales S.A., Ward M.J., 1994, Nature, 370, 347
- [28] Dunlop J.S., Peacock J.A., Spinrad H., Dey A., Jimenez R., Stern D., Windhorst R., 1996, Nature, 381, 581
- [29] Eales S.A., 1992, ApJ, 397, 49
- [30] Eales S.A., Rawlings S., 1993, 411, 67
- [31] Eales S.A., Rawlings S., Dickinson M., Spinrad H., Hill G.J., Lacy M., 1993, ApJ, 409, 578
- [32] Eales S.A., Rawlings S., Law-Green J.D.B., Cotter G., Lacy M., 1997, MNRAS, 291, 593
- [33] Efstathiou G., Rees M.J., 1988, MNRAS, 230P, 5
- [34] Elston R., Rieke M.J., Rieke G.H., 1988, ApJ, 331, L77
- [35] Elston R., Rieke G.H., Rieke M.J., 1989, ApJ, 341, 80
- [36] Fabian A.C., 1999, MNRAS, 308L, 39
- [37] Francis P.J., Hewett P.C., Foltz C.B., Chaffee F.H., Weymann R.J., Morris S.L., 1991, ApJ, 373, 465
- [38] Gardner J.P., Sharples R.M., Frenk C.S., Carrasco B.E., 1997, ApJ, 480, L99
- [39] Genzel R., Lutz D., Tacconi L., 1998, Nature, 395, 859
- [40] Hu E.M., Ridgway S.E., 1994, AJ, 107, 1303
- [41] Ivison R.J., Smail I., Barger A., Kneib J.-P., Blain A.W., Owen F., Kerr T., Cowie L., 2000, MNRAS, 315, 209
- [42] Kennicutt R.C., 1992, ApJ, 388, 310
- [43] Lacy M., Bunker A.J., Ridgway S.E., 2000, AJ, 120, 68
- [44] Lacy M., Rawlings S., Eales S.A., Dunlop J.S., 1995, MNRAS, 273, 821
- [45] Lacy M., Ridgway S.E., Wold M., Lilje P.B., Rawlings S., 1999a, MNRAS, 307, 420
- [46] Lacy M., Rawlings S., Hill G.J., Bunker A.J., Ridgway S.E., Stern D., 1999b, MNRAS, 308, 1096
- [47] Laing R.A., Riley J.M., Longair M.S., 1983, MNRAS, 204, 151
- [48] Lilly S.J., Longair M.S., 1984, MNRAS, 211, 833
- [49] Liu M.C., Dey A., Graham J.R., Bundy K.A., Steidel C.C., Adelberger K.L., Dickinson M.E., 2000, AJ, 119, 2556
- [50] McCarthy P.J., van Breugel W., Spinrad H., Djorgovski S., 1987, ApJ, 321, L29
- [51] Moriondo G., Cimatti A., Daddi E., 2000, A&A, in press, astro-ph/0010335
- [52] Mushotzky R.F., Cowie L.L., Barger A., Arnaud K.A., 2000, Nature, 404, 459
- [53] Nolan L.A., Dunlop J.S., Jimenez R., 2000, MNRAS, in press, astro-ph/0004325
- [54] Owen F.N., Eilek J.A., Kassim N.E., 2000, ApJ, in press, astro-ph/0006150
- [55] Peacock J.A., Jimenez R., Dunlop J.S., Waddington I., Spinrad H., Stern D., Dey A., Windhorst R., 1998, MNRAS, 296, 1089
- [56] Pearson T.J., Kus A.J., 1978, MNRAS, 182, 273
- [57] Rawlings S., Saunders R., 1991, Nature, 349, 138
- [58] Rawlings S., Eales S.A., Lacy M., 2000, MNRAS, in press, astro-ph/0010445
- [59] Schoenmakers A.P., de Bruyn A.G., Röttgering H.J.A., van der Laan H., Kaiser C.R., 2000, MNRAS, 315, 371
- [60] Silk J., Rees M.J., 1998, A&A, 331L, 1
- [61] Simpson C., Rawlings S., Lacy M., 1999, MNRAS, 306, 828
- [62] Smail I., Ivison R.J., Kneib J.-P., Cowie L.L., Blain A.W., Barger A.J., Owen F.N., Morrison G., 1999, MNRAS, 308, 1061
- [63] Soifer B.T., Matthews K., Neugebauer G., Armus L., Cohen J.G., Persson S.E., Smail I., 1999, AJ, 118, 2065
- [64] Spinrad H., Dey A., Stern D., Dunlop J., Peacock J., Jimenez R., Windhorst R., 1997, ApJ, 484, 58
- [65] Stern D., Bunker A., Spinrad H., Dey A., 2000, ApJ, 537, 73
- [66] Stiavelli M., Treu T., 2000, To appear in the proceedings of the conference “Galaxy Disks and Disk Galaxies”, ASP Conf. series, eds. Funes and Corsini, astro-ph/0010100
- [67] Stiavelli M., Treu T., Carollo C.M., Rosati P., Viezzer R., Casertano S., Dickinson M., Ferguson H., Fruchter A., Madau P., Martin C., Teplitz H., 1999, A&A, 343, L25
- [68] Stockton A., Kellogg M., Ridgway S.E., 1995, ApJ, 443L, 69
- [69] Storrie-Lombardi L.J., McMahon R.G., Irwin M.J., 1996, MNRAS, 283, 79
- [70] Tadhunter C.N., Scarrott S.M., Draper P., Rolph C., 1992, MNRAS, 256, 53
- [71] Thompson D., Beckwith S.V.W., Fockenbrock R., Fried J., Hippelein H., Huang J.-S., von Kuhlmann B., Leinert C., Meisenheimer K., Phleps S., Röser H.-J., Thommes E., Wolf C., 1999, ApJ, 523, 100
- [72] van Breugel W.J.M., Stanford A.J., Spinrad H., Stern D., Graham J.R, 1998, ApJ, 502, 614
- [73] Vogt N.P., Forbes D.A., Phillips A.C., Gronwall C., Faber S.M., Illingworth G.D., Koo D.C., 1996, ApJ, 465, L15
- [74] West M.J., 1991, ApJ, 379, 19
- [75] Willott C.J., Rawlings S., Blundell K.M., Lacy M., 1998, MNRAS, 300, 625
- [76] Willott C.J., Rawlings S., Blundell K.M., Lacy M., 1999, MNRAS, 309, 1017
- [77] Willott C.J., Rawlings S., Blundell K.M., Lacy M., 2000a, MNRAS, 316, 449
- [78] Willott C.J., Rawlings S., Blundell K.M., Lacy M., Eales S.A., 2000b, MNRAS, in press, astro-ph/0010419
- [79] Wilman R.J., Fabian A.C., 1999, MNRAS, 309, 862
- [80] Worthey G., 1994, ApJS, 95, 107
- [81] Yamada T., Tanaka I., Aragon-Salamanca A., Kodama T., Ohta K., Arimoto N., 1997, ApJ, 487, L125
- [82] Yi S., Brown T., Heap S., Hubeny I., Landsman W., Lanz T., Sweigart A., 2000, ApJ, 533, 670
- [83] Zepf S.E., 1997, Nature, 390, 377
Appendix A ERO J081539+2446.8 – A radio-quiet ERO at

Within 20 arcsec of the radio galaxy 5C7.47 there are two very red () galaxies. An excess of EROs in the fields of AGN has been found in other work (e.g. Yamada et al. 1997; Liu et al. 2000; Cimatti et al. 2000), although given the sky area covered in total by our multi-wavelength imaging and the observed surface density of EROs in near-IR surveys (Daddi et al. 2000a), we would typically expect to find one serendipitous ERO in our data. These two objects are the second and third brightest in the -band image shown in Fig. 3 and are located 12.2 arsec south-east and 16.5 arcsec north-west of the radio source identification. The object to the north-west has 3 arcsec aperture magnitudes of and and is not discussed further. The object to the south-east [which we designate as ERO J081539+2446.8; co-ordinates 08 15 39.01 +24 46 51.2 (J2000.0)] is slightly redder with 3 arcsec aperture magnitudes of and . This object is detected in the and images but with insufficient SNR for reliable magnitudes to be determined. The object is clearly resolved at -band with a FWHM of 1.3 arcsec in 1.0 arcsec seeing.
On February 10 2000 we obtained an optical spectrum of 60 minutes integration of 5C7.47 and this red companion galaxy using the ISIS long-slit spectrograph on the WHT (for observation and data reduction details see Willott et al., in prep) . Although no redshift could be determined for 5C7.47, a single emission feature was detected at the expected position on the array of ERO J081539+2446.8. This emission line is located at a wavelength of Å and has a FWHM of 18 Å. The instrumental resolution is 9 Å so this line is clearly resolved and has a deconvolved velocity width of 570 km s-1. The measured flux in the line is W m-2. The continuum level at the wavelength of the emission line is so weak that no upper limit of the observed equivalent width can be given. A lower limit to the observed equivalent width of the emission line is 80 Å. Rather fortuitously, the emission line falls within a region of low sky background in between the strong OH airglow lines which dominate the -band background spectrum and therefore the SNR of the line is high (SNR=16). All the other features in the spectrum of Fig. 10 are sky subtraction residuals.
Determining redshifts from single emission lines is always an uncertain process (e.g. Stern et al. 2000) and any other information available needs to be taken into account. The very red colour of this object combined with the faint -magnitude suggest for reasons discussed elsewhere in this paper. If this line is Ly then the derived redshift would be . There is patchy continuum in the optical spectrum of ERO J081539+2446.8 down to a wavelength of at least 7000 Å. Given that there will be negligible flux below the Lyman limit, this only puts a firm upper limit on the redshift of , so does not rule out the Ly hypothesis. However, both the line flux and -magnitude seem too bright for such a distant galaxy unless there is major non-stellar contamination. In addition the line does not show an asymmetric profile with blueward absorption as is typical of Ly at very high redshifts (Stern et al. 2000). Another factor arguing against is the very red optical–near-IR SED which would require a large amount of reddening for a high redshift star-forming galaxy and consequently an even higher intrinsic emission line flux than is observed.
Hence we think it unlikely that the emission line is Ly. The two remaining possibilities for single emission lines in an optical spectrum are MgII 2799 and [OII] 3727. Considering MgII initially, the redshift would be 1.93. In this case we would expect to also detect Ly emission in the noisy blue end of the spectrum at 3564 Å, which is not observed to a limit of W m-2. This leaves the most likely explanation that the line is in fact [OII] at a redshift of . Given the observed -magnitude of ERO J081539+2446.8, we find its luminosity is that of an unevolved galaxy at (for , ; for , the luminosity is ). This redshift is similar to those of EROs which have been discovered in near-IR surveys and have redshifts constrained by the shape of their continua in low-resolution near-IR spectroscopy (e.g. Cimatti et al. 1999) and also those found in front of the quasar QSO 1213-0017 (Liu et al. 2000).
The [OII] luminosity for the measured flux at is W (). If this [OII] emission is from a starburst with extinction similar to local spirals, this implies a star-formation rate of (Kennicutt 1992), but for a more heavily obscured starburst the actual star-formation rate would be much higher than this. The extremely red starburst galaxy HR 10 has a star-formation rate implied by its sub-mm detection a factor of times greater than inferred from its [OII] luminosity (Dey et al. 1999). However, it is possible that the observed emission line is actually powered by an AGN and not star-formation. We have fit the emission line with the [OII] 3726/3729 doublet to get a more accurate measure of the velocity of the emission line gas. De-blending the observed line with two components of equal flux and width, we find the best-fit width for each line is 14 Å (510 km s-1). When deconvolved from the instrumental resolution we find a velocity width of 400 km s-1. This is significantly greater than rotational velocities in massive galaxies at (Vogt et al. 1996) and even high redshift starburst galaxies such as SMM J14011+0252 (Ivison et al. 2000) and is closer to the widths of lines in AGN.
ERO J081539+2446.8 is not detected in our 8.4 GHz map of 5C7.47 (Blundell et al. in prep.) or in the FIRST survey at 1.4 GHz (Becker, White & Helfand 1995). The limiting flux-density for the ERO at 1.4 GHz is 0.5 mJy, giving a luminosity limit of (assuming a spectral index of 0.7). Extrapolating to 151 MHz with this spectral index gives a limit of . This upper limit is just at the dividing luminosity between a radio-loud AGN and extreme starbursts. Given the large velocity width of the [OII] line we suspect that this object is a narrow-line AGN, i.e. a quasar with an obscured nuclear region, and may be similar to the 7CRS EROs in this paper, but radio-quiet. We are aware of only one other ERO with AGN emission lines - object R7 of Liu et al. (2000) which is at . There is no emission in the spectrum of 5C7.47 at 8202 Å so it seems that the radio source is not at the same redshift as ERO J081539+2446.8.