The Distribution of Dark Matter in Galaxies:
Constant–Density Dark Halos Envelop the Stellar Disks
Abstract
In this paper we review the main and the most recent evidence for the presence of a core radius in the distribution of the dark matter around spiral galaxies. Their rotation curves, coadded according to the galaxy luminosity, conform to an Universal profile which can be represented as the sum of an exponential thin disk term plus a spherical halo term with a flat density core. From dwarfs to giants, these halos feature a constant density region of size and core density related by . At the highest masses decreases exponentially, with revealing a lack of objects with disk masses and central densities , which implies a maximum mass of for halos hosting spirals. The fine structure of dark matter halos is obtained from the kinematics of a number of suitable low–luminosity disk galaxies. The inferred halo circular velocity increases linearly with radius out to the edge of the stellar disk, implying a constant dark halo density over the entire disk region. The structural properties of halos around normal spirals are similar to those around dwarf and low surface brightness galaxies; nevertheless they provide far more substantial evidence of the discrepancy between the mass distributions predicted in the Cold Dark Matter scenario and those actually detected around galaxies.
1 Introduction
Rotation curves (RC’s) of disk galaxies are the best probe for dark matter (DM) on galactic scale. Notwithstanding the impressive amount of knowledge gathered in the past 20 years, only very recently we start to shed light to crucial aspects of the mass distribution including the actual density profile of dark halos and its claimed universality.
On the cosmological side, high-resolution cosmological N-body simulations have shown that cold dark matter (CDM) halos achieve a specific equilibrium density profile [16 hereafter NFW, 6, 10, 14, 11]. This can be characterized by one free parameter, e.g. , the halo mass contained within the radius inside which the average over-density is 200 times the critical density of the Universe at the formation epoch. In their innermost region the dark matter profiles show some scatter around an average profile which is characterized by a power-law cusp , with [16, 14, 2].In detail, the DM density profile is:
| (1) |
where is a characteristic inner radius and the corresponding density. Let us define the halo virial radius as the radius within which the mean density is times the mean universal density at that redshift, and the associated virial mass and velocity . By defining the concentration parameter as the halo circular velocity takes the form [2]:
| (2) |
where and . As the relation between and is fully specified by the background cosmology, we assume the currently popular CDM cosmological model, with , and , in order to reduce from three to two ( and ) the independent parameters characterizing the model. According to this model, at . Let us stress that a high density model, with a concentration parameter , is definitely unable to account for the observed galaxy kinematics [13]. Until recently, due to both the limited number of suitable RC’s and to uncertainties on the exact amount of luminous matter in the innermost regions of spirals, it has been difficult to investigate the internal structure of their dark halos. However, as a result of substantial observational and theoretical progresses, we have recently derived the main features of their mass distribution for a) the Universal Rotation Curve [20] built by coadding RC’s and b) a number of suitably selected RC’s [1].
2 The URC and CDM Halos
The assumed (and well supported) framework is: a) the mass in spirals is distributed according to the Inner Baryon Dominance (IBD) regime: there is a characteristic transition radius ( is the disk scale-length and ) according which, for , the luminous matter totally accounts for the mass distribution, whereas, for , DM rapidly becomes the dominant dynamical component [26, 24, 1]. Then, although the dark halo might extend down to the galaxy center, it is only for that it gives a non-negligible contribution to the circular velocity. b) DM is distributed in a different way with respect to any of the various baryonic components [20, 7], and c) HI contribution to the circular velocity at , is negligible [e.g. 21].
2.1 Halo Density Profiles

Reference [20] have derived from velocity measurements of RC’s, the synthetic rotation velocities of spirals , sorted by luminosity (Fig. 1, with the –band luminosity and . Remarkably, individual RC’s have a very small variance with respect to the corresponding synthetic curves [20, 21, 22]: spirals sweep a very narrow locus in the RC-profile/amplitude/luminosity space. On the other hand, the galaxy kinematical properties significantly change with luminosity [e.g. 20], so it is natural to relate the mass distribution with this quantity. The whole set of synthetic RC’s has been reproduced by means of the Universal Rotation Curve (URC) which includes: a) an exponential thin disk term [9]:
| (3) |
and b) a spherical halo term:
| (4) |
with , , and the halo core radius in units of . At high luminosities, the contribution from a bulge component has also been considered.
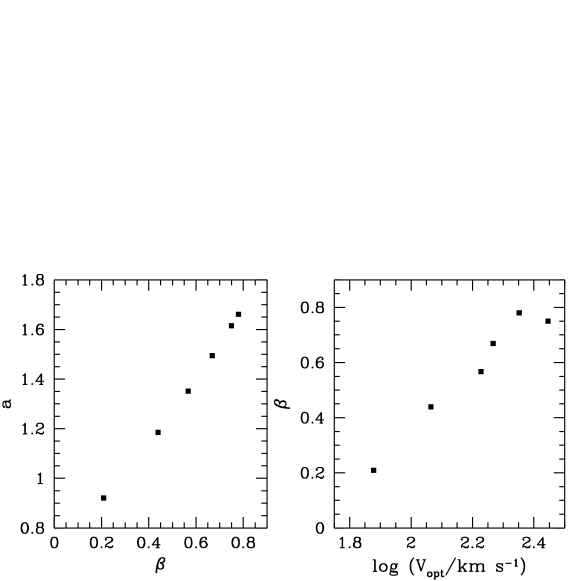
Let us stress that the halo velocity functional form (4) does not bias the mass model: it can equally account for maximum–disk, solid–body, no–halo, all–halo, CDM and core–less halo mass models. In practice, the synthetic curves select the actual model out of the family of models , where and are free parameters. Adopting and [20] or, equivalently, the corresponding and plotted in Fig. 2, the URC reproduces the synthetic curves within their r.m.s. (see Fig. 1). More in detail, at any luminosity and radius, and the fitting uncertainties on and are about 20% [20].
To cope with this observational evidence and conveniently frame the halo density properties, we adopted the empirical profile proposed by Burkert [3]:
| (5) |
where and are free parameters which represent the central DM density and the scale radius. Within spherical symmetry, the mass distribution is given by:
| (6) |
with , the dark mass within the core, given by . The halo contribution to the circular velocity is then:
| (7) |
Although the dark matter core parameters , and are in principle independent, the observations reveal a clear correlation [3]:
| (8) |
which, together with the above relationship, indicates that dark halos represent a 1–parameter family which is completely specified, e.g. by the core mass.
We then compare the dark halo velocities obtained with (3) and (4), with the Burkert velocities of (5)-(7), leaving and as free parameters, i.e. we do not impose the relationship (8). The results are shown in Fig. 3: at any luminosity, out to the outermost radii (), is indistinguishable from . More specifically, by setting , we are able to reproduce the synthetic rotation curves at the level of their r.m.s. For , i.e. beyond the region described by the URC, the two velocity profiles progressively differ.
The values of and from the URC agree with the extrapolation at high masses of the scaling law [3] established for objects with core radii ten times smaller (see Fig. 4). Let us notice that the core radii are very large: so that an ever-rising halo RC cannot be excluded by the data. Moreover, the disk-mass vs. central halo density relationship , found for dwarf galaxies [3], according to which the densest halos harbor the least massive disks, holds also for disk systems of stellar mass up to (see Fig. 4).

The above relationship shows a curvature at the highest masses/lowest densities that can be related to the existence of an upper limit in the dark halo mass 111The virial halo mass is given by with the formation redshift, the virial radius, for see e.g. [2]; the critical density is defined as: . which is evident by the sudden decline of the baryonic mass function of disk galaxies at [26], that implies a maximum halo mass of , where and [e.g. 5] are the matter and baryonic densities of the Universe in units of critical density. From the definition of , by means of eq. (6) and (8), we can write in terms of the “observable” quantity : . For , ; notice that there is a mild dependence of on and which is irrelevant for the present study. From simple manipulation of previous equation- we obtain an upper limit for the central density, , which implies a lack of objects with and , as is evident in Fig. 4. Turning the argument around, the deficit of objects with and , suggests that, at this mass scale, the total-to-baryonic density ratio nears the cosmological value .
2.2 Testing CDM
Out to two optical radii, the Burkert density profile reproduces, for the whole spiral luminosity sequence, the DM halos mass distribution. This density profile, though at very large radii coincides with the NFW profile, approaches a constant, finite density value at the center, in a way consistent with an isothermal distribution. This is in contradiction to CDM halo properties which predict [e.g. 10] that the velocity dispersion of the dark matter particles decreases towards the center to reach for . The dark halo inner regions, therefore, cannot be considered as kinematically cold structures but rather as “warm” regions with size . The halo core sizes are very large: . Then, the boundary of the core region is well beyond the region where the stars are located and, as in [7], even at the outermost observed radius there is not the slightest evidence that dark halos converge to a (or a steeper) regime.
3 Individual RC’s and CDM
To derive the halo density from an individual rotation curve is certainly complicated, however, the belief according to which RC’s lead to ambiguous halo mass modeling [e.g. 28] is incorrect. In fact this is true only for rotation curves of low spatial resolution, i.e. with measures per exponential disk length–scale , as for most of HI RC s. Since the parameters of the galaxy structure are very sensitive to the shape of the rotation curve in the region , that corresponds to the region of the RC steepest rise, then the mass model cannot be inferred if such a region is poorly sampled and/or radio beam–biased. Instead, high–quality optical RC s with tens of independent measurements in the critical region probe the halo mass distribution and resolve their structure. Since the dark component can be better traced when the disk contributes to the dynamics in a modest way, it is convenient to investigate DM–dominated objects, like dwarf and low surface brightness (LSB) galaxies. It is well known that for the latter there are claims of dark matter distributions with regions of constant density well different from the cusped density distributions of the Cold Dark Matter scenario [e.g. 8, 13, 3, 4, 11, 12, 27]. However, these results are far from certain being 1) under the (unlikely) caveat that the low spatial resolution of the RC s does not bias the derived mass model and 2) uncertain, due to the limited amount of available kinematical data [see 29]. Since most of the properties of cosmological halos are claimed universal, we concentrate on a small and particular sample of RC s, that, nevertheless, reveal the properties of the DM halos around spirals. A more useful strategy has been to investigate a number of high–quality optical rotation curves of low luminosity late–type spirals, with –band absolute magnitudes and that km s-1. Objects in this luminosity/velocity range are DM dominated [e.g. 20] but their RC’s, measured at an angular resolution of , have a spatial resolution of pc and independent measurements. For nearby galaxies: and . Moreover, we select RC’s of bulge–less systems, so that the stellar disk is the only baryonic component for .
In detail, we take from [19] the rotation curves of the ‘excellent’ subsample of galaxies, which are suitable for an accurate mass modeling. In fact, these RC’s properly trace the gravitational potential in that: 1) data extend at least to the optical radius, 2) they are smooth and symmetric, 3) they have small rms, 4) they have high spatial resolution and a homogeneous radial data coverage, i.e. about data points homogeneously distributed with radius and between the two arms. From this subsample we extract 9 rotation curves of low luminosity galaxies (; km s-1), with their –band surface luminosity being an (almost) perfect radial exponential. These two last criteria, not indispensable to perform the mass decomposition, are however required to infer the dark halo density distribution. Each RC has velocity points inside , each one being the average of independent data. The RC spatial resolution is better than , the velocity r.m.s. is about and the RC’s logarithmic derivative is generally known within about 0.05.
3.1 Halo Density Profiles
We model the mass distribution as the sum of two components: a stellar disk and a spherical dark halo. By assuming centrifugal equilibrium under the action of the gravitational potential, the observed circular velocity can be split into these two components:
| (9) |
By selection, the objects are bulge–less and the stellar component is distributed like an exponential thin disk. Light traces the mass via an assumed radially constant mass–to–light ratio. In the r.h.s of (9) we neglect the gas contribution since in normal spirals it is usually modest within the optical region [21, Fig. 4.13]: . Furthermore, high resolution HI observations show that in low luminosity spirals: for and for . Thus, in the optical region: i) and ii) . This last condition implies that by including in the r.h.s. of (9) the halo velocity profiles would result steeper and then the core radius in the halo density larger. Incidentally, this is not the case for dwarfs and LSB s: most of their kinematics is affected by the HI disk gravitational pull in such a way that neglecting it could bias the determination of the DM density. The circular velocity profile of the disk is given by (3) and the DM halo will have the form given by (4). Since we normalize (at ) the velocity model to the observed rotation speed , enters explicitly in the halo velocity model and this reduces the free parameters of the mass model to two.
It is important to remark that, out to , the proposed Constant Density Region (CDR) mass model of (4) is instead neutral with respect to all the proposed models. Indeed, by varying and , we can efficiently reproduce the maximum–disk, the solid–body, the no–halo, the all–halo, the CDM and the core-less–halo models. For instance, CDM halos with concentration parameter and are well fit by (4) with .
For each galaxy, we determine the values of the parameters and by means of a –minimization fit to the observed rotation curves:
| (10) |
A central role in discriminating among the different mass decompositions is played by the derivative of the velocity field . It has been shown [e.g. 18] that by taking into account the logarithmic gradient of the circular velocity field defined as: one can retrieve the crucial information stored in the shape of the rotation curve. Then, we set the -s as the sum of those evaluated on velocities and on logarithmic gradients: and , with given from the above equations. The parameters of the mass models are finally obtained by minimizing the quantity .

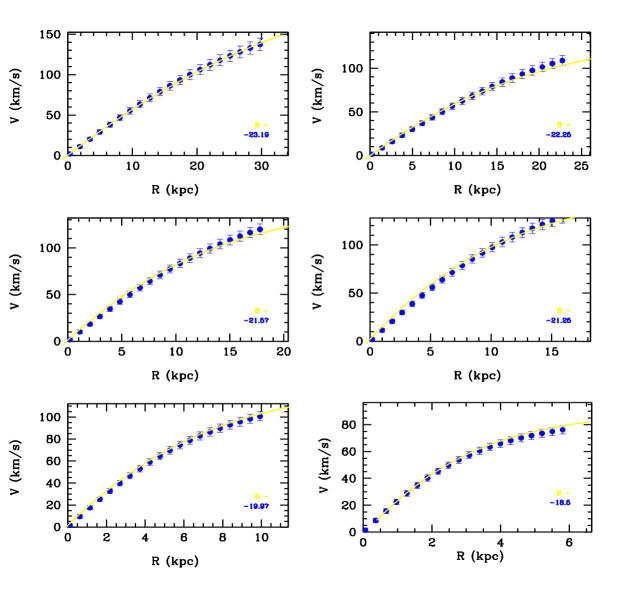
The parameters of the best–fit models are shown in Fig. 5. They are very well specified: the allowed values span a small and continuous region of the (, ) space. We get a “lowest” and a “highest” halo velocity curve by subtracting from the maximum and the minimum disk contributions obtained by substituting in (3) the parameter with and , respectively. The derived mass models are shown in Fig. 6, alongside with the separate disk and halo contributions. It is then obvious that the halo curve is steadily increasing, almost linearly, out to the last data point. The disk–contribution and the halo core radius span a range from 0.1 to 0.5 and from 0.8 to 2.5, respectively. In each object the uniqueness of the resulting halo velocity model can be realized by the fact that the maximum–disk and minimum–disk models almost coincide. Remarkably, we find that the size of the halo density core is always greater than the disk characteristic scale–length and it can extend beyond the disk edge (and the region investigated).

3.2 Testing CDM
In Fig. 7 we show the halo velocity profiles for the nine galaxies. The halo circular velocities are normalized to their values at and expressed as a function of the normalized radius . These normalizations allow a meaningful comparison between halos of different masses. It is then evident that the halo circular velocity, in every galaxy, rises almost linearly with radius, at least out to the disk edge: for .
The halo density profile has a well defined (core) radius within which the density is approximately constant. This is inconsistent with the singular halo density distribution emerging in the Cold Dark Matter (CDM) halo formation scenario. More precisely, since the CDM halos are, at small radii, likely more cuspy than the NFW profile: [e.g. 14], the steepest CDM halo velocity profile results too shallow with respect to observations. Although the mass models of (4) converge to a distribution with an inner core rather than with a central spike, it is worth, given the importance of such result, also checking in a direct way the (in)compatibility of the CDM models with galaxy kinematics. We assume the NFW two–parameters functional form for the halo density [15, 16, 17], given by (1). Though N–body simulations and semi-analytic investigations indicate that the two parameters and correlate, they are left independent to increase the chance of a good fit. For the object under study a generous halo mass upper limit is .

The fits to the data are shown in Fig. 8 and compared with the NFW models: for seven out of nine objects the latter are unacceptably worse than the CDR solutions, moreover in all objects, the CDM virial mass is too high high: and the resulting disk mass–to–light ratio too low. The inadequacy of the CDM model for our sample galaxies is even more evident if one performs the fit after removing the constraint on virial mass. In fact, good fits are obtained only for very low values of the concentration parameter () and for ridiculously large virial velocities and masses (). These results can be explained as effect of the attempt, by the minimization routine, to fit the NFW velocity profile () to data intrinsically linear in .
4 Conclusions: an Intriguing Evidence
The dark halos around spirals emerge as an one–parameter family; it is relevant that the order parameter (either the central density or the core radius) correlates with the luminous mass. However, we do not know how it is related to the global structural properties of the dark halo, like the virial radius or the virial mass. The halo RC, out to , is completely determined by parameters, i.e. the central core density and the core radius, which are not defined in present gravitational instability/ hierarchical clustering scenario. In fact the location of spiral galaxies in the parameter space of virial mass, halo central density and baryonic mass, determined by different processes on different scales , degenerates with no doubt into a single curve (see Fig. 4), we recall that: and , of difficult interpretation within the standard theory of galaxy formation.

Crucial insight has come from disk–halo density decompositions of a number of disk galaxies. These galaxies have a relevant amount of dark matter: the contribution of the luminous matter to the dynamics is small and it can be easily taken into account. Moreover, the high spatial resolution of the available rotation curves allows us to derive the separate dark and luminous density profiles. We find that dark matter halos have a constant central density region whose size exceeds the stellar disk length–scale . As result, the halo profiles disagree with the cuspy density distributions typical of CDM halos which, therefore, fail to account for the actual DM velocity data.
Pointing out that a review on the various efforts aimed to cope with the core radii evidence will be published elsewhere, we conclude by stressing that, for any theory of galaxy formation, time is come to seriously consider that stellar disks (and perhaps also stellar spheroids) lay down in dark halos of constant density.
References
- (1) A. Borriello, P. Salucci: MNRAS in press astro-ph/ (2000)
- (2) J.S. Bullock, T.S. Kolatt, Y. Sigad, R.S. Somerville, A.V. Kravtsov, A.A. Klypin, J.R. Primack, A. Dekel: MNRAS in press astro-ph/9908159 (2000)
- (3) A. Burkert: ApJ, 447, L25 (1995)
- (4) A. Burkert, J. Silk: ApJ, 488, L55 (1997)
- (5) S. Burles, D.Tytler: Space Sci. Rev., 84, 65 (1998)
- (6) S. Cole, C. Lacey: MNRAS, 281, 716 (1997)
- (7) E. Corbelli, P. Salucci: MNRAS, 311, 411C (2000)
- (8) R. Flores, J.R. Primack: ApJ, 427, L1 (1994)
- (9) K.C. Freeman: ApJ, 160, 811F (1970)
- (10) T. Fukushige, J. Makino: ApJ, 477, L9 (1997)
- (11) A.V. Kravtsov, A.A. Klypin, J.S. Bullock, J.R. Primack: ApJ, 502, 48 (1998)
- (12) S.S. McGaugh, W.J.G. de Block: ApJ, 499, 41 (1998)
- (13) B. Moore: Nature, 370, 629 (1994)
- (14) B. Moore, F. Governato, T. Quinn, J. Stadel, G. Lake: ApJ, 499, L5 (1998)
- (15) J.F. Navarro, C.S. Frenk, S.D.M. White: MNRAS, 275, 56 (1995)
- (16) J.F. Navarro, C.S. Frenk, S.D.M. White: ApJ, 462, 563 (1996)
- (17) J.F. Navarro, C.S. Frenk, S.D.M. White: ApJ, 490, 493 (1997)
- (18) M. Persic, P. Salucci: MNRAS, 245, 577 (1990b)
- (19) M. Persic, P. Salucci: ApJS, 99, 501.. (1995)
- (20) M. Persic, P. Salucci, F. Stel: MNRAS, 281, 27P (1996)
- (21) M.-H. Rhee: PhD thesis, Groningen University (1996)
- (22) D. F. Roscoe: A&A , 343, 788 ((1999)
- (23) P. Salucci: MNRAS in press astro-ph/0007389 (2000)
- (24) P. Salucci, C. Ratnam, P. Monaco, L. Danese: MNRAS, 317, 488S (2000)
- (25) P. Salucci, A. Burkert: ApJ, 537L, 9S (2000)
- (26) P. Salucci, M. Persic: MNRAS, 309, 923 (1999)
- (27) J. Stil: Ph.D. Thesis, Leiden University (1999)
- (28) T.S. van Albada, J.S. Bahcall, K. Begeman, R. Sancisi: ApJ, 295, 305 (1985)
- (29) F.C. van den Bosch, B.E. Robertson, J. Dalcanton, W.J.G. de Blok: AJ , 119, 1579V (2000)