Optical spectral variability of PG QSOs
Abstract
In previous studies we have shown that the optical variability of quasars increases, on average, with redshift. We explained this dependance in terms of a hardening of the spectrum during bright phases, coupled with the increase of the rest-frame frequency for increasing redshift. We re-analize now these correlations on the basis of new light curves of PG quasars, recently published by the Wise Observatory group.
1 Introduction
Although variability plays a key role in constraining the models of the central engine of QSOs, little is known about the physical origin of luminosity variations. The most diverse variability mechanisms have been proposed in the past, including supernovae explosions (Aretxaga et al. 1997), instabilities in the accretion disk (Kawaguchi et al. 1998), and gravitational lensing due to intervening matter (Hawkins 1993). So far, most of the information about the characteristics of variability derives from the statistical analysis of single band light curves of magnitude limited QSO samples. The correlation of variability with either intrinsic luminosity () or redshift () is affected by the strong correlation between luminosity and redshift (), present in these samples. The results of these analyses also depend on the specific variability index adopted, as shown by Giallongo et al. (1991), who found a positive v-z correlation through a variability index based on the rest-frame structure function, later confirmed by Cristiani et al. (1996). The increase of variability with the rest-frame observing frequency found by Di Clemente et al. (1996), supports the suggestion by Giallongo et al. (1991) that QSOs at high redshift appear more variable, on average, since they are observed in a higher rest frame frequency. The dependence of variability on frequency is associated with the hardening of the spectral energy distribution (SED) during the bright phases (Cutri et al. 1985, Kinney et al. 1991, Edelson et al. 1990). Trèvese et al. (1999) have shown that a hardening of the SED in the bright phase occurs, on average, in the statistical, magnitude limited, sample of AGNs of the SA 57 (Trèvese et al. 1989, 1994, Bershady et al. 1998). They also found that the slope a and its variations associated with the luminosity changes, are consistent on average with temperature changes of a black body.
1.1 Data and analysis
We present preliminary results of a new analysis of the spectral variability of QSOs in the optical band. It is based on a data set made available by Giveon et al. 1999, consisting of the light curves of a sample of 42 nearby and bright QSOs (, mag) belonging to the Palomar-Green (PG) sample, which were monitored for 7 years, with a typical sampling interval of 39 days, in the Johnson Cousins B and R bands, with the 1 m telescope of the Wise Observatory. Here the quantities adopted for the analysis are defined. The results are discussed in Section 2, together with the relevant figures.
1.2 Variability index
We define the structure function as (see Di Clemente et al. 1996) , where is either the or the magnitude, is the rest-frame time, is the time lag between the observations, is the relevant r.m.s. noise and the angular brackets indicate the average taken over all the pairs of observations separated by a time interval . The value of is the result of a trade-off between time resolution and statistical uncertainty. In the following we define, for each QSO, two variability indexes and equal to the relevant structure function in the and bands, computed for yr. The average values of and over the ensemble of 42 QSOs, versus the relevant average rest-frame frequency, are reported in Figure 1, which is adapted from Di Clemente et al. (1996).
1.3 Instantaneous spectral slope
For each QSO we compute the instantaneous spectral slope , regarding as synchronous the observations within a time lag of 9 hours. Emission line corrections are not considered in the present preliminary analysis.
1.4 Spectral variability parameter
Considering all possible pairs of observations, separated by a time interval , we define a spectral variability indicator: where is the absolute luminosity in the blue band. In the present analysis we consider, for each object, the spectral variability parameter defined as the average of all the values for days.
2 Results
2.1 Variability-frequency correlation ()
Fig. 1 shows the variability indexes corresponding to various frequencies. The stars represent the indexes and computed in the present analysis. The other points, taken from Di Clemente et al. 1996, derive from different statistical QSO samples as indicated. The new points are consistent with the general trend and confirm the value of the slope which accounts for the correlation found by Giallongo et al. (1991). A correlation is not detectable for the whole sample (Giveon et al. 1999), due to the small redshift range (). If we restrict to an absolute magnitude bin , to reduce the combined effect of the (positive) and (negative) correlations, which attenuates the apparent the correlation, we find a partial correlation coefficient , marginally significant [], despite the small number (19) of QSOs in the selected magnitude bin. Therefore, we can conclude that the intrinsic correlation is present, and the trend shown in Fig. 1 confirms its interpretation in terms of an increase of variability for increasing rest-frame frequency.

2.2 Spectral slope - luminosity () correlation
In Fig. 2 the instantaneous slope of each QSO is plotted as a function of the relevant blue luminosity . The regression lines vs. are also reported for each QSO. Two features appear in the figure: (i) Intra-QSO correlation (), i.e. a trend (with a few exceptions) of increasing for increasing appears, indicating that QSO SEDs are harder in the bright phase (and vice versa); (ii) Inter-QSO correlation (), i.e. also the average of each QSO is positively correlated with its average luminosity.

These two effects suggest that both the change of during luminosity variations and the average increase of from faint to bright QSOs have the same physical origin: the increase of the temperature of the emitting gas. As an example the versus lines computed for three emitting black bodies of different areas are reported in Fig. 2. The temperature increases along each line from bottom left to top right.
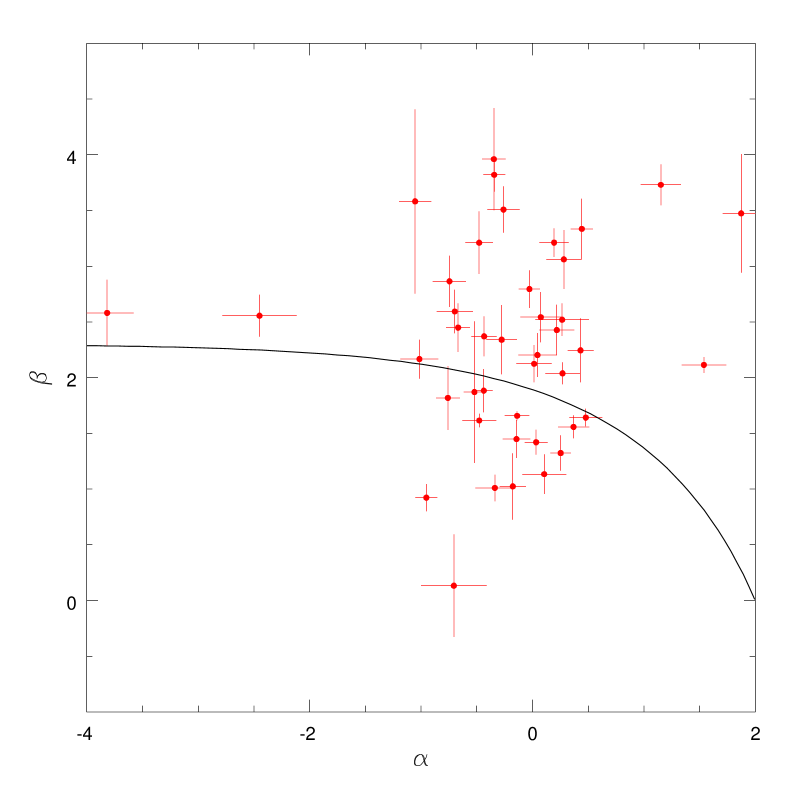
2.3 Spectral variability versus spectral slope
Fig. 3 shows the spectral variability parameter of each QSO, versus its average spectral slope . The continuous curve represents versus for a family of black bodies of different temperatures, increasing from left to right. This is not a fit to the data points, since there are no free parameters in the curve. Comparison with the data suggests that the spectral slope and the slope variations are roughly consistent with a black body of tempeature K, subject to small temperature changes responsible of both the luminosity and spectral slope changes.
3 Conclusions
The analysis of the spectral variability of the present statistical subsample of PG QSOs shows that:
-
•
the amplitude of variability increases with the rest-frame frequency;
-
•
a (positive) correlation appears in the present sample, despite the (negative) and the (positive) correlations;
-
•
the increase of variability with frequency is consistent with the trend previously found by Di Clemente et al. (1996) on the basis of different QSO samples and confirms the explanation of the correlation suggested by Giallongo et al. (1991);
-
•
the spectral slope increases on average in the bright phases (intra-QSO correlation);
-
•
the spectral slope is steeper, on average, for fainter QSOs (inter-QSO correlation);
-
•
the two latter points suggest that the gas temperature is responsible for both the effects;
-
•
temperature variations of a black body with an average temperature of the order of K are consistent for the intra-QSO correlation.
-
•
different average black body temperatures may account for the inter-QSO correlation.
Acknowledgements.
We are grateful to the Wise Observatory Group for providing public access to their data.References
- [1] Aretxaga, I., Cid Fernandes, R., Terlevich, R.J. 1997, MNRAS 286, 271
- [2] Bershady, M. A., Trèvese, D., Kron, R.G. 1997, ApJ 496, 103
- [3] Cristiani, S., Trentini, S., La Franca, F., Aretxaga, I., Andreani, P., Vio, R., Gemmo, A. 1996, A&A 306, 395
- [4] Cristiani, S., Vio, R., Andreani, P. 1990, AJ 100, 56
- [5] Cutri, R.M., Wisniewski, W.Z., Rieke, G.H., Lebofsky, H.J. 1985, ApJ 296, 423
- [6] Di Clemente, A., Giallongo, E., Natali, G., Trèvese, D., Vagnetti. F. 1996, ApJ 463, 466
- [7] Edelson, R.A., Krolik, J. H., Pike, G. F. 1990, ApJ 359, 86
- [8] Giallongo, E., Trèvese, D., Vagnetti, F. 1991, ApJ 377, 345
- [9] Giveon, U., Maoz, D., Kaspi, S., Netzer, H., Smith, P.S. 1999, MNRAS 306, 637
- [10] Kawaguchi, T., Mineshige, S., Umemura, M., Turner, E.L. 1998, ApJ 504, 671
- [11] Kinney, A. L., Bohlin, R.C., Blades, J.C., York, D.G. 1991, ApJSupp 75, 645
- [12] Hawkins, M. R. S. 1993, nature 366, 242
- [13] Trèvese, D., Kron, R.G., Majewski, S.R., Bershady, M.A., Koo, D.C. 1994 ApJ 433, 494
- [14] Trèvese D., Pittella, G., Kron, R.G., Koo, D.C., Bershady, M.A. 1989, AJ 98, 108
- [15] Trèvese D., Bunone, A., Kron R. G. 1999, Mem SAIt 70, 37