The Red-Sequence Cluster Survey:The Value of and
Abstract
The Red-Sequence Cluster Survey (RCS) is a 100 deg2 optical survey for high-redshift galaxy clusters. One of the goals of the survey is a measurement of and via the evolution of the mass spectrum of galaxy clusters. Herein we briefly describe how this will initially be done, and also demonstrate the eventual power of the RCS for this type of measurement by a qualitative analysis of the first 1/10th of the survey data.
Department of Astronomy, University of Toronto, 60 St. George Street, Toronto, ON, Canada, M5S 3H8
1. The RCS and Cosmology
The RCS will provide a large sample of optically selected galaxy clusters over the redshift range . Clusters are selected using a technique based on locating the red-sequence of early-type galaxies in the cluster core (Gladders & Yee 2000a). Simulations show that the RCS will be complete for clusters of line-of-sight velocity dispersions of 750 km sec-1 to (Gladders & Yee 2000b), regardless of the details of the cluster galaxy properties.
The large and well-understood cluster sample from the RCS will be well suited to measuring the evolution of the cluster mass spectrum, , and hence and . Individual cluster redshifts can be estimated photometrically from the survey data to an accuracy of (Gladders & Yee 2000a). Masses can also be estimated photometrically, using the richness estimator, which has been shown to be well correlated with velocity dispersion (Yee & López-Cruz 1999) and hence mass. The - mass correlation is currently calibrated to ; once calibration is complete over the entire RCS redshift range the whole survey should yield estimates of and accurate to - more accurate and independent of current results based on relatively small X-ray selected samples (e.g., see Henry 2000 and references therein).
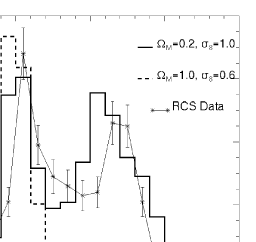
As a qualitative illustration of the cosmology indicated by the RCS, we have used the RCS selection functions (Gladders & Yee 2000a,b) to integrate out the mass dependence in model predictions of and compared the RCS measure of to predictions from two typical cosmologies. Predictions of are made from the standard Press-Schechter formalism, and multiplied by the RCS selection functions (expressed in mass and redshift, assuming a cluster with a typical luminosity function shape, galaxy mixture and cluster shape, concentration and size). These selection functions tail off to zero probability at a lower mass limit which becomes progressively more massive at higher redshift, limiting the contribution to from lower-mass clusters and groups. The result of these computations, as well as the actual counts from a portion of the RCS, are shown in Figure 1. Clearly, and not surprisingly, the low and high model is preferred. Regardless of the precise details of the shapes of the modeled curves (which are dependent on knowing the selection functions), the simple abundance of candidates at high redshift in the real data is a strong argument for a low universe.
References
Gladders, M.D., & Yee, H.K.C. 2000a, AJ, 120, 2148
Gladders, M.D., & Yee, H.K.C. 2000b, to be submitted to AJ
Henry, J.P. 2000, ApJ, 534, 565
Yee, H.K.C, & López-Cruz, O. 1999, AJ, 117, 1985