An Ultraviolet Study of the Short-Period Binary OO Aquilae
Abstract
OO Aql is a rare W UMa-type eclipsing binary in which the two solar-type stars may have only recently evolved into contact. The binary has an unusually high mass ratio (0.84), and a relatively long orbital period (0506) for it spectral type (mid-G). Twelve ultraviolet spectra of OO Aql were obtained in 1988 with the IUE satellite, including a series of consecutive observations that cover nearly a complete orbital cycle. Chromospheric activity is studied by means of the Mg ii hk emission at 2800 Å. The Mg ii emission is found to vary, even when the emission is normalized to the adjacent continuum flux. This variation may be correlated with orbital phase in the 1988 observations. It also appears that the normalized Mg ii emission varies with time, as seen in spectra obtained at two different epochs in 1988 and when compared with two spectra obtained several years earlier. The level of chromospheric activity in OO Aql is less than that of other W UMa-type binaries of similar colors, but this is attributed to its early stage of contact binary evolution. Ultraviolet light curves were composed from measurements of the ultraviolet continuum in the spectra. These were analyzed along with visible light curves of OO Aql to determine the system parameters. The large wavelength range in the light curves enabled a well-constrained fit to a cool spot in the system.
Subject headings:
binaries: eclipsing – stars: activity – stars: chromospheres – stars: individual (OO Aquilae)1. Introduction
The eclipsing binary star system OO Aquilae (HD 187183, , , mid-G) is an unusual W UMa-type binary because it possesses a mass ratio near unity (0.84; Hrivnak 1989). This suggests that the components have only recently (on astronomical timescales) come into contact, since once in contact the stars are expected to evolve toward low mass ratio (Webbink 1976; Vilhu 1982). The orbital period of 0506 is long compared to other G spectral types stars with W UMa-type light curves. This results in an unusually large angular momentum for a cool W UMa-type system, again suggesting that it has only recently evolved into contact (Mochnacki 1981). Thus OO Aql represents a rare, transient phase in the evolution of contact binary star systems. On the basis of his modern radial velocity study using the cross-correlation technique, Hrivnak (1989) carried out a consistent analysis of both the light and velocity curves of OO Aql. He determined the absolute parameters of the two stars with high precision (M1=1.040.02 M☉, R1=1.390.02 R☉, M2=0.880.02 M☉, R2=1.290.02 R☉). By comparing its properties with stellar models, Hrivnak presented evidence that the stars have an age of 8 Gyr. Thus OO Aql consists of a pair of mid-G stars in contact, which appear to be somewhat more evolved than the Sun. It falls into the subclass of A-type W UMa-type binaries, in which the more massive component is eclipsed at primary minimum; this is unusual among the cooler (G and K spectral type) W UMa-type binaries.
W UMa-type binaries of G and K spectral type are known to display a high level of chromospheric activity, as shown in the study of Rucinski (1985). Most contact binaries of GK spectral types have periods of 025 to 035 and mass ratios of 0.3 to 0.5. Thus OO Aql is clearly unusual. Another contact binary with a large mass ratio (0.94) is VZ Psc (P=026, K25). This system displays a high level of chromospheric activity, with strong and variable Mg ii h+k and Ca ii H+K emission (Hrivnak, Guinan, & Lu 1995). This suggests that OO Aql might also have variable chromospheric activity. In OO Aql, Ca ii emission is not evident in medium-resolution spectra, although there may be infilling of the broad absorption profiles (Hrivnak 1989). However, this apparent absence is most probably the result of a contrast effect, since OO Aql is hotter and has a much higher continuum in this spectral region (39004000 Å) than does VZ Psc. Since the continuum is lower in the ultraviolet, the Mg ii h+k emission at 2800 Å provides a better opportunity to measure the chromospheric activity in OO Aql. A single observation of OO Aql made with the low-dispersion LWR camera of the International Ultraviolet Explorer (IUE) satellite by Rucinski (1985) in 1984 indicated an unusually low Mg ii emission level when compared with other W UMa-type systems. No x-ray detections, which would measure the coronal activity, have been reported for OO Aql, not even in the ROSAT Faint Source Catalogue (Voges et al. 2000). However, it has been measured as a variable radio source. It was one of only a few systems detected in a 3.6-cm radio continuum survey of W UMa-type binaries, but was not detected at similar sensitivity when observed two years later (Rucinski 1995). With this background of well-determined but unusual properties (compared with other W UMa-type binary systems), we were motivated to carry out an ultraviolet study of OO Aql with the IUE satellite during a complete orbital cycle. Our goal was to investigate the level of its Mg ii emission and to search for phase-related and time-related variations. As a by-product of these spectra, we also obtained ultraviolet light curves. In this paper we present the results of this study.
2. IUE Observations and Reductions
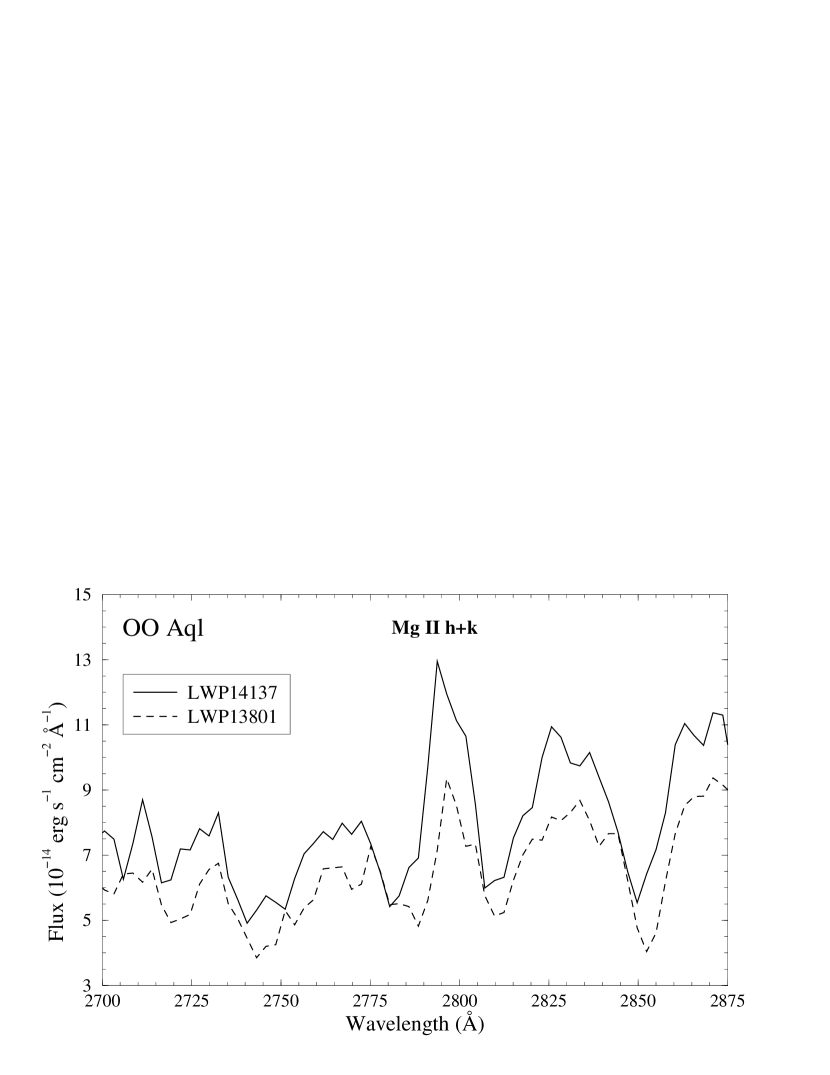
Observations of OO Aql were made with the IUE satellite on 1988 August 8 and September 30 (UT). Nine spectra were obtained on the first date, covering 80% of the orbit, and three on the second date, which fill in part of the phase gap and also include a spectrum during primary minimum. The long-wavelength primary (LWP) camera, which covers 20003200 Å, was used with the large aperture in the low-dispersion mode. This resulted in a spectral resolution of 6 Å. Exposure times ranged from 18 to 35 min, and were varied with the phase of the light curve to give approximately constant signal-to-noise ratios (except for the last observation of the first date, which was exposed a bit longer). The observing log is listed in Table 1. The observing times were converted to heliocentric Julian date (HJD), including the heliocentric time corrections. The rising ultraviolet continuum with numerous absorption blends is clearly seen in these spectra from 2400 to 3000 Å. In each case Mg ii h+k emission is seen rising in the middle of the broad Mg ii (photospheric) absorption feature. An example of the LWP spectrum of OO Aql in this region is shown in Figure 1.
The primary goal of the observations was to obtain good spectra in the region around the chromospheric Mg ii h+k emission lines at 2800 Å. At this low dispersion, the Mg ii doublet (2795.5, 2802.7 Å) cannot be resolved for these broad-lined stars. Examples of the Mg ii emission profiles from spectra taken on the two observing dates are shown in Figure 2. To measure the strength of the Mg ii emission, one needs to take into account the underlying Mg ii absorption profile. One possible approach to this would be to obtain a similar IUE spectrum of a mid-G dwarf and broaden it as necessary to match the spectrum of the binary. A subtraction of normalized spectra would then yield a measure of the Mg ii emission. However, it would be difficult to obtain a spectrum which is an exact match for OO Aql. Instead, since the absorption profiles are clearly seen except for the central emission, one can extrapolate the wings to determine the central absorption profile in each spectrum with consistency and reasonable accuracy. This second method was used to determine the underlying absorption profile, and by subtraction the emission strengths were determined. Reductions and measurements were made using the standard NEWSIPS reduction program, but including the new flux calibration of Massa & Fitzpatrick (2000). The measured values of the emission strengths are listed as f(Mg ii) in Table 1.
Several measurements of the continuum flux density were also made from each LWP spectrum. These provide ultraviolet light curves, and also can be used to investigate variations of the Mg ii emission relative to the ultraviolet continuum. To investigate the ultraviolet light curves, the total ultraviolet flux densities were measured in intervals of 50 Å width, centered at 2575, 2675, and 2975 Å. These are spectral regions without dominant absorption features or reseauxs. Also measured were two regions of 20 Å width, 27602780 Å and 28202840 Å, centered around the Mg ii feature. These were later used to determine the Mg ii strength relative to the adjacent continuum. All of these measurements are also listed in Table 1.
In addition to obtaining ultraviolet light curves from the flux-calibrated spectra, one can also use the fine error sensor (FES) on board the satellite to obtain a visual light curve. To accomplish this, FES observations of OO Aql were made immediately before and after most spectra. The observations each consisted of two successive measurements with sample times of about 10 sec each, which were averaged. To compensate for possible drifts in the sensitivity of the FES with time, several observations were also made of a nearby comparison star, HD 186656 (, ). Differential FES magnitudes, transformed approximately to the standard V system using the calibration of Imhoff & Wasatonic (1986), are listed in Table 2. The estimated uncertainty in the differential V(FES) magnitudes is 0.015 mag. For a star of K, the effective wavelength of the broad bandpass of the FES is 5500 Å (Imhoff 1989).
3. Analysis of the Ultraviolet and Visible Light Curves
In Figure 3, the visible (FES) and two ultraviolet light curves of OO Aql are plotted. The V(FES) light curve shows the typical shape of a W UMa-type binary, with continuously varying light and curvature in the maxima. The orbital phases in Tables 1 and 2 and Figure 3 were calculated using the results of the period study of this system by Demircan & Gurol (1996). Their linear ephemeris was used:
| (1) |
Their sinusoidal ephemeris gave similar results for the times of these IUE observations, producing a phase difference of only .
The ultraviolet light curves are all very similar to one another. The measurements in each wavelength region were normalized to their maximum value and converted to the magnitude scale. As examples, the light curves at 2675 and 2975 Å are shown in Figure 3. The magnitude scale of the ultraviolet light curves has been arbitrarily shifted in this figure for display purposes.
The shape of a light curve in systems like OO Aql is determined by its orbital and physical properties, which stay constant over rather long timescales, and also by transient phenomena, that vary over timescales as short as a few months, like starspots. As can be seen in Figure 3, the number of measurements in both the FES and the ultraviolet light curves is unfortunately too small to attempt a complete (orbital, physical, and radiative properties) solution of the light curves. Several tests showed that the phase coverage is not dense enough (notice the lack of coverage of the minima) for reaching convergence. To circumvent the problem, we adopt the orbital and physical properties of the system from the solution of light curves with better phase coverage, and then check for consistency with our observations.
Good-quality differential light curves in blue () and yellow () passbands were published by Binnendijk (1968) from 1966 and by Lafta & Grainger (1985) from 1982. Binnendijk’s measurements have excellent phase coverage, while Lafta & Grainger’s observations show a small gap at orbital phases . They all show the secondary minimum to be nearly as deep as primary, and the first maximum at phase 0.25 to be somewhat brighter than the second maximum. We decided to consider both datasets for further analysis because they are both of good quality. The analyses for the data sets, however, had to be done independently, since the observations were made 16 years apart and the effects of transient phenomena on the light curves, such as starspots, do not allow a simultaneous and self-consistent analysis.
The light curves were fitted using an improved version of the Wilson-Devinney program (Wilson & Devinney 1971; hereafter WD) that includes an atmosphere model (Kurucz’s ATLAS9) routine developed by Milone, Stagg, & Kurucz (1992) for the computation of the stellar radiative parameters. A contact configuration (WD in mode 3) was chosen when running the models. The bolometric albedo and the gravity brightening coefficients were set to values of 0.5 and 0.32, respectively, as usually adopted for the convective envelopes of these late-type stars. The mass ratio () was fixed to the spectroscopic value of and the temperature of the primary star was set to 5700 K (Hrivnak 1989). The WD program was run in an iterative mode, in which differential corrections were made to the fitted parameters until convergence was achieved. Several sets of starting parameters were used in order to explore the full-extent of the parameter space and also to make a realistic estimation of the uncertainties. Simultaneous solutions for the and light curves were run for both datasets.
The fitted orbital and physical parameters in the light curve analyses were the orbital inclination (), the temperature of the secondary (), the gravitational potential of the common surface (), the luminosity of the primary (), and a phase offset. In addition, a dark spot on one of the components was included in the modeling to fit the asymmetry of the light curves. Both in the case of Binnendijk’s and Lafta & Grainger’s light curves, similarly good fits were obtained with a spot about 300 K cooler than the photosphere located on either the primary or secondary components. This inability to distinguish between these two options is not surprising since the difference in wavelength is small between the B and V light curves and since the spot is visible at an orbital phase when both components are in view. Since the solution to the ultraviolet light curves that we discuss later clearly indicates that a cool spot is present on the primary component, we have also assigned the cool spot to the primary component in the modeling of these visible light curves. The latitude, the longitude, and the size of the spot were left free in the differential corrections algorithm. Convergence for the full set of parameters was reached very quickly for both data sets primarily because of the good phase coverage.
The orbital and physical parameters of OO Aql are not expected to change between the two observing epochs. Therefore it is pleasantly reassuring to find that the best-fitting orbital and physical properties obtained from the analyses of the two independent datasets are found to agree within their uncertainties. Only the spot parameters, as one may expect, differ between the two light curve solutions. In both cases, the latitude111We are listing the latitude rather than the co-latitude, which is used internally in the WD program. of the spot in the secondary component is found to be around , but the spot longitudes and sizes are different: a longitude of and spot radius of for Binnendijk’s light curves, and a longitude of and a spot radius of for Lafta & Grainger’s observations. In both cases, these result in a second maximum that is fainter than the first. The fits of the model light curves to the observed normal points are displayed in Figure 4. The fits are quite good; only slight systematic deviations among the observations and the synthetic light curves are seen near phase 0.8 in the light curves of Lafta & Grainger (both and ). These may be caused by the simplified spot model (circular cool spot with uniform temperature) that the WD program uses. The final r.m.s. residuals of the fit were about 0.011 mag and 0.012 mag for the light curves of Binnendijk and Lafta & Grainger, respectively, which corroborates their very similar quality.
We decided to adopt the best-fitting WD solution to Binnendijk’s light curves as our final values, as listed in Table 3. The reason for this is twofold. On the one hand, no systematic deviations are present in the residuals. On the other hand, the spot size, and therefore its influence on the light curve, is smaller in Binnendijk’s light curves, which makes the determination of the intrinsic properties of the stars more reliable. In any case, as we have already noted, the parameters yielded by the analysis of Lafta & Grainger’s light curves fall within the uncertainties quoted in Table 3.
A detailed study of the light curves of Binnendijk has already been carried out by Hrivnak (1989). We decided, however, to undertake a new analysis chiefly because of the improved light curve fitting program presently available. The new modeling has a more sophisticated treatment of the stellar atmospheres with ATLAS9 Kurucz models (limb darkening, reflection, etc.) and it also includes a starspot to account for the asymmetry of the light curves. Despite the more accurate treatment, the values of the best-fitting parameters presented in Table 3 are in agreement with those already published by Hrivnak (1989), with the only significant difference being a higher inclination () in his solution. A summary of the physical properties of the two components derived with our new solution is presented in Table 4. These are in agreement with the results of the earlier analysis by Hrivnak (1989)222A computational error exists in Hrivnak’s (1989) values for log (cgs); they should be 4.18 and 4.17 for the primary and secondary components, respectively..
Once the orbital and physical properties of the system were determined, the sparsely-covered FES and ultraviolet light curves could be fit while fixing most of the parameters. Only the zero-point of the magnitude scale in each of the light curves and the spot parameters were left free in the differential corrections algorithm. A total of five light curves (FES and four ultraviolet, including one at = 2800 Å formed from averaging the continuum fluxes in the two narrower regions adjacent to the Mg ii feature) were fitted simultaneously. Interestingly, despite the poor phase-coverage, convergence of the spot parameters was achieved rapidly and with a high degree of confidence. This can be explained in terms of the large wavelength range (5500 to 2575 Å) in which the effects of the spot are critical (the contrast between the spot and the surrounding photosphere increases strongly from the optical to the ultraviolet). The solution indicates a spot on the primary component K cooler than the photosphere located at a latitude of , a longitude of , and with a radius of . Thus the spot is facing the observer around primary minimum, although it is partially eclipsed.
Examples of the best-fitting synthetic light curves are shown together with the observations in Figure 3. As can be seen, the fits are very good at all wavelengths and do not show any noticeable systematics, indicating that our physical model is essentially correct. The r.m.s. residuals are 0.032 mag, 0.041 mag, 0.067 mag, 0.045 mag, and 0.049 mag, for the light curves at 5500 Å (FES), 2975 Å, 2800 Å, 2675 Å, and 2575 Å, respectively. The shape of our best-fitting light curves is consistent with the observations of Demircan, Derman, & Ekmekci (1991) made around this time (1988–1990), i.e. maxima of similar heights and slightly more unequal eclipse depths. These contrast with the brighter maximum at phase 0.25 and the slightly more similar eclipse depths seen in the light curves of Binnendijk and Lafta & Grainger. The results indicate that the starspot (or major spot group), once centered around phase 0.75, had moved close to the phase of the primary minimum when our observations were made.
In Figure 4 a color curve formed from the 2675 ultraviolet curve and the V(FES) light curve is also plotted. The data points represent the difference between the observed ultraviolet magnitudes and the magnitudes interpolated from the best-fitting synthetic V(FES) light curve at the proper phases. Note the color dependence in the phases around the primary eclipse despite the similar effective temperature of both components. This color dependence can be attributed to the increased effect of limb darkening when the smaller star transits the larger one (limbs of both stars visible) and to the presence of the dark spot partially in view near the phase of the primary minimum, in addition to the gravity darkening which reddens both minima.
4. Analysis of the Mg ii Emission
The values of the Mg ii flux density, as determined by measurements of the emission above the underlying absorption profiles and listed in Table 1, indicate that the flux varies. These are plotted in the top portion of Figure 5 as a function of orbital phase. It can be seen that there is a clear phase dependence in the Mg ii strength, with lower values corresponding to phases of minimum light (eclipses) in the light curve. Another way to investigate the presence of a variation in the emission is to simply measure the total flux within the Mg ii spectral region, relative to the adjacent continuum. This was also carried out, and shows a similar phase-dependent variation in Mg ii emission.
If the Mg ii h+k emission originates from many active regions distributed around the atmosphere of the two components, then one would expect the net emission to vary with the projected cross-sectional area of the two stars, which varies with the orbital phase. A first-order correction for this effect can be made by normalizing the Mg ii emission relative to the light curve. The two adjacent continuum bands measured from 27602780 Å and 28202840 Å were used for this purpose, and the Mg ii emission flux relative to the average of these was calculated. This is listed in Table 1 as Ruv, where Ruv = f(Mg ii)/f(uv cont). Rucinski (1985), in his study of the Mg ii emission in W UMa-type binaries, normalized the Mg emission relative to the bolometric flux, Rbol = f(Mg ii)/f(bol), where
| (2) |
and m(bol) = V + BC. We also calculated this ratio. The value of V is interpolated from the synthetic V(FES) light curve, and BC was estimated from the colors of the system, (Eggen 1967), and reddening, (Hrivnak 1989), to be 0.15 (Flower 1996). Both of these normalized measures of the Mg ii emission show similar effects, and in Figure 5 is plotted Ruv versus orbital phase.
A variation is seen in the normalized Mg ii emission Ruv. Initial inspection of the bottom portion of Figure 5 suggested a phase dependence, since the values based on the five observations in the phase interval 0.800.05 are larger than those of the seven observations in the phase interval 0.050.70 by 36 on average. However, these may instead represent a variation with time, with the average Ruv value of the three observations from September 1988 larger by 35 than the average Ruv value of the nine observations from August 1988. The highest Mg ii flux measurement, at phase0.81, may be the result of chromospheric flaring, which gradually decreased or rotated partially out of view when the following two observations were made. Also included in Table 1 and Figure 4 are the results from single observations of OO Aql made four and six years earlier. These spectra were obtained from the IUE archives and were reduced and measured in the same way as the others. The one from 1982 has a normalized Mg ii flux similar to those of the 1988 observations, while the one from 1984 (Rucinski) is lower. We conclude that the normalized Mg ii flux varies with time, and perhaps it also varied with phase during our 1988 observations. If the normalized Mg ii variation is indeed related to phase in the 1988 observations, one can investigate its relationship with the visibility of the spot. If we assume that the highest emission value at phase represents a flare and simply look at the other four higher emission measurements in the bottom of Figure 5, the results seem to be ambiguous. The normalized Mg ii emission is high as the spot comes into view (phase ), but the spot is partially eclipsed during the high Mg ii observation at phase, and the observed emission is not high in the phase interval .
5. Summary and Conclusions
Ultraviolet observations were obtained for the short-period contact binary OO Aql on two dates in 1988, including nine consecutive observations that covered most of one orbital cycle. Mg ii h+k emission is seen in each of the spectra. These were measured for emission strength, and also measurements were made of the continuum at several wavelength intervals and used to compose ultraviolet light curves for the binary. An analysis of the Mg ii emission indicates that real variations in the strength of the feature exist for OO Aql, even when normalized to the surrounding ultraviolet continuum. These may be correlated with the orbital phase, or they may instead indicate overall changes in the chromospheric activity level with time.
Previous studies of phase-related activity in W UMa-type binaries have yielded similar results. Eaton (1986) found only a slight phase dependence in the normalize Mg ii emission for SW Lac (P=032, K0), another contact binary with a relatively large mass ratio (0.73, Hrivnak 1992). The study of VZ Psc (Hrivnak et al. 1995) revealed variations in the normalized Mg ii emission that were not phase dependent, but that seemed to vary in time. VW Cep (P=027, G5V+G8V) shows primarily time-dependent variations in chromospheric Mg ii emission and also in the transition region emission flux (Guinan & Giménez 1993). Thus variations in the normalized Mg ii emission are common in W UMa-type binaries, but these are typically not phase dependent, and instead are probably due to variations in chromospheric activity arising from possible flaring.
General trends have been found for W UMa-type and other short-period binaries in studies of chromospheric activity versus color or orbital period. A summary for W UMa-type binaries has been published by Rucinski (1985), which included his observation of OO Aql. While these more recent observations show OO Aql to have a somewhat higher level of chromospheric activity than at the time of his 1984 observation, the basic interpretation is the same; OO Aql has a much lower level of relative activity (by a factor of 2 relative to f(bol)) than do other contact binaries with similar colors. However, this is presumably due to the recent evolution of its components into contact. While in contact, OO Aql is expected to transfer mass from the less-massive secondary to the more-massive primary component (Webbink 1976), reducing the mass ratio and causing the system to evolve to evolve to an F spectral type. The level of chromospheric activity in OO Aql is in fact comparable to that in W UMa-type systems with the colors of F stars.
Ultraviolet light curves are presented here for the first time for OO Aql. They show a similar shape and amplitude as the visible light curves. Since the two stars have similar temperatures, there is expected to be little change in the light curves with wavelength. Synthetic light curve solutions were carried out for and light curves for two different epochs, and similar orbital and physical parameters were obtained. These were used to model the new ultraviolet light curves, and good fits were obtained. The combination of ultraviolet and visible light curves led to a well-determined fit for a cool spot on the primary component. It appears that the light curves at the different epochs can each be fit by the same orbital and physical parameters, with the presence of one major cool spot on the primary component that varies in longitude and size with time. Jeong et al. (1994) carried out a somewhat similar ultraviolet and visible light curve analysis for SW Lac, also including a single cool spot.
The high mass ratio and relatively long orbital period lead to a relatively large orbital angular momentum for OO Aql, which is larger than that of most contact binaries but less than that of the short-period detached binaries with G-type components, such as ER Vul and UV Leo. It is likely that the detached systems such as ER Vul (P=070, M1=0.96 M☉, M2=0.89 M☉, Budding & Zeilik 1987) and UV Leo (P=060, M1=0.99 M☉, M2=0.92 M☉, Popper 1980) will evolve into contact systems like OO Aql (P=051, M1=1.05 M☉, M2=0.88 M☉) through angular momentum loss by magnetic breaking (Mochnacki 1981; Vilhu 1982). However, ER Vul has a much higher level of variable starspot and chromospheric activity than that seen in OO Aql, even though its rotational period is longer and its spectral type earlier than those of OO Aql. If OO Aql is typical of a system of solar mass stars that have recently evolved into contact, then the previous high level of activity must be significantly reduced in the contact phase. Subsequent evolution while in contact is expected to decrease the mass ratio, and if this is so, then a binary like OO Aql will gradually evolve from G to F spectral type as the mass is transferred from the secondary to the primary component. As shown by Rucinski (1985), the F spectral type systems show a lower activity, consistent with what is now seen in OO Aql.
Thus this study of OO Aql has presented an opportunity to learn more about the properties of a close binary in a rather short-lived stage of its evolution, shortly after the two stars have evolved into contact. If OO Aql is typical of this stage, then it appears that the level of chromospheric activity must be reduced rather quickly upon entering the contact configuration, with the contact binary continuing to maintain this lower level with some smaller variations over time.
References
- (1) Binnendijk, L. 1968, AJ, 73, 32
- (2) Budding, E., & Zeilik, M. 1987, ApJ, 319, 827
- (3) Demircan, O., Derman, E., & Ekmekci F. 1991, IAU Inf. Bull. Var. Stars, 3551
- (4) Demircan, O., & Gurol, B. 1996, A&AS, 115, 333
- (5) Eaton, J. A. 1986, Acta Astr., 36, 79
- (6) Eggen, O. J. 1967, Mem. RAS, 70, 101
- (7) Flower, P. J. 1996, ApJ, 469, 355
- (8) Guinan, E. F., & Giménez, A. 1993, in The Realm of Interacting Binary Stars, ed. J. Sahade, G. E. McCluskey, Jr., Y. Kondo (Dordrecht: Kluwer), 51
- (9) Hrivnak, B. J. 1989, ApJ, 340, 458
- (10) Hrivnak, B. J. 1992, Bull. AAS, 24, 686
- (11) Hrivnak, B. J., Guinan, E. F., & Lu, W. 1995, ApJ, 455, 300
- (12) Imhoff, C. L. 1989, NASA IUE Newsletter, 40, 5
- (13) Imhoff, C. L., & Wasatonic, R. 1986, NASA IUE Newsletter, 29, 45
- (14) Jeong, J. H., Kang, Y. W., Lee, W. B., & Sung, E. C. 1994, ApJ, 421, 779
- (15) Lafta, S. L., & Grainger, J. F. 1985, Ap&SS, 114, 23
- (16) Massa, D. & Fitzpatrick, E. L. 2000, ApJS, 126, 517
- (17) Milone, E. F., Stagg, C. R., & Kurucz, R. L. 1992, ApJS, 79, 123
- (18) Mochnacki, S. W. 1981, ApJ, 245, 650
- (19) Popper, D. M. 1980, ARA&A, 18, 115
- (20) Rucinski, S. M. 1985, MNRAS, 215, 615
- (21) Rucinski, S. M. 1995, AJ, 109, 2690
- (22) Vilhu, O. 1982, A&A, 109, 17
- (23) Voges, W., Aschenbach, B., Boller, Th., et al. 2000, The ROSAT All-Sky Survey Faint Source Catalogue, Max-Planck-Institut für Extraterrestrische Physik, Garching (http://wave.xray.mpe.mpg.de/rosat/catalogues/rass-fsc/)
- (24) Webbink, R. F. 1976, ApJ, 209, 829
- (25) Wilson, R. E., & Devinney, E. J. 1971, ApJ, 166, 605 (WD)
| Image No. | HJD | Phase | Exposure | f(Mg ii)aaUnits of 10-13 erg cm-2 s-1. | f(2575)bbUnits of 10-12 erg cm-2 s-1. | f(2675)bbUnits of 10-12 erg cm-2 s-1. | f(2975)bbUnits of 10-12 erg cm-2 s-1. | f(2770)bbUnits of 10-12 erg cm-2 s-1. | f(2830)bbUnits of 10-12 erg cm-2 s-1. | Ruv | RbolccUnits of 10-5. |
|---|---|---|---|---|---|---|---|---|---|---|---|
| (2,440,000+) | Time(min) | (50 Å)ddWidth of integrated flux density interval. | (50 Å)ddWidth of integrated flux density interval. | (50 Å)ddWidth of integrated flux density interval. | (20 Å)ddWidth of integrated flux density interval. | (20 Å)ddWidth of integrated flux density interval. | |||||
| LWP 13801 | 7381.601 | 0.856 | 25 | 5.41 | 1.60 | 2.99 | 6.32 | 1.28 | 1.58 | 0.38 | 10.16 |
| LWP 13802 | 7381.647 | 0.946 | 25 | 3.53 | 1.14 | 1.79 | 3.95 | 0.72 | 0.95 | 0.42 | 9.43 |
| LWP 13803 | 7381.711 | 0.073 | 28 | 3.64 | 1.27 | 2.32 | 5.23 | 0.99 | 1.29 | 0.32 | 8.56 |
| LWP 13804 | 7381.759 | 0.168 | 20 | 5.01 | 1.82 | 3.30 | 7.19 | 1.33 | 1.79 | 0.32 | 8.88 |
| LWP 13805 | 7381.817 | 0.283 | 18 | 5.82 | 2.07 | 3.65 | 7.52 | 1.50 | 1.98 | 0.33 | 9.58 |
| LWP 13806 | 7381.858 | 0.362 | 20 | 4.17 | 1.74 | 3.33 | 6.57 | 1.29 | 1.65 | 0.28 | 7.65 |
| LWP 13807 | 7381.909 | 0.463 | 25 | 2.82 | 1.11 | 1.91 | 4.07 | 0.79 | 1.01 | 0.31 | 8.18 |
| LWP 13808 | 7381.958 | 0.561 | 30 | 3.98 | 1.35 | 2.52 | 5.09 | 1.09 | 1.34 | 0.33 | 9.65 |
| LWP 13809 | 7382.011 | 0.664 | 35 | 5.45 | 1.81 | 3.54 | 7.45 | 1.50 | 1.92 | 0.32 | 9.55 |
| LWP 14137 | 7434.788 | 0.805 | 20 | 9.05 | 1.87 | 3.53 | 7.16 | 1.49 | 2.00 | 0.52 | 15.50 |
| LWP 14138 | 7434.851 | 0.929 | 20 | 4.34 | 1.20 | 2.18 | 4.88 | 0.95 | 1.30 | 0.39 | 10.46 |
| LWP 14139 | 7434.896 | 0.018 | 28 | 2.94 | 0.75 | 1.54 | 3.19 | 0.58 | 0.75 | 0.44 | 10.24 |
| LWR 13609 | 5155.647 | 0.580 | 36 | 4.09 | 1.23 | 2.30 | 5.22 | 0.96 | 1.28 | 0.37 | 8.93 |
| LWP 03362 | 5834.767 | 0.626 | 45 | 3.91 | 1.63 | 3.34 | 6.59 | 1.34 | 1.77 | 0.25 | 7.34 |
| HJD | Phase | V(FES) |
|---|---|---|
| (2,440,000+) | ||
| 7381.5882 | 0.830 | +0.67 |
| 7381.6125 | 0.878 | +0.80 |
| 7381.6327 | 0.918 | +0.96 |
| 7381.6584 | 0.969 | +1.36 |
| 7381.6959 | 0.043 | +1.17 |
| 7381.7230 | 0.096 | +0.82 |
| 7381.7264 | 0.103 | +0.79 |
| 7381.7462 | 0.142 | +0.69 |
| 7381.7688 | 0.187 | +0.62 |
| 7381.7889 | 0.226 | +0.57 |
| 7381.8264 | 0.300 | +0.59 |
| 7381.8473 | 0.342 | +0.64 |
| 7381.8716 | 0.390 | +0.74 |
| 7381.8945 | 0.435 | +0.96 |
| 7381.9209 | 0.487 | +1.32 |
| 7381.9431 | 0.531 | +1.15 |
| 7381.9931 | 0.629 | +0.68 |
| 7382.0257 | 0.694 | +0.61 |
| 7434.8194 | 0.867 | +0.70 |
| 7434.8409 | 0.909 | +0.85 |
| 7434.8610 | 0.949 | +1.11 |
| 7434.8826 | 0.991 | +1.51 |
| Parameter | Value |
|---|---|
| Inclination (deg) | |
| T (K) | |
| / | bbFixed at the spectroscopic value of Hrivnak (1989). |
| /)B | |
| /)V | |
| (fill-out factor) | cc. |
| (volume) | |
| (volume) |
Note. — The uncertainties listed are standard deviations derived from a sampling of the minimum.
| Primary | Secondary | |
|---|---|---|
| Mass (M⊙) | ||
| Radius (R⊙) | ||
| (cgs) | ||
| (K) | ||
| (mag) | ||
| (mag) |
Note. — Adopted the radial velocity curve solution of Hrivnak (1989); BC from Flower (1996).