SRON Laboratory for Space Research Sorbonnelaan 2, 3584 CA Utrecht, The Netherlands
CEA/DSM/DAPNIA Saclay, Service d’Astrophysique, L’Orme des Merisiers, Bât. 709., 91191 Gif-sur-Yvette, France
Max-Planck-Institut für extraterrestrische Physik, P.O. Box 1312, 85741 Garching, Germany
Institute of Astronomy, Madingley Road, Cambridge CB3 0HA, UK
NASA/GFSC, Code 662, Greenbelt, MD, 20771, USA
Space Sciences Laboratory, University of California, Berkeley, CA 94720, USA
Mullard Space Science Laboratory, UCL, Holmbury St. Mary, Dorking, Surrey RH5 6NT, UK
X-ray Imaging-Spectroscopy of Abell 1835
We present detailed spatially-resolved spectroscopy results of the observation of Abell 1835 using the European Photon Imaging Cameras (EPIC) and the Reflection Grating Spectrometers (RGS) on the XMM-Newton observatory. Abell 1835 is a luminous ( ergs ), medium redshift (), X-ray emitting cluster of galaxies. The observations support the interpretation that large amounts of cool gas are present in a multi-phase medium surrounded by a hot (=8.2 keV) outer envelope. We detect O VIII Ly and two Fe XXIV complexes in the RGS spectrum. The emission measure of the cool gas below =2.7 keV is much lower than expected from standard cooling-flow models, suggesting either a more complicated cooling process than simple isobaric radiative cooling or differential cold absorption of the cooler gas.
Key Words.:
Galaxy Clusters: Individual: Abell 1835 – Galaxies: Cooling Flows – Techniques: Spectroscopic1 Introduction
Previous soft X-ray imaging and medium spectral resolution studies have implied the presence of cool gas near the centers of clusters (See e.g. Sarazin Sarazin88 (1988), Fabian Fabian94a (1994)). For the Centaurus, Perseus, Virgo, and Coma clusters there is direct spectroscopic evidence for cool gas from the Einstein Focal Plane Crystal Spectrometer (Canizares et al. Can79 (1979), Can82 (1982), Mushotzky & Szymkowiak Mushot88 (1988)). Based on simple, robust estimates for the electron densities and temperatures, it is estimated that in the large majority of clusters, gas in the central volume should cool radiatively to very low temperatures on a timescale short compared to the characteristic age of the cluster. Due to the consequent lack of central pressure support, gas has to continuously flow inward into the cluster potential.
This picture of cluster cooling flows is incomplete in that the fate of the cooling gas is unknown. Material that has cooled to below X-ray emitting temperatures generally fails to be detected by emission at any other wavelengths, although more recently there are indications that cold gas may be distributed throughout the cooling flow. This gas betrays its presence through X-ray absorption of the cooling flow emission (but see below for evidence that such absorption is not confirmed at higher spectral resolution). A simple single phase model for the cooling gas based on the conservation laws for the global flow predicts a sharply peaked density distribution that is not consistent with the observed distributions, and this fact has given rise to the idea of a diffuse, multi-phase cooling flow (Johnstone et al.Johnstone92 (1992)).
Abell 1835 is a prototypical strong cooling-flow cluster with an inferred mass deposition rate of (Allen et al. Allen96 (1996)). The central cooling time (the time it would take the gas to radiate away all of its kinetic energy) is less than 1 Gyr, whereas the cluster could remain relatively undisturbed by mergers for 10 Gyr. So roughly the inner 350 kpc of the cluster should have had sufficient time to cool below X-ray temperatures. Allen et al. (Allen96 (1996)) found Abell 1835 to be one of the strongest cooling-flows from the deprojection of ROSAT HRI images. The ASCA spectrum was consistent with a collisionally ionized plasma, but cooling-flow spectral models were unconstrained (Allen et al. Allen96 (1996)). Allen and Fabian (Allen98 (1998)) also carried out a joint ROSAT-ASCA study and found evidence for a massive cooling flow, as well as a relatively high metallicity. Until this observation, cooling-flow properties have largely been inferred by relatively short cooling times. Here we present spectroscopic results on the properties of the cool gas.
As part of the XMM-Newton (Jansen et al Jansen00 (2000)) performance verification program, Abell 1835 was observed for 60 ks. Data were obtained simultaneously with the two Reflection Grating Spectrometers (RGS) and the three European Photon Imaging Cameras (EPIC). The RGS is capable of achieving high spectral resolution for the entire soft wavelength band (5 to 38 Å) for moderately extended X-ray sources. The spectral resolution for sources of characteristic angular size, , is roughly, . The high throughput of the XMM mirrors allows the EPIC-pn and EPIC-MOS detectors to perform detailed spectral-spatial studies of clusters since the spatial extent of most clusters is resolved. Both sets of instruments can be used together to produce a spectral-spatial model of the X-ray emission.
Throughout this paper we assume , , and . This implies an angular distance of 1280 Mpc and a luminosity distance of 1600 Mpc for Abell 1835. One arcsecond corresponds to 6.2 kpc. Errors are quoted at the confidence level and systematic errors are added in quadrature whenever they can be estimated.
2 Overall Temperature Structure
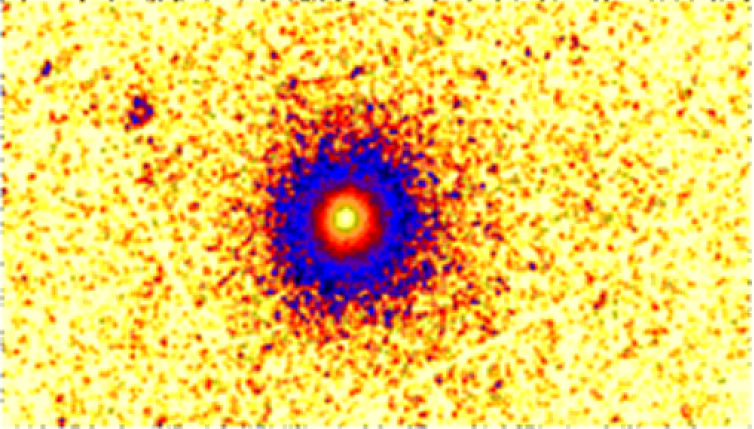
In order to study the cooling flow properties of Abell 1835 in detail, we first use the spatially-resolved EPIC-MOS and EPIC-pn spectra to characterize the temperature and density structure. The EPIC instruments and their calibration are described in Turner et al. (Turner00 (2000)) and Strüder et al. (Strueder00 (2000)). An image of Abell 1835 is shown in Fig. 1.
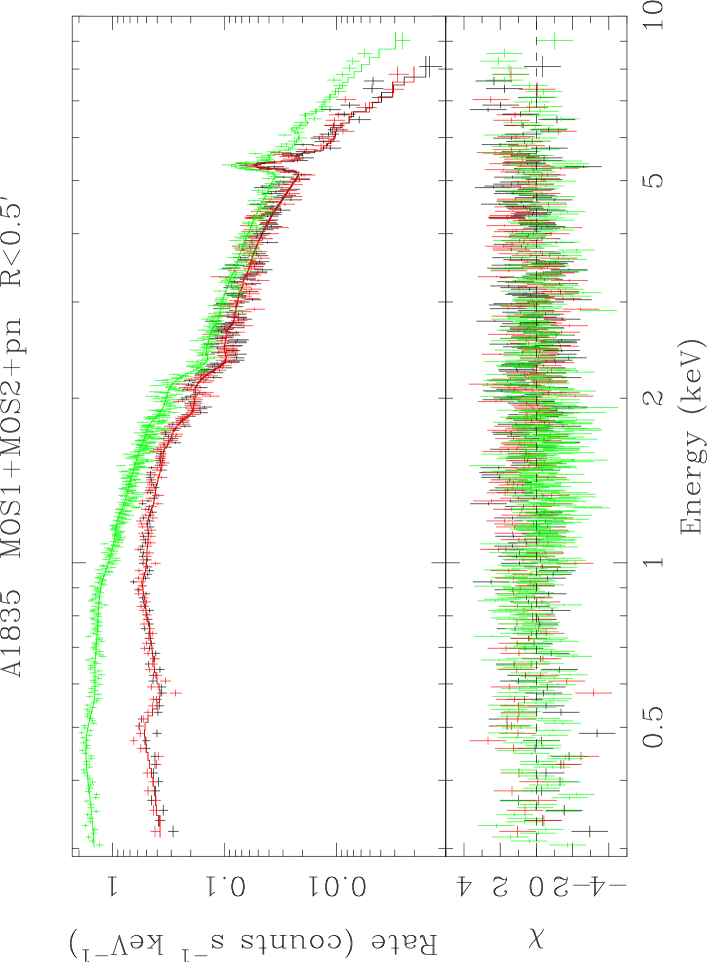
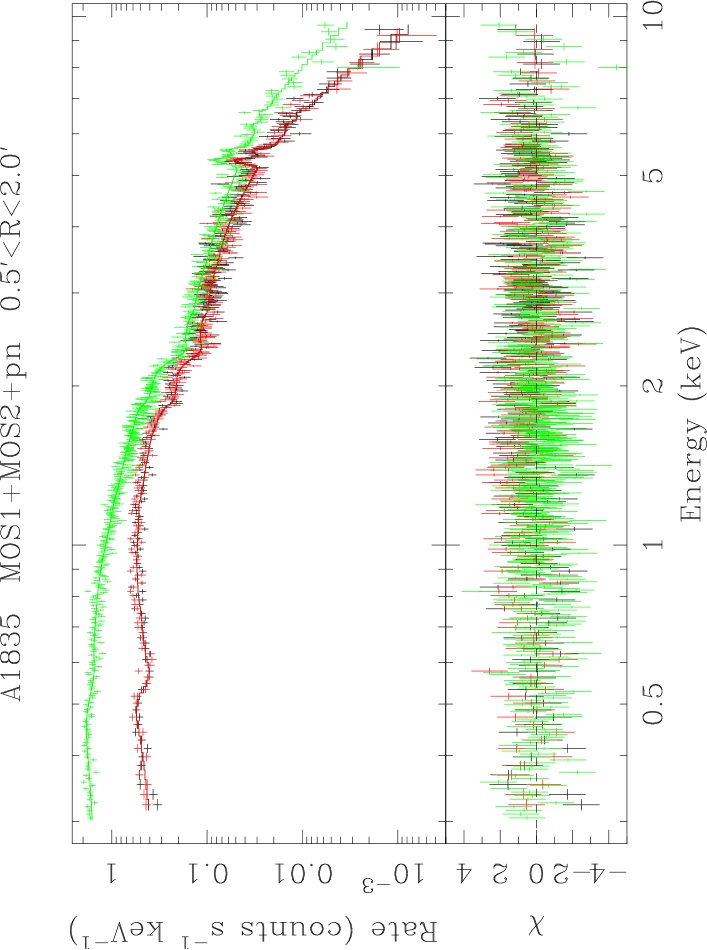
We performed spectral fits with EPIC-MOS and EPIC-pn on two concentric annuli in Abell 1835. EPIC-pn fits are shown in Figs. 2 and 3. Background spectra were used from Lockman Hole observations (Revolution 70 and 73, 100ks observation) for the MOS fits or off-source regions and the PN fits. The spectra were corrected for energy-dependent telescope vignetting. (See also Arnaud Arnaud00 (2000)) The spectral and spatial responses do not vary strongly over the chosen annuli. Periods with high background rates were removed. We fit the spectra to single temperature models with the XSPEC v11 package (Arnaud Arnaud96 (1996)) using the MEKAL (Mewe, Kaastra, & Liedahl Mewe95 (1995)) spectral model. Elemental abundance ratios were held fixed to their solar values when they were not well-constrained.
Within a 0.5 arcminute radius circle, Abell 1835 has a temperature of and an iron abundance of relative to solar. The outer region, arcminutes, has a temperature of and an iron abundance of of solar values. Column densities were consistent with the galactic value in the MOS fits and slightly lower than galactic in the PN fits. There is no evidence for a strong abundance gradient. The results of the fits are summarized in Tables 1 and 2.
The spectral fits are consistent with the interpretation that there is a large volume in the center of Abell 1835 with cooler gas at least as cool as 6 keV. We use the single temperature fits to the outer annulus to provide an upper temperature limit for the RGS analysis.
3 Cooling-Flow Spectroscopy
By studying the RGS spectrum, we can measure both the relative emission measure of cold gas and study the spectral properties of the cooling flow in detail.
The properties of the RGS and its calibration are described by den Herder et al. (JW00 (2000)). The RGS instrument effectively works as a long-slit spectrometer, providing spectral information in one direction (somewhat degraded by the spatial extent of the source) while providing 15 arcsecond imaging information in the cross-dispersion direction. For each photon, the focal plane detectors record the position along the dispersion direction (which gives the dispersion angle), the position in the cross-dispersion direction, and the CCD pulse-height. An energy dependent joint dispersion coordinate/pulse-height filter separates the spectral orders. In this analysis, we jointly use first and second orders. For all spectra presented here, we assign wavelengths based on the nominal position of the center of the X-ray emission (, ).
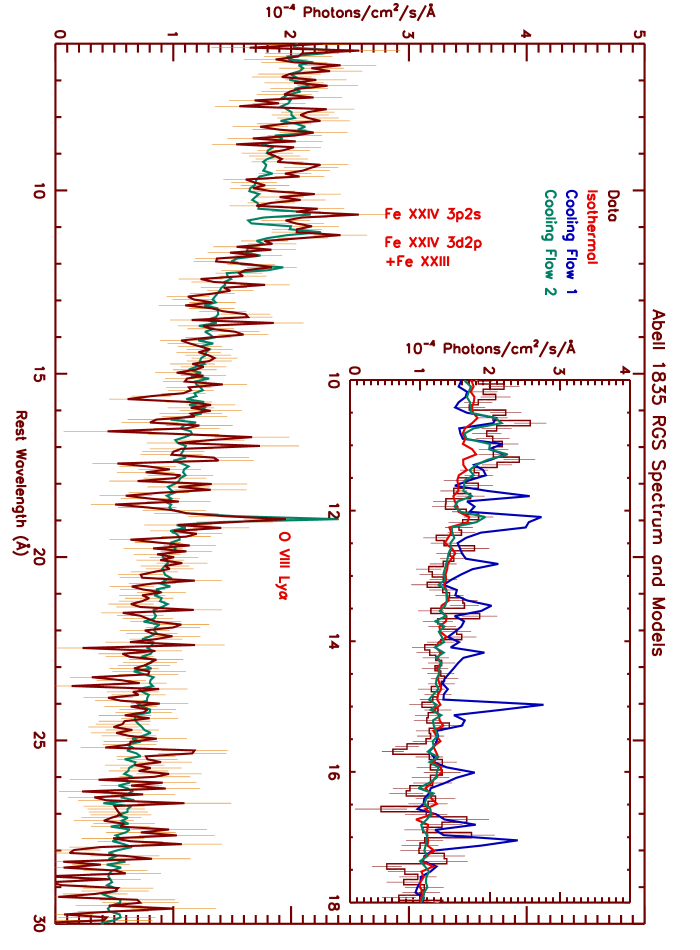
The spectrum for both RGS instruments is shown in Fig. 4. The spectrum has been corrected for redshift, divided by the effective area and exposure, and a background model is subtracted for display purposes only. These corrections have been applied based on a Monte Carlo simulation described below. Time intervals with background rates more than 4 times higher than the quiescent rate were removed from the analysis to maximize the signal to noise in the RGS instrument. For the data selection cuts used here, the background comprises of the counts in the extracted spectrum. Approximately of the 60 ks observation was used in this analysis.
We detect two Fe L complexes dominated by Fe XXIV lines (, ) and O VIII Ly () above the bremsstrahlung continuum. The lines are broadened by a sharply peaked intensity distribution of 1 arcminute FWHM. There are some non-statistical fluctuations, but all of these are much narrower than true emission lines from the cooling-flow would appear, and none of them are coincident with known strong astrophysical emission lines. The presence of the Fe XXIV ion suggests cool gas with a temperature between 1 and 3 keV, whereas O VIII could have contributions from both cool () and hot gas (). The absence of other Fe L shell ions produces strong constraints on cooling-flow models as explained below.
To fully address spectral-spatial coupling in the RGS, we compare the data directly to models by folding the spectral-spatial models through an instrument response Monte Carlo. The Monte Carlo takes wavelengths and sky positions of photons, and predicts cross-dispersion coordinates, dispersion coordinates, and CCD pulse-heights. The Monte Carlo includes characterizations of all known physical properties of the RGS instrument at the time of the writing of this paper, with the exception of a not yet calibrated O K instrumental edge of approximately 20 at 23.5 Å, which has moved to 18.7 Å in our correction of the redshift of Abell 1835 in Fig. 4. The analysis is then unaffected by the details of data selection cuts provided the same cuts are applied to the data and the Monte Carlo simulated photons. The Monte Carlo properly models the off-axis response of the RGS. The cluster emission is distributed across the entire CCD array so there is no source-free region to estimate the background contribution. Instead, we use a model based on the Lockman Hole (Revolution 70 and 73, 100ks observation) which characterizes the effects of low energy protons, the calibration sources, and the CCD detector noise. The background is smooth and is relatively flat across the wavelength band.
In order to characterize spatial structure for use in the RGS Monte Carlo, we use a previous ROSAT observations for the density parameterization, which is consistent with the observed EPIC spatial distribution. We use a model (King King66 (1966), Cavaliere & Fusco-Fermiano Cavaliere76 (1976)) to describe the density structure. The model has a core radius of 18 arcseconds, of 0.72. This characterization reproduces the RGS cross-dispersion event distribution. The exact spatial distribution is unimportant since it only affects the shape of the spectral line profiles and only a rough spatial characterization is needed. For the spectral models we use the coronal plasma MEKAL model of Mewe, Kaastra, and Liedahl (Mewe95 (1995)), the cold absorption model of Morrison and McCammon (Morrison83 (1983)), and a spectral-spatial renormalization of the MKCFLOW model for the cooling-flow emission measure included in the XSPEC v11.0 package (Arnaud Arnaud96 (1996)).
-
a
Parameters with no errors were held fixed
-
b
For the entire wavelength band (288 degrees of freedom)
-
c
For the 10 to 18 Å region (100 degrees of freedom)
We select the spectral model for the Monte Carlo simulation as a simple isothermal model folded through the instrument response based on the 8.2 keV measured temperature from the EPIC-MOS fit for the ambient gas. We also add a background component. We set all elemental abundances other than that of oxygen to of solar values and we set the iron abundance to 0.35 of solar values. The spatial distribution is given by the above mentioned beta model. We see that the agreement with the measured continuum is quite good (see Fig. 4). The oxygen line flux is well-matched by adjusting the abundance to of the solar value. The Fe XXIV complexes are above the expectation for the continuum and are directly attributable to the cooling-flow.
Next, we attempt a multi-phase cooling flow model where the ambient gas is fixed at a temperature of 8.2 keV and a fraction of the cool gas is expected to exist at all radii at several temperatures. Following the model of Johnstone et al. (Johnstone92 (1992)), we model the cool component as having the same spatial distribution as the ambient component but only existing within the cooling radius. We have insufficient counts in the spectral lines to determine the spatial distribution of the cool gas relative to the hot ambient gas. The emissivity of the cooling-flow gas is calculated from a conventional isobaric cooling-flow prescription, in which each temperature interval is weighted with the time the gas spends cooling through that interval. The resulting differential emission measure is then proportional to the inverse of the total radiative cooling function. We also allow for additional cold absorption applying it only to the cooling flow component at the redshift of the source, where the flux is reduced by to account for self-absorption. This would apply if large deposits of cold byproducts of the cooling flow exist uniformly in the cooling-flow region. We fix the foreground column density to the galactic value and apply it to both spectral-spatial components. The relative normalization between the two components is determined by the mass deposition rate () and the overall normalization is determined by central electron number density.
To match the observed equivalent widths of the Fe XXIV lines (10.66 Å, 10.62 Å, 11.03 Å, 11.18 Å, 11.43 Å) , we require a mass loss rate of 1700 , but the model predicts significant line emission from several other iron ions that is not observed. This is seen quite easily from the blue model in the insert in Fig 4. In particular, Fe XVII (15.01 Å, 17.05 Å, 17.10 Å, 16.78 Å) lines are most notably absent. Other ions such as O VII (21.6, 21.8, 22.1 Å) are not observed, but are not expected to be significant since the gas should cool very rapidly at lower temperatures.
Previous ASCA studies found an emission line deficit at low energies (Fabian Fabian94 (1994)), but this was modeled as uniformly distributed additional absorption of (Allen et al. Allen00 (2000)). Here we find no evidence for additional absorption uniformly distributed (). A larger uniform column density would have produced detectable absorption of the continuum seen through the cooling flow. Any large absorption also reduces the flux of the Fe XXIV lines. We do not see this absorption so we model the spectrum by cutting off the temperature distribution. The EPIC fits to cooling flow models required either additional cold absorption of or a cut-off in the temperature emission measure distribution at .
To characterize the spectrum empirically, we use the same cooling-flow model but put a lower temperature cut-off on the emission measure distribution of as shown by the green model in Fig. 4. This cut-off is strongly constrained by the lack of Fe XXIII emission. The Fe XXIV 10.6 Å complex is not well-matched because the true emission measure distribution probably falls more rapidly than implied by the isobaric cooling model. Fe XXIII contributes partly to the 11.4 Å complex (Savin Savin96 (1996)).
If an additional cooling-flow component is added with no cutoff on the emission measure distribution, then its mass loss rate is less than 200 ( confidence+systematic). The strongest constraint comes from the Fe XXIII, Fe XII, Ne X complex at . A smaller mass flow rate may be more consistent with the detection of molecular gas from CO emission, an indicator of star formation, of . (A. Edge, private communication) Similarly, Allen (Allen95 (1996)) and Crawford et al. (Crawford95 (1995)) find optical spectra consistent with 100 . Another interpretation of the data would be that a very small fraction () of the cooling region is actually cooling and gas at intermediate temperatures coexists, which accounts the Fe XXIV lines.
4 Discussion
The emission measure of the cooling-flow spectral model has to be artificially cut off at about 2.7 keV. This would be possible if the cooling time was reasonably long compared with the expected age of the cluster. There are three possibilities for this lack of emission. 1. It possible that there is an additional transport mechanism that has tempered the cooling and the becomes a frustrated cooling-flow quickly reheating the cool gas back to the the hot phase. 2. The gas has rapidly cooled below 2.7 keV and we therefore do not see it. 3. The cool gas may exist, but its emission is absorbed by cold material at the center of the flow. It is also important to note that the other XMM-Newton observations of clusters show very similar results suggesting that this is a generic problem in cooling-flow clusters (see Kaastra et al. Kaastra00 (2000), Tamura et al. Tamura00 (2000)). Following, we discuss some possibilites.
Underestimate of the Cooling Function: The presented results depend somewhat on the cooling function assumed below , but the function would have to be underestimated by a factor of at least 10 to explain the results. However, for a gas at =1 keV, we detect primary radiative cooling directly in the X-ray emission lines in our band. From deep observations of coronal sources (Brinkman et al. Brinkman00 (2000)), we know that the emission spectrum is accurately accounted for by the current spectral models, and hence the cooling function does not have a large error. Our results depend, however, on the metals IGM being approximately homogeneously distributed.
Resonant Scattering + Cold Absorption: This would be expected to be important in spectral lines with high oscillator strength where the optical depth, 10 (e.g. 15 Å Fe XVII could be 100). Resonance line photons could then scatter several times within the medium, which would appear to enhance the probability of photoelectric absorption. However, because resonance scattering of a single transition also has the effect of scattering the photon in frequency, the photoelectric absorption probability is not enhanced by a large factor. Empirically, lines with smaller oscillator strength, which are not subject to resonance scattering at all, are not observed (e.g. 17.1 Å). The complex from Fe XXIV contains two medium oscillator strength lines which are still observed.
Differential Cold Absorption: A column of being selectively applied to the gas below 3 keV would explain the observed spectrum. The limit of on the column density being applied to the hot gas, however, would make this a very specific partial covering model. This could be reasonable, since the coolest gas occupies the smallest volume and is likely to be near the coldest material. The data, however, are inconsistent with the entire cooling volume being occupied by cold material. Further studies may help to constrain the mass and location of the cold material as well as the volume fraction of the cooling-flow.
Non-Equilibrium Ionization: This effect would cause most ions to radiate at a lower temperature than is expected from collisional equilibrium models. (Edgar and Chevalier Edgar86 (1986)). The recombination time scale for Fe XVII at is (Arnaud Arnaud92 (1992)). The cooling time, however, is , so this is unlikely to be important.
Evolutionary Effects: The cooling time argument assumes that evolutionary effects are unimportant. A recent cluster merger, for example, would cause an overestimate of the cooling radius. This seems unlikely since we would have to be fortunate enough to see the cooling-flow just beginning. Another possibility is that there is secular mass injection throughout the lifetime of the cluster. This also seems unlikely since the mass of the IGM is larger than the mass of the galaxies themselves.
Non-Isobaric Cooling-Flow: The cooling time estimate is based on the assumption that the gravitational potential can be neglected. The cooling-flow will be non-isobaric if it is flowing into a region of a greater gravitational potential. This could apply if the gravitational potential does significant work on the cool gas (see e.g. Nulsen et al. Nulsen82 (1982), Wise Wise93 (1993)). This would cause an overestimate of the mass deposition rate and adds energy to the gas if the cooling-flow actually flows.
Electron Thermal Conduction: Theoretical calculations have disagreed about how much conduction is supressed by twisted magnetic fields (see e.g. Tao (Tao95 (1995)) and Chandran and Cowley (Chandran98 (1998))) and observationally it appears to be suppressed (Ettori and Fabian Ettori00 (2000)). Electron thermal conduction would have to be suppressed enough to allow for the observed cooling and temperature gradients, but would have to play a role in limiting cooling. Note that cooling works best to balance cooling at higher temperatures.
Magnetic Reconnection: If large scale magnetic fields were present in clusters, they might have the effect of isolating cooling flow regions as well as reconnecting cooling-flow regions with the ambient gas (Soker and Sarazin Soker90 (1990), Norman and Meiksin Norman96 (1996)). This would have the effect of recycling the cool material and delaying the cooling time.
Turbulent Mixing: Begelman and Fabian (Begelman90 (1990)) suggested that turbulent mixing could result in an intermediate temperature layer between the hot gas and the cold condensed cooling-flow byproducts. If this process were highly efficient the cold gas could get recycled into an intermediate phase and the hot gas could be cooled rapidly by turbulent mixing within the cold layer.
Dust Sputtering: Abell 1835 is an IRAS source (Allen Allen00 (2000)). This could imply that the dust is mixing with the cooling-flow and rapidly cooling the gas.
The ideas above are only a sample of the possible mechanisms for the absence of the 1 keV cooling-flow gas and more than one could be important. The observational evidence places strong constraints on cooling flow models and proper simulations of these effects are beyond the scope of this paper. With future XMM-Newton observations using spatially-resolved spectroscopy and or further limits or detections of Fe XVII of many clusters, we expect to be able to distinguish between the alternatives.
5 Conclusion
We describe the spectral-spatial results of the observation of Abell 1835 using the European Photon Imaging Cameras and the Reflection Grating Spectrometers on the XMM-Newton observatory. The observations are consistent with large amounts of cool gas surrounded by a =8.2 keV component outer envelope. We find no evidence for excess uniform cold absorption above the galactic value of . The emission measure of cool gas below =2.7 keV is much lower than expected in simple isobaric cooling flow models, and it indicates either differential cold absorption applied to the cool gas or that a more complicated description of the cooling process is required.
Acknowledgements.
This work is based on observations obtained with XMM-Newton, an ESA science mission with instruments and contributions directly funded by ESA Member States and the USA (NASA).References
- (1) Arnaud, M. et al., 2000, this issue
- (2) Arnaud, M. and J. Raymond, 1992, ApJ 398, 394
- (3) Arnaud, K. A. 1996, A. S. P. Conference Series, Vol. 101, 17
- (4) Allen, S. W. and A. C. Fabian, 1998, Mon. Not. R. Astron. 297, L63-L68
- (5) Allen, S. W., 2000, Mon. Not. R. Astron. Soc. 315, 269.
- (6) Allen, S. W. et al., 1996, Mon. Not. R. Astron. 283, 263-281
- (7) Allen, S. W. , 1995, Mon. Not. R. Astron. 306, 857
- (8) Begelman, M. C. and A. C. Fabian, 1990, Mon. Not. R. Astron. Soc. 244, 26.
- (9) Brinkman et al, 2000, this issue
- (10) Canizares et al., 1979, ApJ 234, L33.
- (11) Canizares et al., 1982, ApJ 262, L32.
- (12) Cavaliere & Fusco-Fermiano, 1976, A&A 49
- (13) Chandran, B. and C. Cowley, 1998, PRL 80, 3077.
- (14) Crawford, C. S. et al. 1995, Mon. Not. R. Astron. 276, 947
- (15) Ettori, S. and A. C. Fabian, 2000, Mon. Not. R. Astron 317, L57.
- (16) den Herder, J.-W. et al. 2000, this issue
- (17) Johnstone, R. M. et al., 1992, Mon. Not. R. Astron. 255, 431-440
- (18) Edgar, R. J. and Chevalier, R. A., ApJ 310, L27.
- (19) Fabian, A. C. et al., 1994, ApJ 436, L63-L68
- (20) Fabian, A. C., Annu. Rev. Astron. Astrophys. 1994, 32, 277.
- (21) Fabian, A. C. et al., 2000, Accepted by Mon Rot R. Astron.
- (22) Jansen, F. et al., 2000, this issue
- (23) Kaastra, J. et al., 2000, this issue
- (24) King, I. R. 1966, AJ 71, 64
- (25) Mewe, R., Kaastra, J., Liedahl, D., 1995, Legacy vol. 6, 16
- (26) Morrison, R. and D. McCammon, 1983, ApJ 270, 119
- (27) Mushotzky, R. & A. Szymkowiak, in Cooling Flows in Clusters of Galaxies, Vol. 229, 53.
- (28) Norman, C. and A. Meiksin, 1996, ApJ 468, 97
- (29) Nulsen, P. E. J., 1982, Mon. Not. R. Astron. 199, 1089.
- (30) Savin, D. et al, 1996, ApJ 470, L73
- (31) Sarazin, C., X-ray Emissions from Clusters of Galaxies, 1988
- (32) Soker, N. and C. Sarazin, 1990, ApJ 348, 73-84.
- (33) Strüder et al., 2000, this issue
- (34) Tamura, T. et al., 2000, this issue.
- (35) Tao, L. 1995, Mon. Not. R. Astron. 275, 965
- (36) Turner, M. et al., 2000, this issue
- (37) Wise, M. and Sarazin, C., 1993, ApJ 415, 58