11email: bol@mpe.mpg.de 22institutetext: X-ray Astronomy Group; Department of Physics and Astronomy; Leicester University; Leicester LE1 7RH; U.K. 33institutetext: Mullard Space Science Laboratory, University College London, Holmbury St. Mary, Dorking, Surrey, RH5 6NT, UK
Detection of an X-ray periodicity in the Narrow-line Seyfert 1 Galaxy Mrk 766 with XMM-Newton††thanks: Based on observations with XMM-Newton, an ESA Science Mission with instruments and contributions directly funded by ESA Member States and the USA (NASA)
We have analyzed the timing properties of the Narrow-line Seyfert 1 galaxy Mrk 766 observed with XMM-Newton during the PV phase. The source intensity changes by a factor of 1.3 over the 29,000 second observation. If the soft excess is modeled by a black body component, as indicated by the EPIC pn data, the luminosity of the black body component scales with its temperature according to . This requires a lower limit ’black body size‘ of about . In addition, we report the detection of a strong periodic signal with . Simulations of light curves with the observed time sequence and phase randomized for a red noise spectrum clearly indicate that the periodicity peak is intrinsic to the distant AGN. Furthermore, its existence is confirmed by the EPIC MOS and RGS data. The spectral fitting results show that the black body temperature and the absorption by neutral hydrogen remain constant during the periodic oscillations. This observational fact tends to rule out models in which the intensity changes are due to hot spots orbiting the central black hole. Precession according to the Bardeen-Petterson effect or instabilities in the inner accretion disk may provide explanations for the periodic signal.
Key Words.:
galaxies: active – galaxies: individual: Mrk 766 – X-rays: galaxies1 Introduction
Mrk 766 is a nearby ( = 0.013) and X-ray bright () Narrow-Line Seyfert 1 galaxy (Walter & Fink 1993, Boller et al. 1996, Leighly et al. 1996, Leighly 1999). Due to the extreme spectral and X-ray properties found in Narrow-Line Seyfert 1 galaxies and due to its extreme X-ray brightness, Mrk 766 was proposed for the PV phase for observations with the X-ray satellite XMM-Newton. The high throughput of XMM-Newton compared to previous X-ray missions allows precise studies of the spectral properties, e.g. the shape of the soft excess and of the transition region between the soft excess and the power-law component. In addition, RGS observations allow to perform X-ray spectroscopy of accretion disk lines (e.g. Ross et al. 1999) as well as emission and absorption features originating from the broad- and narrow-line region. The XMM-Newton spectral properties of Mrk 766 are discussed in detail by Page et al. (2001) and Pounds et al. (2001). The long-period orbit of XMM allows to measure the variability power spectra of ultrasoft Narrow-Line Seyfert 1 galaxies far better than has yet been possible before and allow to constrain nonlinear variability, to search for spectral variability and to search for any quasi-periodic oscillations (e.g. Papadakis & Lawrence 1995 and references therein). In this paper we concentrate on the timing properties of Mrk 766 and present the discovery of an X-ray periodicity in Mrk 766. The object resembles IRAS 183255926 (Iwasawa et al. 1998), where a 58000 second periodicity in the 0.510 keV ASCA energy band was found.

2 The XMM-Newton PV observations on Mrk 766 and data reduction
The Narrow-line Seyfert 1 galaxy Mrk 766 was observed during the performance and calibration phase in revolution 0082 at May 20, 2000. The EPIC pn camera was operated in the small window mode implying a frame read out time of 30 msec so that pile-up is not significant. The full frame mode was used for the EPIC MOS cameras and the RGS cameras were operated in the standard spectroscopy+Q mode. In total 13 exposures were taken with the OM using the UVW1, UVW2 and UVM2 filter. At the beginning of the observations the EPIC cameras were blocked for 20 ksec due to high particle background. At the end of the observations all instruments suffered from data gaps. The exposure time used for the spectral and timing analysis presented in this paper is 29000 seconds. For the data reduction and data analysis the standard SAS software packages were used. The spectral fitting and light curve analysis was performed using XSPEC version 10.00 and XRONOS version 4.0, respectively.
2.1 Detection of a periodicity in the X-ray light curve of Mrk 766
2.1.1 EPIC pn data analysis
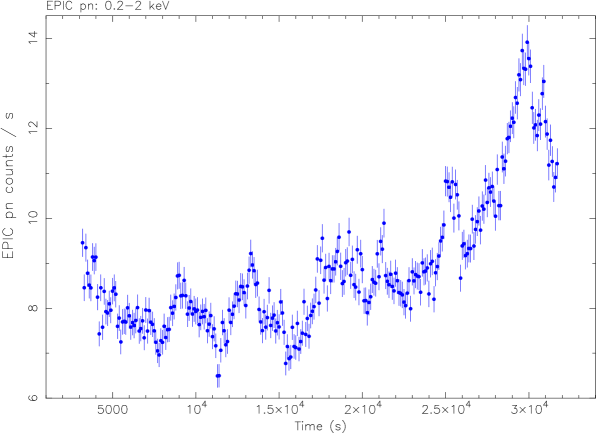
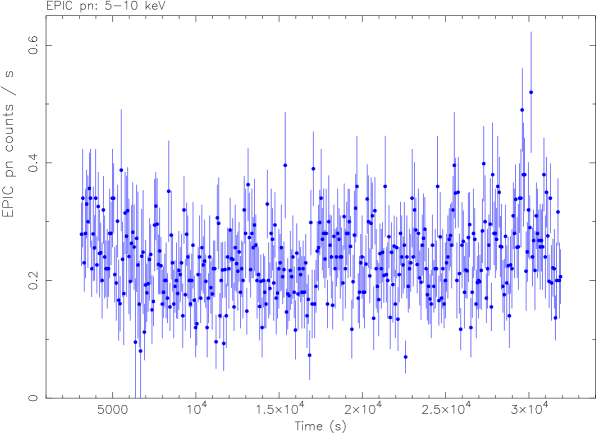
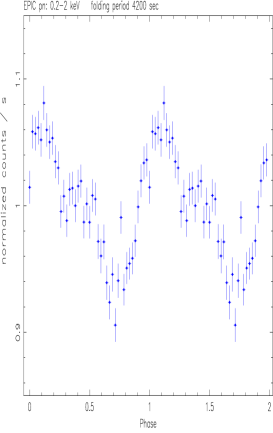
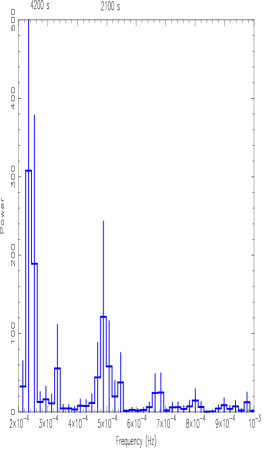
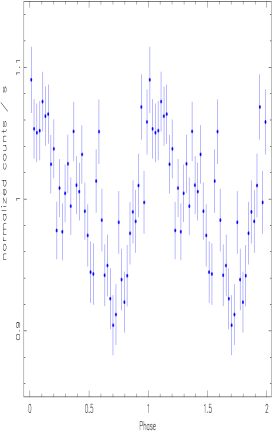
The EPIC pn 0.2–2 keV and 5–10 keV light curves of Mrk 766 are shown in Figure 1. The most striking feature is the presence of a periodic signal in the 0.2–2 keV energy band superimposed on a longer-term count rate increase. Starting at 5000 seconds, the most significant intensity peaks are separated by 4050, 4210, 4210, 3500, 4050 and 4380 seconds. In addition, lower amplitude variations separated by about 2100 seconds are visible (cf. the peak emission at about 27500 and 31000 seconds). The 5–10 keV light curve shows no significant count rate oscillations. We have folded the light curve with different periods, ranging from 1000 and 5000 seconds, and have determined the corresponding value. The best fitting period is found at 4200 seconds (cf. upper panel of Figure 2). The corresponding folded light curve is given in the middle panel of Figure 2. The power spectrum (lower panel) confirms the presence of a strong periodic signal with . The second highest value is found at twice that frequency.
2.1.2 Comparison with EPIC MOS and RGS data
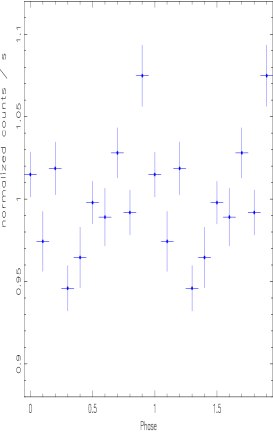
The MOS and RGS data are basically consistent with the EPIC pn results showing a peak near 4200 seconds. In Figure 3 we show the folded light curves for the MOS-1 and RGS-1 detectors. Although the statistical errors are larger in the MOS and RGS data, the period of 4200 seconds is also confirmed by the MOS and RGS data.
2.1.3 Monte-Carlo Simulations on red noise light curves

We made simulations of light curves with the observed time sequence and phase randomized for a red noise power spectrum (cf. Figure 4). The periodic signals detected in the X-ray light curve of Mrk 766 at 4200 and 2100 seconds (cf. lower panel of Figure 2) far exceed the power seen in the simulated power spectrum. Therefore we conclude that the periodicity peaks are not caused by red noise and are intrinsic to the Narrow-Line Seyfert 1 galaxy Mrk 766.
2.2 EPIC pn spectral analysis
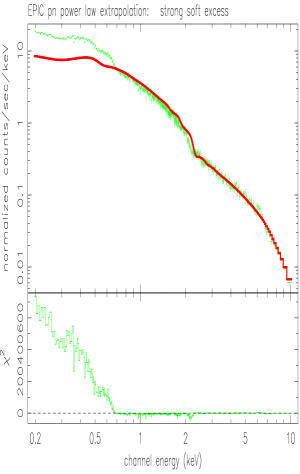
The 0.2–10 keV EPIC pn spectrum of Mrk 766 is well described by a power law model with a photon index of dominating the 1 to 10 keV flux, in combination with a strong soft excess component which dominates the X-ray flux below about 1 keV. In Figure 5 we show the EPIC pn spectrum where the power-law photon index is extrapolated down to 0.2 keV.
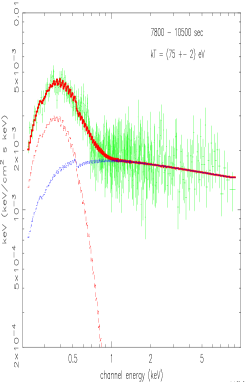
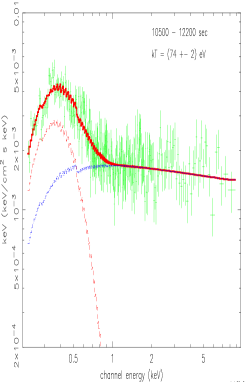
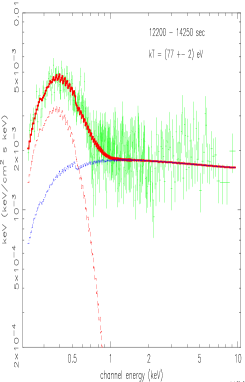
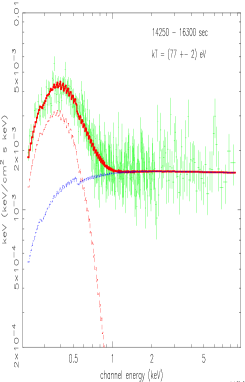
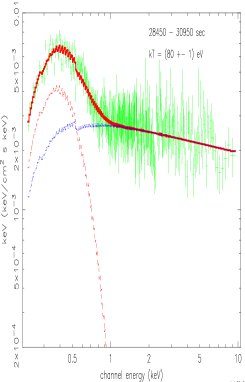
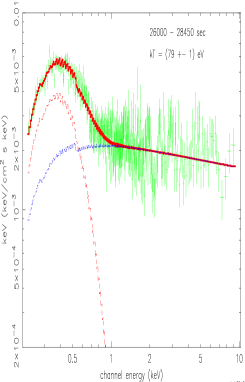
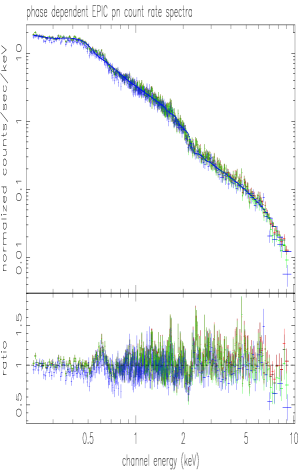
The EPIC pn spectrum clearly indicates the presence of a strong soft excess component superimposed on an underlying power-law component. Between 0.2–0.7 keV the soft excess component contains about 40 per cent more flux than the power law component. The soft excess component is well described by a black body spectrum. Signatures for a strong warm absorber component are not detected in the EPIC pn spectrum. Although spectral residua between about 0.7–0.8 keV seem to be present in the RGS spectrum (Page et al. 2001), these residua cannot explain the spectral kink detected at about 1 keV in the EPIC pn spectrum (cf. Figure 7). We conclude that absorption due to a warm absorber, if present, is small compared to the soft excess emission and is unable to produce the spectral kink at around 1 keV. Therefore a combination of a black body component and an underlying power law is used for the spectral fitting described in the following. In Figure 6 we show EPIC pn count rate spectra selected according to 4 different phase intervals (middle panel of Figure 2). The count rate spectra were obtained from the phase intervals ranging from 00.2 (phase A), 0.20.55 (phase B), 0.550.85 (phase C), and 0.851.0 (phase D), respectively. These phase intervals correspond to different count rate states during the X-ray flux oscillations. The spectral fitting results indicate that the black body temperature remains constant within the errors for the 4 phase intervals. The black body temperature is 76 1 eV (phase A), 76 1 eV (phase B), 75 1 eV (phase C) and 76 1 eV (phase D). The absorption by neutral hydrogen is consistent with the Galactic value of (Dickey and Lockman 1990) for the four phase intervals. In addition, we show in Figure 7 the spectral fitting results for three different time intervals of the X-ray light curve shown in Figure 1. The spectra were selected for the high and low flux states for 3 periodicity peaks centered at 9000, 13200 and 29700 seconds, respectively. We find that the black body temperature remains constant within the errors during the X-ray oscillations for each periodicity peak.
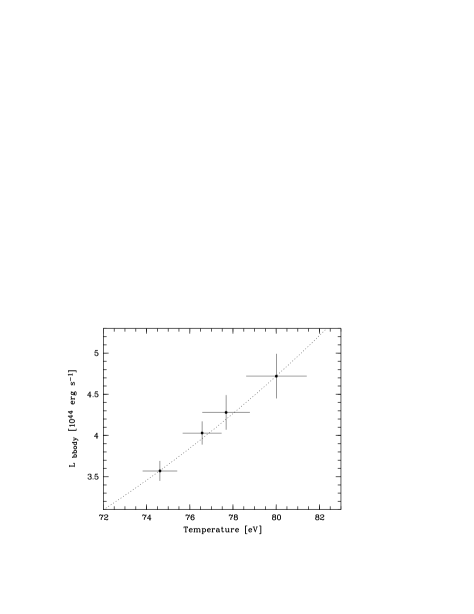
To study the long-term variability we have divided the light curve shown in Figure 1 into 4 different time intervals, ranging from 700017100, 1710024500, 2450028500, and 2850031000 seconds, respectively. For each time interval we have performed the combined power law plus black body fit and have determined the temperature and the bolometric luminosity of the black body component. With Figure 8 we show that the black body temperature increases from 74.6 to 80.1 eV and that bolometric luminosity increases from about to (for and ).
3 Discussion
We first discuss the ’long-term‘ increase observed in the light curve (cf. Figure 1) which is characterized by a correlation between flux and temperature of the soft component. To our knowledge such a behavior has not been found in AGN spectra before. The correlation between the bolometric luminosity and the spectral temperature is close to the law, consistent with a radiating surface remaining constant during the variations. The projected size of the black body radiating disk surface can be estimated using the luminosities and temperatures given in Figure 8. We find that this projected disk size is which is rather a lower limit to the physical size of the emission region, because we have neglected a possible inclination of the disk, gravitational redshift effects and deviations from a black body due to scattering effects. We note that this area estimate requires a black hole mass of at least a few solar masses.
The periodic signal may be a quasi-periodic oscillation (QPO). Investigations of QPOs in galactic binary systems show a wide range of frequencies between about 0.1 and 1200 Hz (Psaltis et al. 1999). However, we note that for the galactic black hole microquasars GRS 1915+105 and GRO 1655-40 narrow frequencies of roughly 50 – 300 Hz have been detected (Morgan et al. 1997, Remillard et al. 1999). The ratio between these QPO frequencies and the strongest peak frequency found in the data of Mrk 766 lies between roughly consistent with the expected mass ratio of these objects. Specifically, QPOs could be produced by instabilities in the inner part of the accretion disk or by pulsating accretion if the rate is close to the Eddington limit. In these cases the period is expected to be of the order of the radial drift time scale (‘instability time scale’)
where 5 to 10 (Sunyaev 2000). We note that is of the order of a few thousand seconds for , and solar masses.
If the periodic signal arises from X-ray hot spots orbiting the black hole (e.g. Sunyaev 1973; Guilbert, Fabian & Rees 1983) we expect a variation in temperature. Using the radius dependent orbital velocity as given by Abramowicz et al. (1996), the boost model of Rybicki & Lightman (1979) and assuming an inclination angle of 45 degrees we find a temperature variation by a factor of about 1.6 and 1.4 at 3 and 4 Schwarzschild radii, respectively. As shown in Figure 7 the black body temperature remains constant within a few percent during the periodic variations requiring an inclination angle of the accretion disk of more than 85 degrees. For 85 degrees the temperature change according to the moving black body field is about a factor of 1.1 at 3 Schwarzschild radii, still inconsistent with the observations. Even for a nearly face-on geometry with an inclination angle of 89 degrees temperature changes by a factor of 1.06 are expected from the hot spot model.
Another possibility is that the observed variability is due to disk precession according to Bardeen and Petterson (1975). This causes the inner disk to settle into the plane of the black hole equator up to the so called transition radius, whereas the outer parts remain in their original orientation. The disk precession takes place in a ring which is in between. Nelson & Papaloizou (2000) found that the transition radius is of the order of about 10 to 30 gravitational radii. Since the precession of the disk is a geometrical effect it does not lead to spectral changes which is consistent with the observations. The absence of significant absorption by neutral gas above the galactic value shows that shadowing by the outer parts of the accretion disk is not responsible for the observed periodicity. The amplitude of the variations of about 7 per cent (see Figure 2) requires a precession angle dependent on the disk inclination according to . For instance, for a disk inclination of 90 (45) degrees the precession angle is 32 (4) degrees. The angular shape of the light curve may reflect the expected disk warp. The second peak at 2100 seconds in the power spectrum and the possible third one at about 3000 seconds may be related to the warp as well. The precessing frequency produced by the Bardeen-Petterson effect depends on the disk radius as
where is the angular momentum of the black hole. The maximum angular momentum of a Kerr black hole is
For the ratio between and we get
Equ. 4 can be used to estimate the lower limit of the black hole mass in Mrk 766: Taking and the black body disk radius of as an rough estimate for , we find that a black hole mass of solar masses is required not to violate the angular momentum limit.
Presently, we are unable to differentiate between a strictly periodic behavior and quasi-periodic oscillations with high precision. We also need better data for the light curve and the power spectrum in order to constrain the models. In this context the forthcoming 150 ksec XMM-Newton observation will be most useful.
4 Summary
During the long-term variations of Mrk 766 the fitted black body temperature and luminosity of the soft component correlates as expected for a black body () requiring a lower limit of the black body disk size of about . In addition, we have detected a strong periodic signal in the black body component with 4200 seconds. This periodicity may be of the QPO type resulting from instabilities in the inner accretion disk around the black hole. X-ray periodicity due to hot spots orbiting the black hole does not provide a plausible explanation, except for the case the disk is observed nearly face on ( 85 degrees). As no significant periodic changes of the black body temperature are detected precession may provide another explanation for the X-ray periodicity of Mrk 766. If the Bardeen-Petterson effect is responsible for the observed periodicity, the required size of the emission region calls for a black hole mass of solar masses.
Acknowledgements.
It is a pleasure to acknowledge the efforts of the SOC and SSC teams in making the observations possible and for developing the SAS software package used to reduce the data. The XMM - Newton project is supported by the Bundesministerium für Bildung und Forschung / Deutsches Zentrum für Luft- und Raumfahrt (BMBF/DLR), the Max-Planck Society and the Heidenhain-Stiftung. We are grateful to the referee, K. Iwasawa, for very useful comments which helped us to improve the paper substantially. We are indebted to B. Aschenbach for fruitful discussions on the scientific content of this paper. TB thanks A.C. Fabian for using his software code on the red noise simulations.References
- (1) Abramowicz, M.A., Belodorodov, A.M., Chen, X. et al., 1996, A&A, 313, 334
- (2) Bardeen, J.M., Petterson, J.A., 1975, ApJL, 195, 65
- (3) Boller, Th., Brandt, W.N., Fink, H., 1996, A&A, 305, 53
- (4) Dickey, J.M., Lockman, F.J., 1990, Ann. Rev. Astron. Astrophys., 28, 215
- (5) Guilbert, P.W., Fabian, A.C., Rees, M.J., 1983, MNRAS, 205, 593
- (6) Iwasawa, K., Fabian, A.C., Brandt, W.N. et al. 1998, MNRAS, 295, 20
- (7) Leighly, K.M., Mushotzky, R.F., Yaqoob, T. et al. 1996, ApJ, 469, 147
- (8) Leighly, K.M., 1999, ApJS, 125 317
- (9) Morgan, E.H., Remillard R.A., Greiner, J., 1997, ApJ, 482, 993
- (10) Natarajan, P., Pringle, J.E., 1998, ApJ, 506, 97
- (11) Nelson, R.P., Papaloizou, J.C.B., 2000, MNRAS, 315, 570
- (12) Page, M.J. et al. 2001, A&A, 365 (this issue)
- (13) Papadakis, I.E., Lawrence, A., 1995, MNRAS, 272, 161
- (14) Pounds, K.A. et al., 2001, in preparation
- (15) Psaltis, D., Belloni, T., van der Klis M., 1999, ApJ, 520, 262
- (16) Rees, M.J., 1978, Nature, 275, 516
- (17) Remillard, R.A., Morgan, E.H., McClintock, J.E. et al. 1999, ApJ, 522, 397
- (18) Ross, R.R., Fabian, A.C., Young, A.J., 1999, MNRAS, 306, 461
- (19) Rybicki, G. B., Lightman, A.P., 1979, Radiative Processes in Astrophysics, John Wiley & Sons
- (20) Sunyaev, R.A., 1973, Soviet Astronomy AJ, 16, 941
- (21) Sunyaev, R.A., 2000, private communication
- (22) Walter, R., Fink, H., 1993, A&A, 274, 105