Radio galaxies at : results from Keck spectropolarimetry
Abstract
In classifying the ensemble of powerful extragalactic radio sources, considerable evidence has accumulated that radio galaxies and quasars are orientation-dependent manifestations of the same parent population: massive spheroidal galaxies containing correspondingly massive black holes. One of the key factors in establishing this unification has been the signature of a hidden quasar detected in some radio galaxies in polarized light. The obscuration of our direct view of the active nucleus usually, but not necessarily exclusively, by a thick nuclear disk or torus can act conveniently as a ‘natural coronograph’ that allows a much clearer view of the host of a radio galaxy than of a quasar.
In this study, we exploit the opportunity to eliminate the quasar glare by performing sensitive spectropolarimetry with the Keck II telescope of a sample of radio galaxies with redshifts around 2.5. This represents the epoch when quasars were many times more common that they are now and is likely to be the period during which their host galaxies were being assembled into what become the most massive galaxies in the Universe today. We show that dust-reflected quasar light generally dominates the restframe ultraviolet continuum of these sources and that a highly clumped scattering medium results in almost grey scattering of the active galactic nucleus photons. The observations, however, do not exclude a substantial star formation rate averaged over a Gyr of evolution. The sub-mm reradiation from the scattering dust is likely to represent only a small fraction () of the total far infrared luminosity. An analysis of the emission lines excited in the interstellar medium of the host galaxy by the hard quasar radiation field reveals evidence of a dramatic chemical evolution within the spheroid during this epoch. Secondary nitrogen production in intermediate mass stars produces a characteristic signature in the Nv/Civ and Nv/Heii line ratios which has been seen previously in the broad line region of quasars at similar redshifts. We find intriguing correlations between the strengths of the Ly and Nv emission lines and the degree of ultraviolet continuum polarization which may represent the dispersal of dust associated with the chemical enrichment of the spheroid.
Key Words.:
Galaxies: evolution; Galaxies: abundances; Galaxies: active; Galaxies: starburst; Polarization; Scattering1 Introduction
Radio galaxies are thought to be the hosts of radio quasars, oriented such that the direct view to their nuclei is obscured by an optically very thick nuclear structure (Antonucci 1993 and references therein). This fortuitous occultation of the active galactic nucleus (AGN), which would otherwise outshine an galaxy by a factor of up to a thousand or so, acts as a convenient ’natural coronograph’, allowing the detailed study of many properties of the surrounding stars and interstellar medium (ISM). Our current belief is that the hosts of powerful radio sources in the distant Universe are destined to become the giant ellipticals of today: the most massive galactic systems we know (McLure et al. 1999). While some may have commenced their formation at very high redshift, it is clear that the process of assembly is very active at (Pentericci et al. 1999, 2000 ; van Breugel et al. 1998). This corresponds to the epoch when luminous quasars appear to have had their maximum space density (see eg. Pei 1995; Shaver et al. 1996; Fan et al. 2000). Indeed, a major goal of our programme is to understand any causal relationship between the formation of the massive black hole and that of the galaxy within which it resides.
Although we may not see it directly, the presence of the huge luminosity radiated by the quasar makes itself felt in many ways in the surrounding galaxy and understanding those processes is essential if we are to deduce the basic properties and evolutionary state of the host. The radiation field ionizes a substantial fraction of the gaseous interstellar medium (ISM), producing emission line halos extending sometimes hundreds of kpc (van Ojik et al. 1997a) and both destroys and accelerates dust (de Young 1998). The ultraviolet (UV) and optical components of the quasar continuum and broad emission lines can now, thanks to large telescope polarimetry, be seen scattered from dust and/or electrons far from the nucleus (see eg. di Serego Alighieri et al. 1996a; Dey et al. 1996; Knopp and Chambers 1997b; Cimatti et al. 1998b). Both of these reprocessing mechanisms, fluorescence and scattering, contribute to the alignment between the observed optical and radio structures seen in radio galaxies beyond a redshift of 0.7 or so (Chambers et al. 1987; McCarthy et al. 1987). Although at optical wavelengths the effects of scattering are seen most clearly at higher redshifts, where the dilution by starlight below the 4000 Å break is small, the process can be seen to operate in low redshift radio galaxies when they are observed with large telescopes (Cohen et al. 1999).
Above 4000 Å in the restframe, the evolved stellar population contributes substantially to the observed continuum and produces an infrared (K-band) Hubble diagram with a remarkably small dispersion (McCarthy 1993, but see references for the higher redshift sources, eg. Eales et al. 1997; van Breugel et al. 1998). Below 4000 Å, we might expect to see directly a young stellar population in a starburst arising as a precursor to the AGN or, alternatively, as a result of its influence on the surrounding medium. Objects with a redshift around give optical spectrographs access to the restframe spectral band which includes the strong UV emission lines from Ly through Ciii] and beyond and also to that part of the continuum which displays detectable spectral features from OB stars as well as absorption lines from the ISM. In addition, the spectrum covers the region where Galactic-type dust displays the 2200 Å signature and the steep extinction increase below 1600 Å.
Our programme of Keck observations of radio galaxies is designed to obtain high quality spectrophotometry of the spectral features mentioned above together with polarimetry having sufficient signal-to-noise to detect a continuum polarization as low as one or two percent. The polarimetry is used to separate the directly received light from the scattered radiation while the low-noise line and continuum spectroscopy can be used to study many properties of the host galaxy, especially the physical and dynamical state and the chemical composition of the ISM. Data from the first two sources observed, 4C23.56 and 4C00.54, are presented in Cimatti et al. Cimatti et al. (1998a) (hereafter paper I). Here, we report the extension of the sample to nine sources. In this paper, the analysis is restricted to the integrated properties defined by the continuum extent. An analysis of the spatial variations will come in a later publication (Villar-Martín et al. in prep.). Throughout this paper we assume km s-1 Mpc-1 and .
2 Observations and data reduction
| Object | z | Exp. (s) | P.A.(°) | Run | |
|---|---|---|---|---|---|
| IAU | 4C | ||||
| (1) | (2) | (3) | (4) | (5) | (6) |
| 1243036 | 4C03.24 | 3.560 | 17200 | 156 | c |
| 0943242 | - | 2.922 | 13800 | 73 | b |
| 0828193 | - | 2.572 | 18000 | 44 | b |
| 2105233 | 4C23.56 | 2.479 | 22266 | 47 | a |
| 0731438 | 4C43.15 | 2.429 | 22720 | 12 | b |
| 1410001 | 4C00.54 | 2.360 | 16240 | 134 | a |
| 1931480 | 4C48.48 | 2.343 | 12000 | 50 | c |
| 0211122 | - | 2.340 | 28580 | 104 | b |
| 1809407 | 4C40.36 | 2.265 | 10742 | 82 | c |
The list of objects and the journal of observations are given in table 1. All sources were selected from the ultra-steep spectrum (USS) radio galaxy survey (see eg. Röttgering et al. 1995b) with redshift greater than 2.2 in order to observe the Ly line. While the statistical properties of this subset cannot be defined with precision, it is effectively unbiased with respect to both radio flux and optical magnitude for the identified sources (Carilli et al. 1997). The R magnitudes range from 21 to 23 (see table 2, column 8). The source 4C03.24, which has a redshift of 3.6, was originally included as an attempt to investigate the dependence of properties on epoch but, due to the faintness of many of the more distant objects, it was subsequently decided to restrict the sample to .
Observations were made using the Low Resolution Imaging Spectrometer (LRIS, Oke et al. 1995) with its polarimeter (Goodrich et al. 1995b) at the Keck II 10m telescope from July 1997 to May 1998 under subarcsecond seeing conditions (seeing ranging from 0.5″ to 1″). The LRIS detector is a Tek 20482 CCD with 24 pixels which correspond to a scale of 0.214″pixel-1. We used a 300 line mm-1 grating and 1″ wide slit which provide a dispersion of 2.4 Å pixel-1 and an effective resolution of 10 Å FWHM. The spectral range is Å. Observations of each object were divided into several sets (between 2 and 5) of 4 exposures of approximately 30 minutes with half-wave plate position angle set successively to 0°, 45°, 22.5° and 67.5°. The slit was always oriented along the radio axis (Röttgering et al. 1994, Carilli et al. 1997a).
After debiasing and flatfielding, 2D-spectra were rectified for geometrical distortion and wavelength calibrated using Hg-Kr arc lamp spectra. Spectra were cleaned for cosmic rays hits and then extracted in apertures given in table 2 in order to include all the extended continuum flux. After performing a precise wavelength registration of all eight spectra in each set (ordinary and extraordinary rays for each half-wave plate orientation) using night-sky emission lines to determine final wavelength zero-points, data were binned and then combined as described in Cohen et al. (1995, appendix A) to form I, Q and U Stokes parameters. Unbiased values for the fractional polarization were estimated with the best estimator given by Simmons and Stewart Simmons and Stewart (1985). Statistical confidence intervals on fractional polarization and polarization angle were determined using a Monte-Carlo method taking into account the background polarization and the detector noise (details of the method in Vernet 2000). Polarized (VICyg12, BD+332642) and unpolarized (HZ44, BD+284211) standard stars were observed in order to check and calibrate the polarimeter. Flux calibration was done with the spectrophotometric standard stars: GD248, G191-B2B, Feige 22, Feige 66, Feige 67. Since several nights were not photometric, the spectra have been scaled to published HST magnitudes when available (Pentericci et al. 1999 , see column 8 in table 2) without any aperture correction. Spectra were corrected for Galactic extinction using Burstein et al.Burstein and Heiles (1982) maps and adopting the extinction curve of Cardelli et al. Cardelli et al. (1989).
A composite spectrum of all nine radio galaxies was also computed. The result is shown in fig. 5. We first normalized the spectra in a line free region between 2000 and 2100 Å and then combined them using a simple average.
3 Results


3.1 The continuum
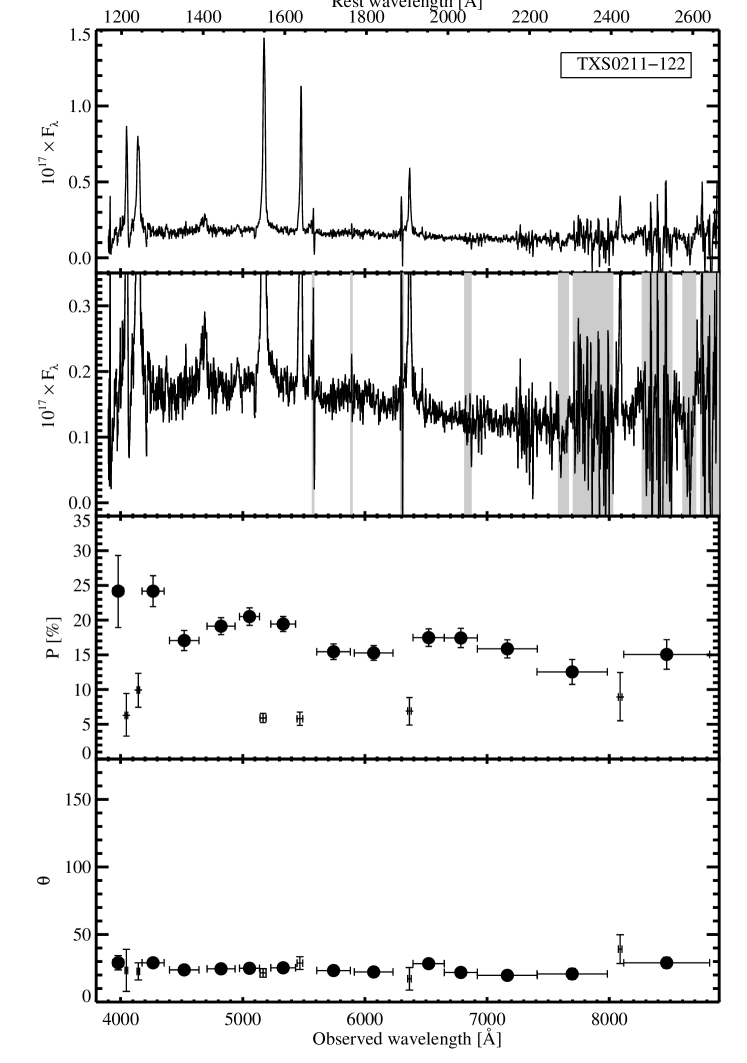
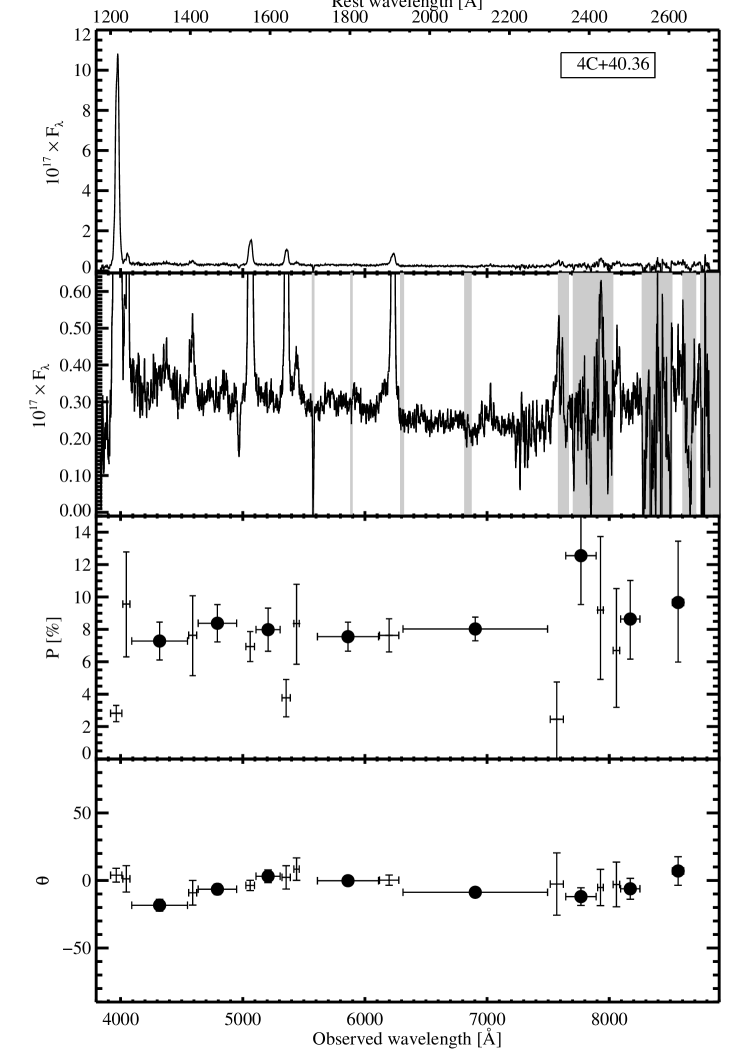
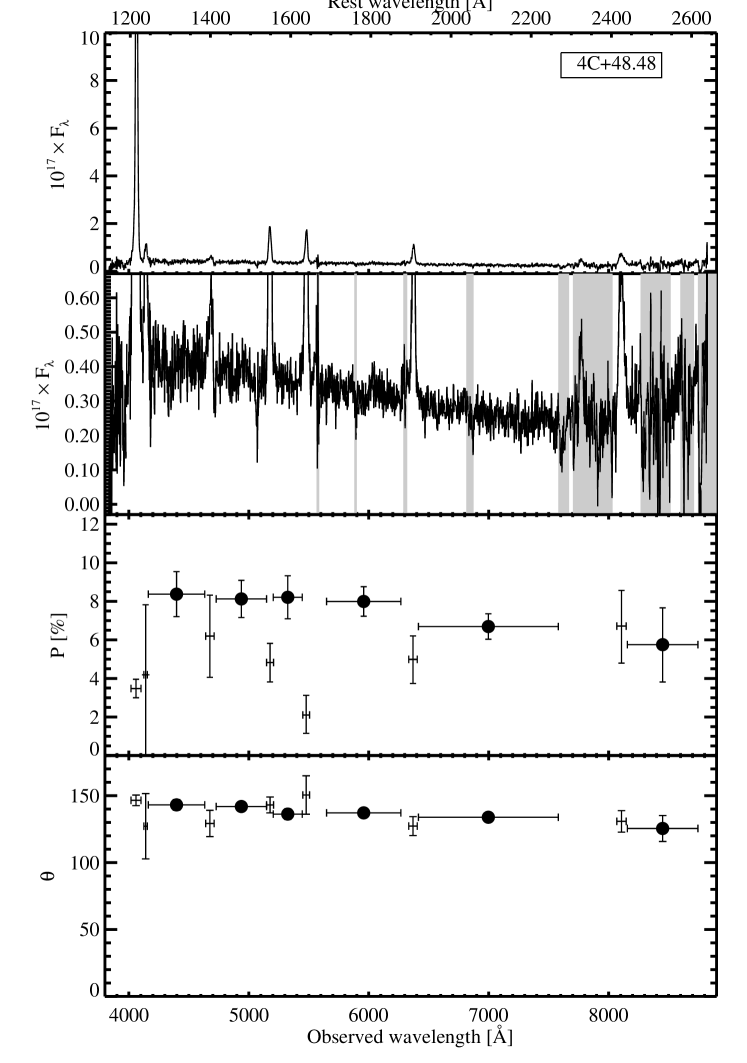
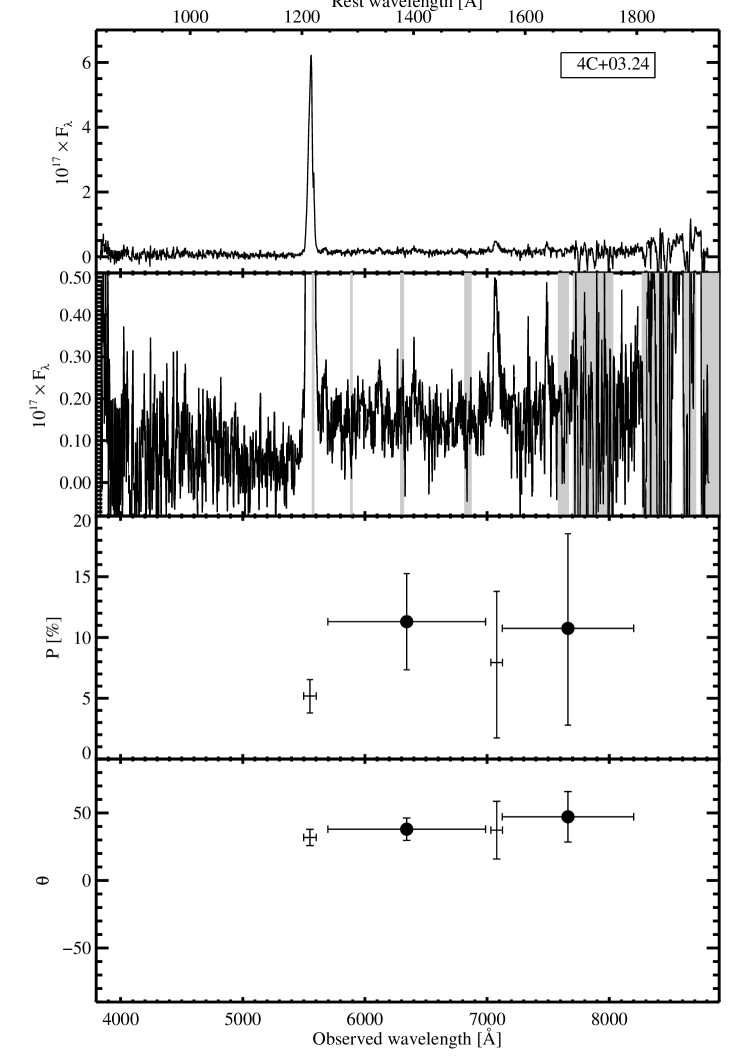
The spectropolarimetry results are presented in fig. 1. On each panel is displayed, from top to bottom: the total flux spectrum at two different scales, the fractional polarization and the position angle of the electric vector. The main results are summarized in table 2. The aperture used for the extraction matches the continuum spatial extent (table 2, column 2). The continuum is clearly resolved in all objects extending from 4″ up to 8″ which corresponds to a linear scale at of 45 to 90 kpc. It shows a variety of morphologies such as double narrow sources (4C23.56), very extended emission (4C48.48) and single peaked sources (0943242). This paper does not discuss further the spatial structures but concentrates solely on the properties integrated over the regions where the continuum is detected.
The first important result is that all high reshift radio galaxies (HzRGs) in this sample except 0731438 show high continuum fractional polarization ranging from 6% up to 20% measured in a large bin just longward of Ly (see table 2, column 3). This window, between Nv and the Oiv]/Siiv blend ( Å in the restframe), contains several weak, low ionization absorption lines but is the broadest gap between strong emission lines in a region of the spectrum where the instrumental sensitivity is high for all sources. For 0211122 and 0943242, we clearly see a rise of the continuum polarization toward the blue. In 0211122, the fractional polarization rises from % shortward of Ciii] to % longward of Ly and for 0943242 it rises from % to % berween the same rest wavelengths (note here that error bars are symetric because data were binned in order to reach signal-to-noise ). A similar trend is also seen in 4C23.56 and marginally in 4C00.54 (see paper I). The signal-to-noise of the polarization measurements is generally not high enough to detect any significant variation of fractional polarization with wavelength in other galaxies in our sample. For 0731438, we can only give an upper limit of about 2.4% at the level to the fractional polarization just longward of the Ly line. However, a significant polarization is measured at longer wavelength (% shortward of Ciii]).
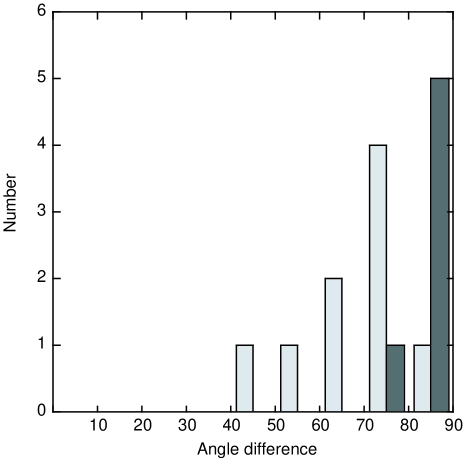
The position angle (PA) of the electric vector (PApol, table 2, column 4) is generally constant with wavelength within the measurement errors. We show in fig. 2 the difference between the radio axis position angle (PArad) and the polarization angle (PA of the E-vector, light) and the difference between the UV extension position angle (PAUV) and the polarization angle (dark). Averaging over the nine sources in our sample we find PAPA°. For the 6 sources for which we have PAUV measurements the average PAPApol is 84°. This is consistent with the PA of the electric vector being generally perpendicular to the UV continuum extension but less closely correlated to the large-scale radio structure (this effect was already noted by di Serego Alighieri et al. 1993, Cimatti et al. 1993,1994 and Hines & Wills 1993).
| Object | Ap.(″) | (%) | PApol(°) | PAUV(°) | log(L1500) | R Mag. | HST Mag. | |
|---|---|---|---|---|---|---|---|---|
| (1) | (2) | (3) | (4) | (5) | (6) | (7) | (8) | (9) |
| 4C+03.24 | 7.1 | 11.33.9 | 38.08.3 | 132 | - | 42.20 | 22.5 | 23.2 (F702W) |
| 0943242 | 4.1 | 6.60.9 | 149.73.9 | 67 | -0.84 | 42.11 | 22.3 | 22.6 (F702W) |
| 0828193 | 4.1 | 10.11.0 | 121.63.4 | 38 | -1.59 | 42.22 | 22.7 | 22.2 (F675W) |
| 4C+23.56a | 4.9 | 15.32.0 | 178.63.6 | 90 | -0.94 | 41.82 | 23.2 | |
| 0731438 | 7.7 | 1.48 (2.4) | 129.819 | - | -1.43 | 41.80 | 23.0 | |
| 4C00.54 | 4.1 | 11.72.7 | 83.64.1 | 6 | -0.88 | 41.75 | 22.6 | 22.9 (F606W) |
| 4C+48.48 | 6.2 | 8.371.5 | 143.13.9 | - | -0.74 | 41.96 | 22.1 | |
| 0211122 | 4.1 | 19.31.15 | 25.01.8 | 122 | -0.93 | 41.68 | 22.7 | 22.9 (F606W) |
| 4C+40.36 | 4.7 | 7.301.2 | 161.64.4 | - | -0.89 | 41.86 | 22.4 |
One very striking result is that all objects in this sample show a remarkably similar continuum shape with a dip around 2200 Å and a shallow peak in between Ly and 1500 Å. This similarity of shape and in particular the 2200 Å dip cannot be an artifact of the response calibration since objects in the sample cover a relatively large range in redshift. For instance, 0943242 at () does not show any dip between observed wavelength 7000 Å and 8000 Å. Although spectra are quite noisy at long wavelength, the continuum rise at Å is well detected using just regions between strong sky lines (see in between shaded areas showing region of strong sky emission in fig. 1). The decrease below 1500 Å is also a real continuum feature since it starts before the onset of the Lyman forest absorption below Ly. Continuum slopes between 1500 Å and 2000 Å are listed in table 2, column 6.
3.2 Emission lines
Fluxes of all detected emission lines are given in table 6. The quality of the data allow us to detect a number of weak emission lines such as Siii1309, Niv]1488 and Niii]1750. The spatial extent of strong emission line halos (Ly, Nv, Civ and Heii) ranges from about 45 kpc in 0943242 up to more than 100 kpc in 0211122 and 0828193 (see also van Ojik et al. 1996). These strong emission lines are usually more extended than the aperture used for the extraction and show very complex spatial and velocity structure with high velocity amplitudes up to 2000 km s-1. Narrow emission lines have typical width of 8001500 km s-1 as measured on the Heii1640 line (see table 3) which is less affected by possible underlying broad emission (since it is usually very weak in quasars) or absorption. Broad lines are clearly detected in 0211122 (broad Civ FWHM km s -1, Å and broad Ciii] FWHM km s-1, Å) and 4C23.56 (broad Civ FWHM km s-1, Å and broad Ciii] FWHM km s-1, Å). Broad wings are also marginally detected in 4C40.36 and 4C00.54.
Since narrow emission line profiles can be quite poorly represented by gaussians due to the presence of several kinematic components, we did not attempt to perform gaussian fitting. Fluxes were measured from simple line integrals. The main source of error in these measurements comes from uncertain continuum determination. We estimated the uncertainty by making limiting high and low estimates of the continuum level. This method does not provide rigorously defined measurement errors but does give a conservative estimate of the range in flux allowed by the data for each emission line.
One particular issue in measuring narrow emission line fluxes is the contamination by broad components, especially for the Ly, Nv, Civ and Ciii] lines. In the two cases where broad lines are most prominent, (4C+23.56 and 0211122) and most likely to significantly affect our results, we made measurements of the narrow emission lines using several different strategies including multiple-gaussian fitting, integration from an elevated continuum and measurement after subtraction of a scaled quasar template. The small dispersion in the resulting values is included in our conservative estimate of the uncertainties.
We also measured the polarization of the strongest narrow emission lines including the underlying continuum (see bins marked with crosses in fig. 1). They show, in general, a significantly lower polarization than neighbouring pure continuum bins. In all cases the continuum subtracted polarization in the narrow Ly line is less than 2%.
| Source | FWHM | ||
|---|---|---|---|
| (Å) | (Å) | () | |
| 4C03.24 | 29 11 | 19.6 | 784 |
| 0943242 | 216 20 | 22.4 | 1042 |
| 0828193 | 243 12 | 26.7 | 1366 |
| 4C23.56a | 69 9 | 14.3 | 749 |
| 0731+438 | 152 9 | 10.5 | 560 |
| 4C00.54 | 109 9 | 14.5 | 788 |
| 4C48.48 | 97 13 | 16.9 | 922 |
| 0211122 | 84 4 | 11.4 | 626 |
| 4C40.36 | 74 10 | 29.6 | 1655 |
3.3 Absorption lines

Spectra generally show several absorption features that can be identified as low ionization zero-volt or excited fine-structure interstellar lines such as Siii1260,1265, Oi1302,1305 and Siii 1304,1309, Cii1334,1336, Siii1527,1533. There is a weak tendency for high polarization objects to show these lines in emission and low polarization objects to show them in absorption. Equivalent width measurements and identifications of these features are given in table 7. Fig. 3 illustrates the complex behavior of these lines with the two extreme cases observed in our sample. While low ionization lines are only seen in absorption in 4C23.56 (bottom spectrum in fig. 3), these lines only show up in emission in 0943242 (top spectrum in fig. 3).
In the case of 0731438 and 4C00.54 (see paper I), an absorption is detected close to the expected position of the Ciii1426,1428 photospheric line but we consider this identification as very uncertain since no other absorption lines compatible with pure photospheric lines are detected. See sect. 4.1.3 for a more detailed discussion on photospheric absorption lines.
3.4 Notes on individual objects
-
•
0828193: this radio galaxy was thought to have two subcomponents separated by 3″ (OI1 to the SE and OI2 to the NW, see Knopp and Chambers 1997). Our deep spectrum reveals that OI1 is in fact a M5V type star. The 3 upper limit to the polarization of this star between 5600 and 8300 Å is 0.85 %.
-
•
4C40.36: Chambers et al. (1996b) note that there is a small extension 2″ to the southeast of the eastern lobe which is detected in all bands and has very similar colours to 4C40.36. They identify it as a good candidate for a companion or a subcomponent (see their fig. 7). This is in fact a foreground Hii galaxy at . The spectrum is displayed in fig. 4a with an overlay of the Hii galaxy NGC 6052 from Schmitt et al. (1997).
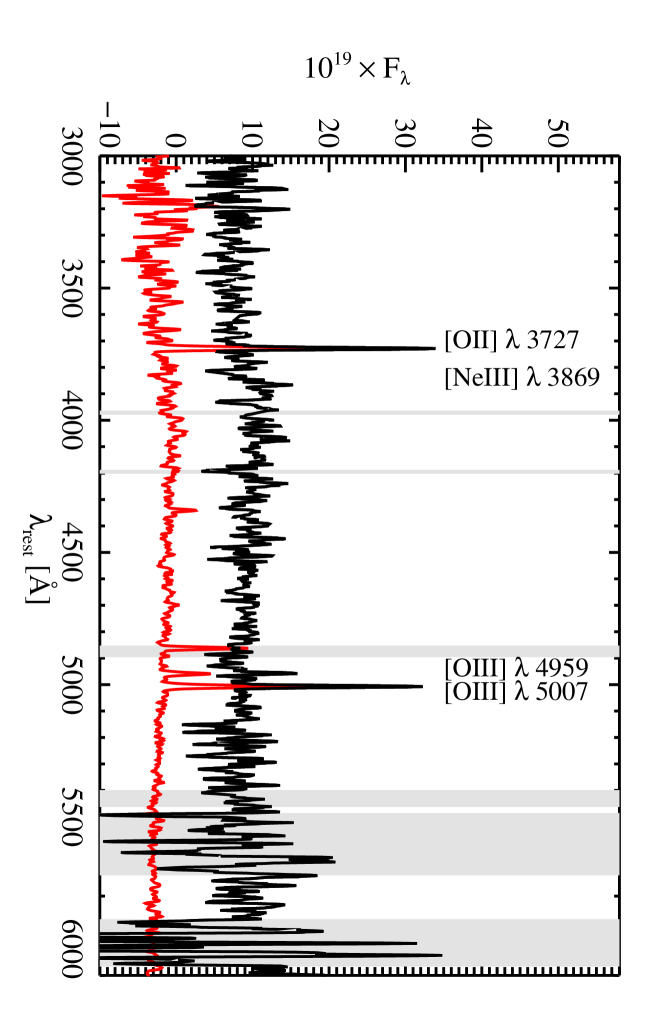
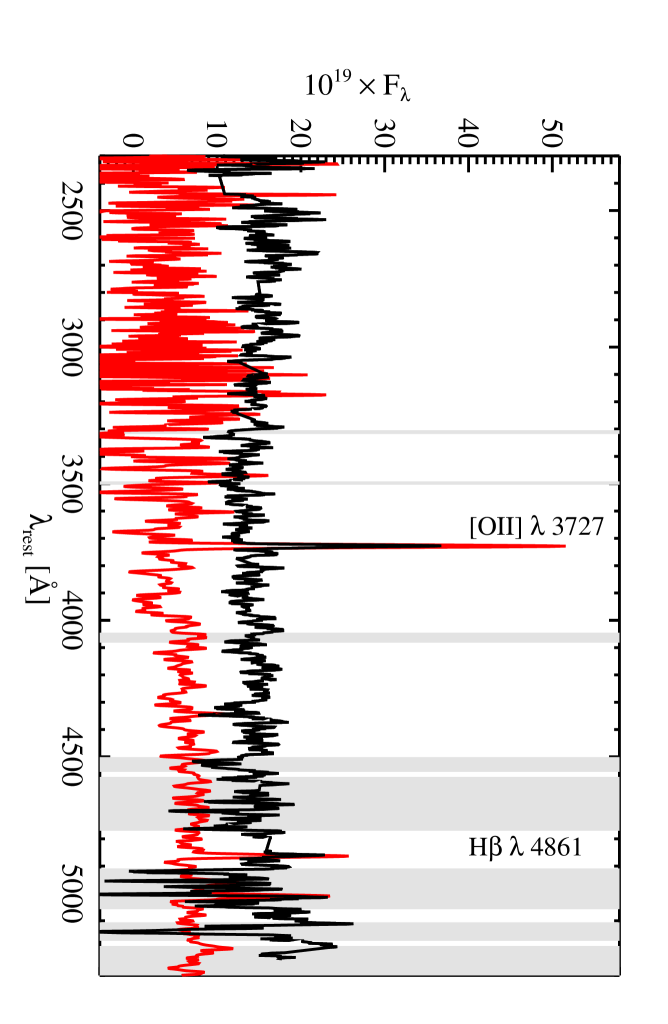
Figure 4: Spectrum of intervening galaxies (upper spectrum). left : Hii galaxy 2 ″ southwest of 4C40.36 with template galaxy NGC 6052 overlayed; right : Hii galaxy 2.5 ″ southwest of 4C48.48 with template galaxy NGC 6764 reddened with EB-V=0.1 The main emission lines are labeled. In both cases, spectra have been cleaned of residual extended emission lines from the radio galaxy and smoothed with a 5 pixel boxcar. Template galaxies were obtained from Schmitt et al. (1997) and have been shifted downward by 10 flux units for clarity. Shaded areas show regions of strong sky emission. -
•
4C+48.48: we find an emission line object 2.5 ″ to the southeast of 4C+48.48 that has a significantly redder continuum than the radio galaxy. The measured polarization between 5600 and 8000 Å is compatible with 0% with a 3 upper limit of 4.5%. A strong emission line is clearly detected at 6277.5 Å. We also identify another weaker emission line at 8184.7 Å. These lines do not correspond to any expected strong emission at the redshift of the radio galaxy. Identifying these lines as [Oii] and Hβ, this intervening object can be classified as an Hii galaxy at . The spectrum is displayed in fig. 4b with an overlay of the Hii galaxy NGC 6764 from Schmitt et al. (1997).
Note that, due to the presence of intervening objects along the line of sight, observed properties of 4C40.36 and 4C48.48 might be significantly affected by lensing.
3.5 Additional data
We also collected information on three high redshift sources that have comparable quality spectropolarimetry data from the literature: two radio galaxies (4C41.17 and 3C 256) and the ultraluminous infrared galaxy FSC 102144724. The main properties of these objects that are used in the discussion are given in table 4.
Six sources in our sample have been observed with HST/WFPC2. These data are published in Pentericci et al. Pentericci et al. (1999). They were mainly used in this work to compare the polarization angle to the direction of the extended ultraviolet emission (see table 2) and to obtain an absolute flux calibration of our spectra.
| Object | (%) | Ly/Civ | Nv/Civ | Heii/Civ | ||
|---|---|---|---|---|---|---|
| FSC 102144724 | 2.282 | 262 | 0.2760.003 | 0.7360.001 | 0.4960.001 | |
| 4C41.17 | 3.798 | 2.4 (2) | -1.8 | 11.10.7 | 0.290.03 | 0.420.02 |
| 3C 256 | 1.824 | 10.90.9 | -0.71 | 10.40.2 | 0.270.17 | 1.050.02 |
4 Discussion
The discussion is based on the integrated properties of the sources. The spatial properties and kinematic details are addressed in a separate paper (Villar-Martín et al. in prep.). The aim is to identify the origins of the various radiated continuum and line components using polarimetry as a powerful discriminent between direct and scattered radiation.
4.1 The nature of the continuum
The question we address in this section is the origin of HzRG ultraviolet continuum: what is the dominant source of UV continuum and what is the relative contribution of the different possible components? The high fractional polarization together with the presence of broad lines clearly suggest that scattering of the radiation from the central active nucleus plays an important rôle, and probably a dominant one in the most polarized objects. The universality of the shape of the spectral energy distribution is difficult to reconcile with the dominance of a young stellar population in this wavelength range since starbursts show strong colour evolution and a range of reddening. However, there is evidence, mainly from the less strongly polarized objects, that a young stellar population can make a significant contribution to the UV continuum.
4.1.1 The scattered continuum
The high continuum polarization shows that a large fraction of the UV continuum must be due to scattered AGN light in all objects in our sample except possibly for the least polarized source (0731438). This case is strengthened by the clear detection of broad lines in the most polarized objects (0211122, 4C+23.56) with equivalent widths which are similar to those seen in quasars.
The remarkable similarity of the shape of the HzRG ultraviolet spectral energy distribution (SED) with that of quasars shows that the scattering process must be approximately independent of wavelength. The most natural explanation for such ‘grey’ reprocessing is that the dominant mechanism is Thompson scattering by electrons. However, this interpretation encounters several difficulties. Scattering by a population of hot () electrons is ruled out because the Doppler broadening would smear out the scattered broad lines. In the two objects in our sample for which we can easily measure the width of the scattered broad Civ line we can estimate an upper limit on of (see Miller, Goodrich and Mathews 1991 and Cimatti et al. 1996) assuming a typical value of km s-1 for the width of the Civ line of a radio loud quasar (as measured on Cristiani and Vio 1990 radio loud quasar composite spectrum). In addition, estimates of the expected X-ray fluxes for such a population of hot electrons in distant 3CR radio galaxies are in strong disagreement with observations (see for instance calculations made by Dey et al. 1996 for 3C 256). Scattering by a cooler () population of electrons as the dominant mechanism is more difficult to rule out. The most compelling argument is based on the far greater scattering efficiency per unit mass of dust than electrons which implies that, as soon as some dust is present in the ISM, it will dominate the scattering process, an assumption we maintain throughout the rest of this discussion.
Standard homogeneous optically thin dust scattering models predict a bluening of the emergent spectrum due to the wavelength dependence of the scattering efficiency of small dust grains. In order to reproduce observations, previous modeling has been based on optically thin scattering followed by arbitrary extinction by a screen of dust. The implicit assumption is that some part of the dusty medium is illuminated by the quasar and scatters light to the observer while another part is in the ‘shadow’ and produces extinction of the scattered light (see Manzini and di Serego Alighieri 1996). A more realistic model employs the same population of dust grains to scatter and absorb the light whereupon the emergent scattered light is maximized where a photon experiences scattering and extinction optical depths close to unity ( ). If the medium is inhomogeneous (clumpy), a natural luminosity weighting process operates by which the emergent flux over a wide range of wavelength comes from paths with optical depth close to one. The scattered spectrum is then approximately the input spectrum multiplied by the dust albedo (the ratio of the scattering to the extinction efficiency) which, for Galactic dust is almost grey at ultraviolet and optical wavelengths.
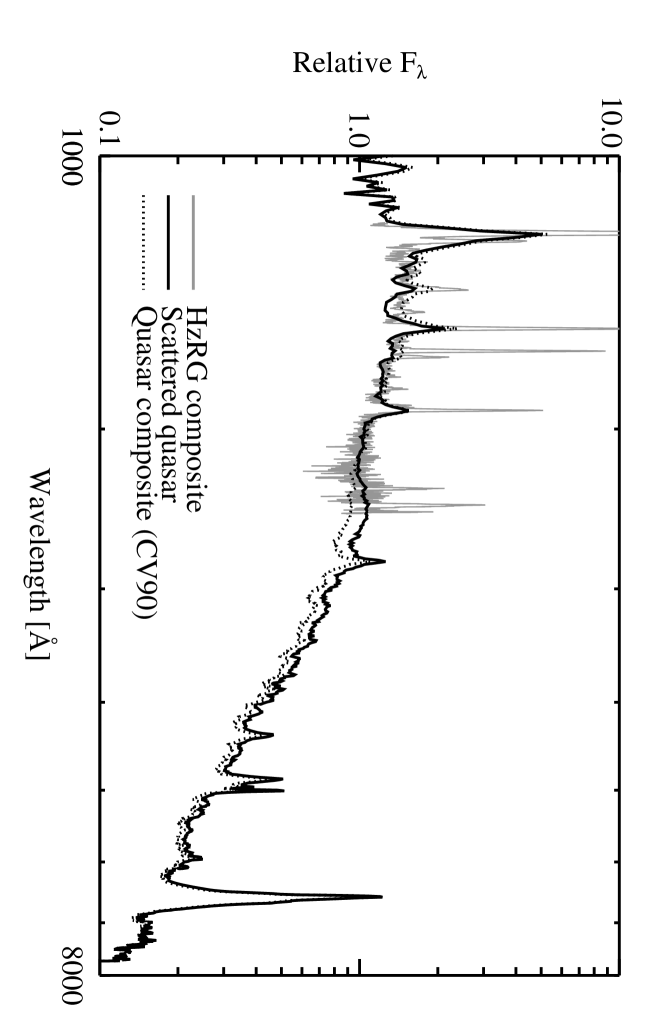
Radiative transfer in a clumpy dusty medium has been extensively studied (see eg. Witt and Gordon 1996,1999; Városi and Dwek 1999 and references therein) and applied to several types of astrophysical objects such as circumstellar shells and starforming galaxies. The expected greyness of the scattering over a large wavelength range described above is confirmed by all studies. We compared our observations to results obtained using the analytical model developed and tested against Monte-Carlo simulations by Városi and Dwek Városi and Dwek (1999). These analytical approximations, based on an extension of the mega-grain model of a two-phase medium first proposed by Hobson and Padman Hobson and Padman (1993) allowed us to easily explore the main parameters describing the clumpy medium: the clump volume filling factor and the ratio of the cloud to inter-cloud medium density (see Városi and Dwek 1999 for details). In our simulations, we used a 40 kpc diameter spherical two-phase dusty medium illuminated by a quasar central source with spectrum from the Cristiani and Vio Cristiani and Vio (1990) quasar composite. The adopted total dust mass is typical of dust masses inferred from submillimeter observations (Best et al. 1998a, Cimatti et al. 1998a, Archibald et al. 2000) and we used the standard Galactic dust model by Mathis, Rumpl and Nordsiek Mathis et al. (1977). The result is displayed in fig. 5 where the HzRG composite spectrum (grey line) is compared to the scattered quasar (black continuous line). This provides a remarkably good fit to both continuum and broad lines. We also plotted the original quasar composite (dotted black line) as a reference to illustrate the approximate greyness of the scattering.
The best results were obtained for models with high clump to inter-clump medium density contrast () and low clump volume filling factor (). The reason for this is that in order to have grey scattering, high density clumps in an extended low density inter-clump medium are required. In this regime radiative transfer is dominated by the dense clumps. Additionally, this ensures that the direct view to the quasar is usually relatively unobscured, consistent with the scarcity of highly reddened radio loud quasars (see eg, Simpson and Rawlings 2000). However it is interesting to note that this scenario also predicts that there must be cases where our line of sight to the quasar intercepts one of these high density clumps, in which case the direct view to the quasar would be completely blocked. Scattered light would then dominate the flux in the UV-optical, resulting in a type 1 object masquerading as a radio galaxy.
The main features of the continuum shape — the dip around 2200 Å and the rollover below 1500 Å— are well reproduced by this model (see fig. 5). It is difficult, however, to use these observations to reliably constrain the dust properties since the scattered spectrum is sensitive only to the difference in wavelength dependence of the scattering and absorption cross-sections. In particular the possible detection of the 2200 Å dust feature is difficult to confirm because it overlaps with the UV Feii blends often present in quasar spectra above 2300 Å (the so-called small blue bump). In addition, the signal-to-noise ratio in this region of the spectrum is rather low due to strong sky lines (shaded areas on fig. 1). The strength of these Feiis blends in quasar spectra varies significantly from object to object and its origin is still poorly understood. It seems, nevertheless, difficult to ascribe the observed feature to Feii blends alone since it would require this blend to be unusually strong in the spectrum of the hosted quasar in all sources, as strong as that observed in ultra-strong Feii emitters like quasar 22263905 (Graham et al. 1996). In consequence, the feature we observe around 2200 Å is probably a combination of the 2200 Å dust feature and UV Feii blends above 2300 Å.
Although inhomogeneous radiative transfer models considering anisotropic central sources are not yet available, we can check that the predicted scattered fluxes are consistent with our observations. The model described above predicts that the fraction of scattered light in a spherical medium is of the of order of 7% of the input flux from the central source between 1000 and 3000 Å. This value is consistent with the Witt and Gordon Witt and Gordon (1999) “clumpy shell” model predictions (their model). Assuming an average half opening angle of 45° for the obscuring torus, we then estimate that about 2% of the central AGN flux is scattered by the ISM of a radio galaxy. The R magnitudes of the objects in our sample range between 21 and 23 and the inferred magnitude of the central source is therefore between 17 and 19, consistent with observed bright quasar magnitudes at .
The spatially-integrated level of continuum polarization is determined by two processes: the geometrical dilution — which is the result of averaging over the possible scattering angles within the ionization cones — and dilution by sources of unpolarized radiation. The appropriate biconical geometry in the framework of the unified scheme has been studied in detail by Manzini and di Serego Alighieri Manzini and di Serego Alighieri (1996) assuming an optically thin homogeneous medium. Currently, none of the available radiative transfer models for inhomogeneous clumpy media have considered the fractional polarization of the scattered radiation in a biconical geometry. However, a study of optical depth and geometrical effects on dust scattering by Zubko and Laor Zubko (1999) shows that the fractional polarization is almost independent of optical depth due to the relatively small contribution of multiple scattering to the net polarization. In consequence, we assume that the calculations made for homogeneous optically thin medium by Manzini and di Serego Alighieri Manzini and di Serego Alighieri (1996) provide a reasonable estimate of the fractional polarization of the scattered radiation. Considering only calculations made for standard MRN interstellar dust composition and a torus half opening angle °, the fractional polarization at a given wavelength is determined by the observer’s viewing angle . These models predict that the continuum polarization at 1500 Å varies between 25% for °(when the torus is seen edge on) and about 10% for °. This range in fractional polarization depends on the assumed torus opening angle. The value we use in this calculation is illustrative and is consistent with Barthel’s (1989) statistical analysis.
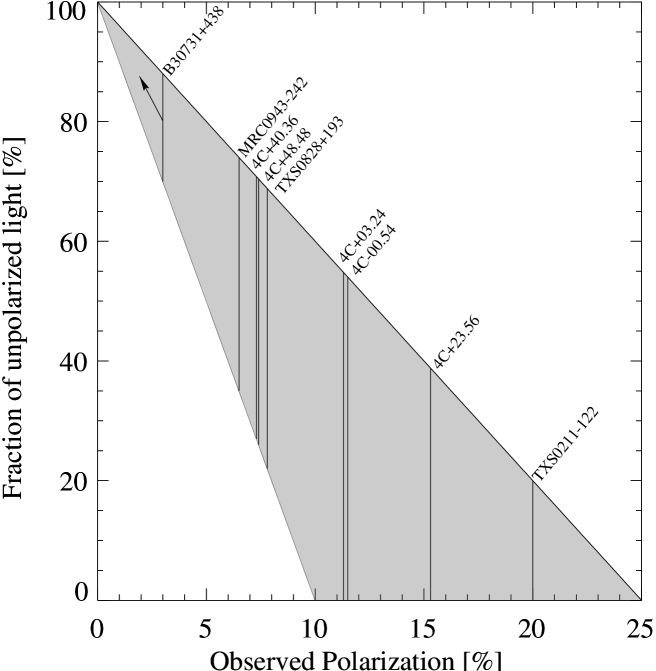
The range in observed continuum polarization in our sample is compatible with these predictions. It goes from less than 3% in 0731438 to about 20% in 0211122 longward Ly, which is lower than the range spanned by models. Using the following equation describing the dilution of polarization of the scattered radiation of fractional polarization by an unpolarized component :
we can set limits to the contribution of unpolarized radiation at 1500 Å making extreme assumptions for the unknown observer’s viewing angle as displayed on fig. 6 (see also table 5). While the polarized scattered radiation must contribute more than 80% in 0211122, unpolarized radiation constitutes more than 70% of the continuum in the least polarized radio galaxy in this sample. All objects except 0731438 are compatible with scattered continuum accounting for at least half of the observed continuum. The two main sources of unpolarized radiation — the nebular continuum and a young stellar population — are discussed in the next two sections.
4.1.2 The nebular continuum
As shown by Dickson et al. Dickson et al. (1995), the nebular continuum makes a significant contribution to the UV continuum of powerful radio galaxies. Its spectrum, normalised to the observed flux, is computed using tabulated coefficients for given in Aller et al. Aller (1987). Since the Ly flux is strongly influenced by neutral hydrogen as well as dust, the Ly/ ratio does not provide a reliable estimate of the flux. We use instead the Heii line flux and the average value HeiiH given by McCarthy McCarthy (1993) to compute the contribution of the nebular continuum. Assuming that both the emission lines and the nebular continuum are affected by the same amount of dust extinction, our estimate based on the Heii flux approximately takes this into account. The contribution to the total flux at 1500 Å for each object is given in the third column of table 5. In general, the nebular continuum contributes less than 25% of the continuum at 1500 Å leaving room for a significant starlight contribution of unpolarized radiation.
4.1.3 The young stellar population
| Object | Scattered | Young stellar | Nebular |
|---|---|---|---|
| AGN (%) | population (%) | continuum (%) | |
| 0211122 | 80-91 | 11-0 | 9 |
| 4C23.56 | 61-93 | 32-0 | 7 |
| 4C00.54 | 47-88 | 41-0 | 12 |
| 4C03.24 | 45-97 | 52-0 | 3 |
| 0828193 | 40-75 | 35-0 | 25 |
| 4C48.48 | 30-74 | 58-14 | 12 |
| 4C40.36 | 29-73 | 61-17 | 10 |
| 0943242 | 27-66 | 53-14 | 20 |
| 0731438 | 0-30 | 84-54 | 16 |


From the constraints on scattered light and estimates of the nebular continuum, we obtain limits on the fraction of continuum contributed by a young stellar population. These limits are shown in the second column of table 5. In all objects except 0731438, starlight contributes less than half of the UV continuum. In consequence, it is not possible to accurately characterise the underlying young stellar population.
Unambiguous direct spectral signatures of young massive stars that we might expect to detect are Siiv1400, Civ1549 P Cygni profiles and purely photospheric absorption lines (ie. uncontaminated by interstellar absorption) from O and B stars like Siiii, Ciii, Sv . We have searched for the presence of such features in our sample, especially in low polarization objects where the contribution of a young stellar population is likely to be the most important.
We find no clear evidence for the presence of stellar P Cygni profiles in any of our spectra. These features are prominent in very young stellar populations ( Myr) with equivalent width Å (as measured on Civ line in Leitherer et al. 1999 [Starburst 99] 1 Myr solar metallicity Salpeter initial mass function (IMF) instantaneous starburst model). Such features are prominent enough to be detected given the quality of our data. However, the equivalent widths of these features vary strongly with metallicity by a factor of about 5, the more metal-rich starbursts having stronger lines (Heckman et al. 1998). In addition, the presence of strong narrow emission lines and scattered broad lines could, in some objects, partially fill such features if present. The blue wing of the Civ1549 line profile is also affected by the strong Siii absorption and emission line.
Stellar population synthesis models and observations of both local starbursts (eg. Leitherer et al. 1996 ; Conti et al. 1996) and high redshift star forming galaxies (eg. Pettini et al. 2000) show that the equivalent width of Siiii, Ciii and Sv photospheric absorption lines varies from 0.6 to 0.8 Å. The strength of these lines also depends strongly on metallicity. Heckman et al. Heckman et al. (1998) can only tentatively detect photospheric features in their high signal-to-noise low metallicity composite spectrum. We estimate the detection limit for an unresolved absorption line to be about Å in the restframe, precisely in the expected range of observed values for stellar features. This means that in our observations we could only hope to detect these absorption lines in the most favorable cases where young stars dominate the continuum. Non-detections do not, therefore, provide useful constraints. We do detect an absorption line that could be identified as Ciii photospheric line in our spectrum of 0731438 (and also in 4C00.54, see discussion in paper I). The measured equivalent width in the restframe is 0.85 Å, consistent with values observed in starbursts. This purely photospheric line is present only in the spectrum of early-B stars de Mello et al. (2000) but since no other characteristic feature of young massive stars is detected in any of our spectra, we consider this identification as very uncertain.
Constraints on the star formation rate (SFR) can be derived by comparing the luminosity at 1500 Å (listed in table 2), corrected for scattered light and nebular continuum contributions (), to predictions from stellar population synthesis models. We used a Starburst 99 (Leitherer et al. 1999), solar metallicity, Salpeter IMF, continuous star formation model. In our sample, ) ranges from about 42.2 to less than 40.7. Assuming that the stellar population is older than 10 Myr (ie. when the stellar population has reached an equilibrium after the initial onset of the burst), this translates into a range in SFR from ~ to less than , not taking into account any dust reddening correction.
We could, in principle, combine the luminosity information with the spectrum colour to constrain both the reddening and the age of the stellar population. However, since reprocessed AGN radiation dominates the continuum of all objects in this sample with the exception of 0731438, the slope does not provide meaningful information about the properties of the stellar population. In this one exception, the slope at 1500 Å , is significantly redder than values spanned by starbursts models for which ranges from -2.5 at 10 Myr to -2.0 at 1 Gyr. This shows that in this object the stellar population is reddened with values between 0.1 and 0.2 if the age of the stellar population () is between 10 Myr and 1 Gyr. The range in for this object then translates into a SFR between 30 and 120 for and or between 60 and 260 for and using a Galactic reddening law (consistent with our scattering model) which gives a dust extinction in magnitudes of .
This range in SFR appears to be comparable to what is typically observed in Lyman break galaxies at a similar redshift. For instance Sawicki and Yee 1998 find that the median dust-corrected SFR in Lyman break galaxies is (with a typical reddening ) or without dust correction. In the well studied lensed Lyman break galaxy MS 1512cB58, Pettini et al. (2000) derive a SFR of about (all values were converted to the cosmology used in this paper).
If we now compare to instantaneous burst models, we can set limits on the total mass and the age of the burst in 0731438, depending on reddening. We obtain and without reddening, and for and and for .
As an example we present in fig. 7 a three component fit (scattered quasar, nebular continuum and young stellar population) of the two objects in our sample showing extreme polarization properties. The contribution of each component for these objects is given in table 5. For 0211122, — the most polarized object — we display the fit that maximizes the stellar contribution allowed by our model. On the other hand for 0731438 — the least polarized object — we show the solution which maximizes the scattered quasar’s contribution. In both cases the stellar population was modeled using the Starburst 99 solar metallicity 20 Myr instantaneous burst model.
The conclusion of this analysis is that the brightness of the scattered quasar light in these powerful HzRG can swamp a SFR of several tens of Solar masses per year unless a burst is observed during its initial, very luminous phase. One at most of the objects in our sample appears currently to be undergoing such a burst.
4.2 Predicted far infrared continuum
Current submillimeter instruments are just reaching the sensitivity required to start measuring the far infrared (FIR) emission of brightest HzRG and provide us with useful flux upper limits (Archibald et al. 2000). As a consistency check, we have computed the FIR SED that is expected from HzRG in a way that is consistent with our dust scattering model. This estimate is restricted to the FIR flux re-radiated by the same dust which is responsible for that scattering of the ultraviolet continuum (ie. within the torus opening angle). Since much of this dust is located at large radial distances from the nucleus, it is relatively cool.
The characteristics of the ISM are the same as that used to model the scattered continuum: a 40kpc sphere containing of Galactic type dust in an clumpy geometry with a density contrast and filling factor is illuminated by an anisotropic central source. The method is fully described in Városi and Dwek Városi and Dwek (1999).
This model does not provide a full treatment of the effect of the anisoptropy of the central source nor does it include the effect of radiation below the Lyman limit (~30% total energy in the UV). The latter would require modeling the ionization of gas and the heating of dust by absorption of Ly photons that is beyond the scope of this paper.
Under these assumptions, the result of the simulations is the following energy balance. The total input energy is — the integrated quasar ultraviolet-optical continuum above the Lyman limit. We are only interested here in the fraction of this energy (29%) that escapes within the torus opening angle (the remaining 71% is absorbed and re-radiated by the dusty torus at wavelength around 10 ). The going into the illuminated cone then divides into 77% escaping directly without interacting with dust grains, 7% that is scattered (see sect. 4.1.1) and 16% absorbed and re-radiated in the FIR. The resulting FIR luminosity of the dust within the opening angle of the torus is about . More than 75% of this energy comes from the clumps and the rest from the interclump medium.
In order to compute the FIR SED, the temperature equilibrium for graphite and silicate grains is computed by equating absorbed and emitted luminosities in clumps and in the inter-clump medium using a power law temperature probability distribution and assuming that that the radiation density decreases with distance from the source like an inverse powerlaw with index 2.5 (2 would be for optically thin case, see Városi and Dwek 1999).
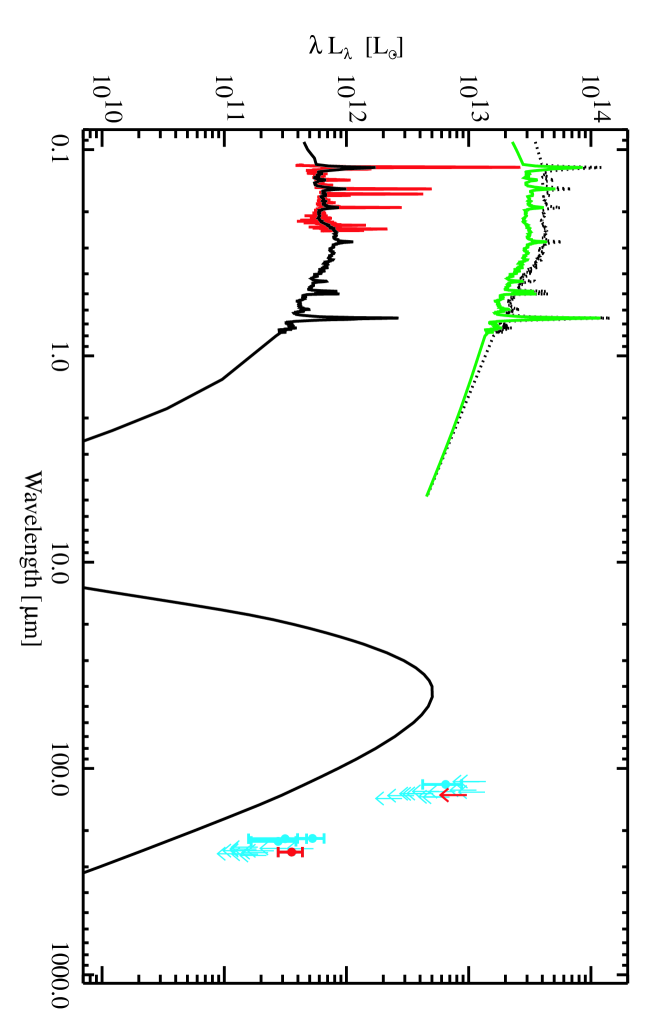
The resulting modeled SED from 0.1 to 1000 is plotted in fig. 8. The calculation shown here has been made to match the scattered flux of 4C48.48 from our Keck spectrum because this is the only object in our sample detected with SCUBA at 850 This corresponds to a quasar of magnitude . The scattering is almost grey in the UV but at longer wavelengths, clumps become optically thin and the scattering deviates from grey and eventually the medium becomes transparent (the radiation that escapes directly [green curve in fig. 8] converges toward the input spectrum [dotted curve] and the scattered radiation drops longward of 1).
Our predictions are approximately a factor of ten below the upper limits. It is important to stress at this point that what we compute here is clearly a lower limit to the FIR flux for several reasons. The contribution of the dusty torus IR radiation is not included but it will mainly contribute around 10 . In this calculation only the radiation of the dust within the cone opening angle is computed. The rest of the host galaxy (~70% of the ISM) mainly heated by star formation and reprocessed AGN radiation is not taken into account although it clearly has a significant contribution at long wavelength (). Also, as mentioned above, the transfer of the radiation below the Lyman limit is not taken into account.
The point of this calculation is not to obtain the best fit to the data but to show that our model, which is consistent with the observed scattered UV continuum, does not over-predict the FIR radiation. This confirms the impression we have from observations that current instrumentation is really at the sensitivity limit needed to detect HzRGs and that we currently just pick the brightest objects. Most powerful radio galaxies at redshift between 2 and 3 should be detected in the near future with an increase of instrumental sensitivity less than a factor of ten.
4.2.1 Emission lines
The emission lines seen in radio galaxies arise from two quite distinct regions. We see scattered light from the central quasar which is characterised by its polarization and includes both broad and narrow components. These narrow components arise in a region which is larger than the broad line region (BLR) proper, but still small enough to be obscured from our direct view, with the lines coming from transitions with a high critical density for collisional de-excitation being more prominent (Hes, Barthel & Fosbury 1993). The emission lines from the global ISM of the host galaxy come predominantly from those zones which see the ionizing radiation from the quasar directly and are generally much stronger that the scattered narrow lines. While a number of mechanisms may be responsible for heating and ionizing this gas, including shocks and cosmic rays, the ionization of the warm (K) ISM in the hosts of these powerful radio galaxies is thought to be dominated by the AGN radiation field (Villar-Martín et al. 1999). The presence of this galaxy-scale gas, illuminated by an intense ionizing radiation field resulting in bright emission lines spanning a broad range of ionization states, presents an opportunity for detailed studies of its physical state and chemical composition which is absent in galaxies without AGN. This opportunity cannot be easily exploited in the quasars themselves since their spectra are so dominated by direct light from the AGN. It is in the radio galaxies that we can most effectively exploit the ‘natural coronograph’ provided by the local obscuration of the quasar.
Studies of chemical composition are likely to be particularly revealing since this is the epoch where we expect the massive host galaxies and the AGN themselves to be in the process of assembly or at least to be in an early stage of their evolution. Since the timescales for AGN phenomena and galactic evolution are very different — by factors of a hundred or so — we can consider the quasar as acting like a ‘flash bulb’ which gives us a snapshot view of its host galaxy. By studying a number of such objects at a similar redshift, we might expect these snapshots to reveal hosts in different stages of evolution even if the galaxy and AGN formation triggers are closely related.
In table 6, we present measurements of all the detected emission lines. The spectrograph aperture ranges from which corresponds to 500–1000 kpc2 at these redshifts. For objects of this size and complexity, we must be realistic in our expectations for the results of the analysis. The volume integrals represented by emission line measurements are taken over a large fraction of the ISM of a whole galaxy and will include inhomogeneities on many scales. The modelling we do vastly oversimplifies the situation but nonetheless may allow us to interpret differences in line ratios from object to object in terms of variations in their properties even if we can place less confidence in, for example, absolute elemental abundance determinations.
The spectra are characterised by a high state of ionization with the Civ, Nv and, in 0943242 which has a sufficiently high redshift, Ovi resonance lines being prominent. The Heii recombination line is also strong, comparable with Civ. The signal-to-noise of the spectra is sufficient to measure a number of intercombination lines from carbon, nitrogen, oxygen and silicon. The average relative intensity of the strong lines is similar to that in the average MRC radio galaxy spectrum compiled by McCarthy (1993). The most significant variation amongst the stronger lines is seen in Ly, which is clearly affected by self-absorption, and in Nv.
4.2.2 Photoionization modelling
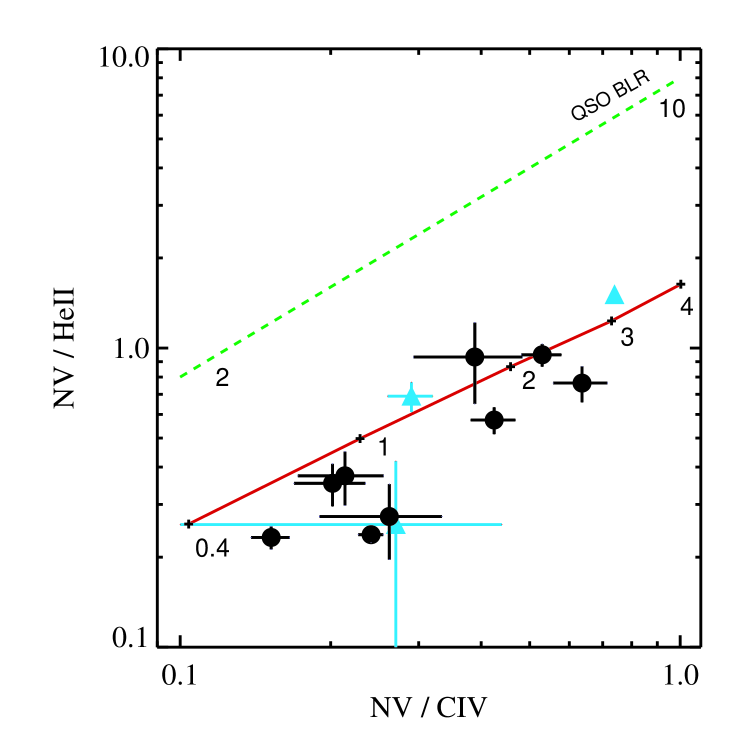
A set of diagrams containing the line ratio data from our sample is shown in fig. 10 and 10. The behaviour of the first of these, the Nv/Heii vs. Nv/Civ diagram (fig. 10), is reminiscent of the behaviour of luminous QSO broad emission line regions discussed by Hamann and Ferland Hamann and Ferland (1993, 1999) (HF93, HF99). These authors showed that high redshift quasars () define a tight correlation in this diagnostic diagram and the modeling of the emission line ratios led them to conclude that the two Nv ratios imply supersolar metallicities in the broad line region of many high redshift quasars. They interpret the correlation in the Nv diagram as a sequence in metallicity such that the highest redshift/most luminous objects show the highest metallicities (up to 10 or so). The reason for this could be related to the higher QSO and/or host galaxy masses at large redshifts, implying a mass-metallicity relationship in QSO similar to that seen in nearby ellipticals (Tinsley 1980; Pagel & Edmunds 1981; Vader 1986; Bica 1988 ). This diagram is further interepreted in terms of elliptical galaxy chemical evolution models by Matteucci & Padovani (1993).
The correlation defined by the sample of HzRG suggests a similar interpretation: we might be witnessing different levels of metal enrichment of the gas from object to object extending, possibly, to supersolar metallicities. If indeed we are seeing large metallicity variations within our sample, the fact that it is apparent in the narrow emission lines emitted by the galaxy ISM provides a much stronger argument for global galactic chemical evolution than the small quantity of nuclear gas represented by the quasar BLR.
In order to test the validity of this interpretation it was first necessary to explore whether models other than a metallicity sequence could reproduce the observations. Villar-Martín et al. (1999) studied the effects of shock ionization, AGN photoionization and the influence of the AGN continuum shape, density and/or ionization parameter 111 is the quotient of the density of ionizing photons incident on the gas and the gas density: . They showed that these models could explain neither the Nv correlation nor the very strong Nv emission observed in some objects. Other effects investigated are the depletion of carbon onto dust grains and the effect of illumination/viewing geometry on resonance line transfer (see Villar-Martín, Binette & Fosbury 1996 ). Carbon depletion can produce large Nv/Civ ratios, but Nv/Heii remains nearly constant unless the metallicy is varied. Regarding geometrical effects, since Nv and Civ are resonance lines, the contribution relative to other emission lines should vary with the orientation of the object. However, Nv/Civ and Nv/Heii vary in opposite ways with perspective (Nv/Civ increases when Nv/Heii decreases and viceversa) so that it is not possible to produce large values (1) of Nv/Heii and Nv/Civ at the same time.
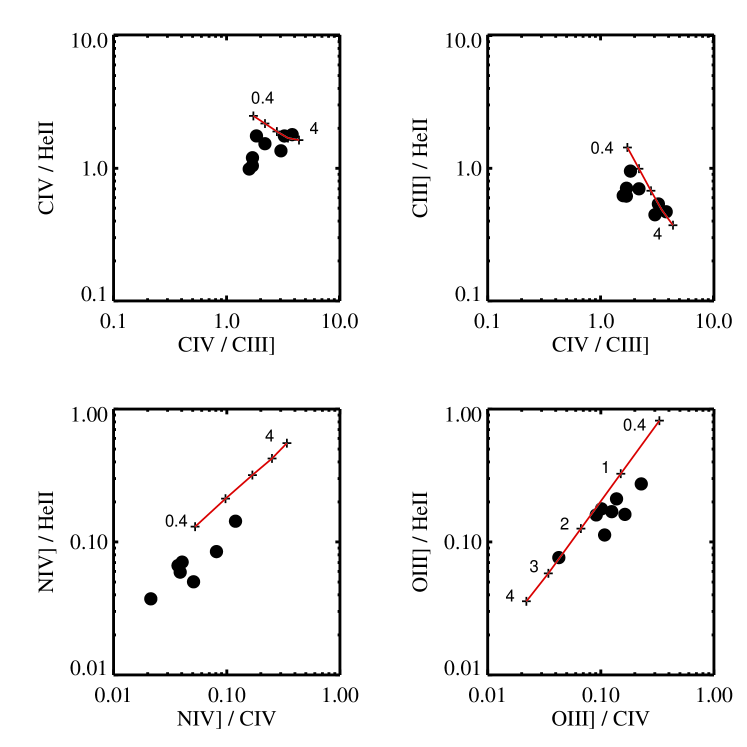
The effect on the Nv behaviour of a metallicity sequence was then examined to see if it could explain the observations in this diagram and remain consistent with the other emission line ratios. Thanks to the high signal-to-noise of the spectra, we could use many fainter emission lines to to compare with the models. It was assumed that the gas (100 cm-3) is photoionized by a power law of index (Villar-Martín et al. 1999) and the same was used for all the objects. Such a constant ionization state is suggested by the small variation of Civ/Ciii] and Civ/Heii, fig. 10).
It is found that:
-
•
A sequence in metallicity can reproduce both the observed correlation and the strength of the Nv emission. The heavy element abundances relative to H vary between 0.4 and 4 in the models.
-
•
The N abundance must increase quadratically instead of linearly with respect to carbon, oxygen etc.
-
•
There is good agreement between the model predictions and the data in all diagrams except for Niv]1488. This line is predicted to be stronger than observed. None of the models we explored can explain this discrepancy. A similar inconsistency was reported for the Seyfert galaxy NGC1068 (Kraemer & Crenshaw 2000). However, the fact that both the data and the models define a tight correlation in the Niv]1488 diagram (see also Oiii] diagram) supports a metallicity sequence.
Another possibility, based on the polarization results, is that the extended gas is mixed with dust. We studied the effects of internal dust as a variation of the dust to gas ratio (depletion, scattering, absorption) and found that not only are high metallicities needed, but also unrealistically high densities (106 cm-3) in the extended gas to explain the relative strength of Nv in some objects. In addition, these models produce strong discrepancies with other observed UV line ratios. These results imply that the emission lines come preferentially from regions where the effects of internal dust are small.
We conclude that the Nv diagram implies solar or supersolar metallicities in the extended gas of many HzRG. The sequence shows that the level of enrichment varies from object to object. The quadratic increase of N abundance suggests that the N production is dominated by secondary nucleosynthesis processes, as expected for high metallicities (Henry et al. 2000).
4.2.3 Correlations
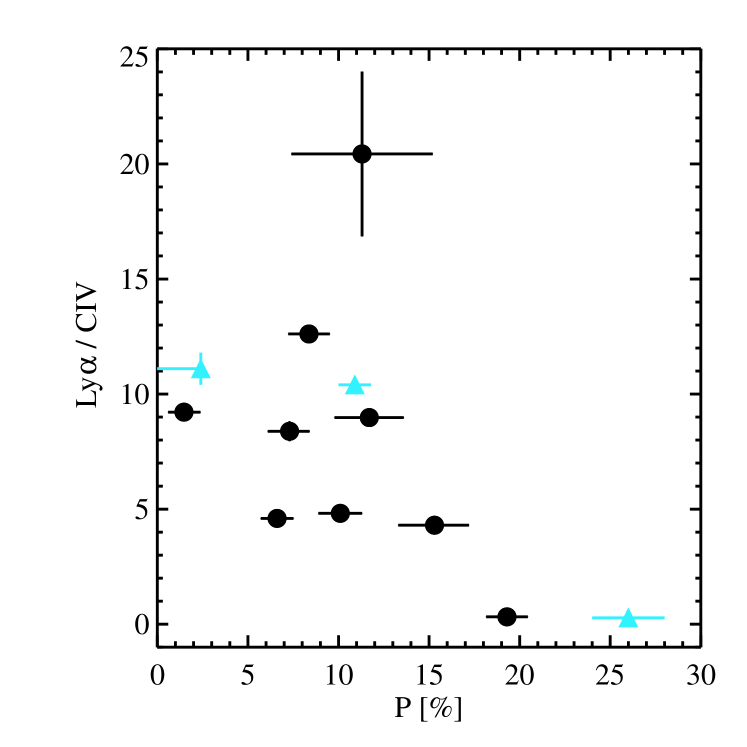
Amongst the data for the continuum and the stronger emission lines, there are two correlations which are immediately apparent. The first is between the continuum fractional polarization and the strength of Ly. Fig. 11 shows that the highly polarized sources have low Ly/Civ ratios and fig. 1, especially the spectrum of 0211-122, suggests that the weakness of Ly is due to self absorption as has been demonstrated to occur in radio galaxies by van Ojik et al. van Ojik et al. (1997a).
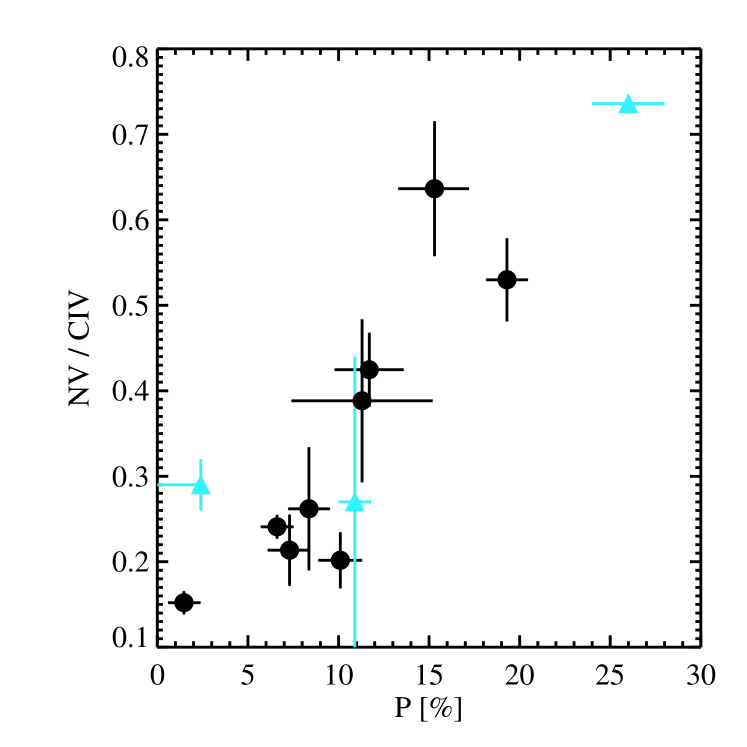
The second correlation, shown in fig. 12, is between and the Nv/Civ ratio with the latter spanning a factor of five within our sample. The fact that this ratio is uncorrelated with Ciii]/Civ or Heii/Civ suggests that this is not simply an ionization effect. The correlation is also present between Nv/Heii and , which suggests — as discussed in the previous section — that carbon depletion onto grains is not the dominant effect. The tightness of this correlation is remarkable since, whatever the underlying cause, these two physical quantities are likely to represent very different averages over the emitting volumes. In the simplest case, the line ratio is a microphysical property of the ionized gas while the continuum polarization is dependent on large-scale structure and orientation.
The nature of these correlations can be further illustrated by comparing our sample with other objects in the literature which have comparable quality spectroscopy (see table 4). Our most polarized source, 0211122, has a line and continuum spectrum which is remarkably similar to the lensed ultraluminous IRAS galaxy FSC 102144724 (, Goodrich et al. 1996). Both sources have weak (absorbed) Ly, strong Nv and a high continuum polarization: 20% for 0211122 and 26% for FSC 102144724 measured in the same restframe band between Nv and Siiv. Although FSC 102144724 is not a powerful radio source, the Keck spectropolarimetry shows it to contain a luminous hidden quasar.
Our lowest polarization source, 0731438, has strong Ly and weak Nv similar to 4C41.17 () which Dey et al. Dey et al. (1997) have argued has a continuum dominated by a young stellar population. The relatively strong, low ionization interstellar absorption lines seen in the 4C object appear, however, in emission in 0731438.
The radio galaxy 3C 256 has both imaging- (Jannuzi et al. 1995 ) and spectropolarimetry (Dey et al. 1996) with ranging from 11–18% depending on aperture and wavelength. Palomar 5m spectroscopy by Simpson et al. Simpson et al. (1999) provides measurements of the Ly, Nv, Heii and Civ emission line fluxes. This object has a continuum shape between 1500–2600 Å which is essentially identical to our average spectrum and is well fitted by the reflected quasar model.
These three sources have been plotted with symbols different from the main sample in the figures.
In order to understand the origin of these correlations we need to review the possible physical reasons for the variations of , Ly and Nv. For the scattering of quasar light by dust, the fractional polarization we measure is determined by the particular biconical scattering geometry and global orientation and by the presence of diluting, unpolarized continua. The strength of Ly with respect to the other emission lines is probably most strongly influenced by neutral hydrogen absorption with the possibility of dust playing a role in quenching multiply scattered line photons (Villar-Martín, Binette and Fosbury 1996).
We have concluded that the variation of the Nv/Civ ratio is the result of abundance variations. We cannot currently provide a detailed explanation for this behaviour but it is likely, we believe, to be a manifestation of an evolutionary sequence where a host galaxy starts its assembly with low metallicity and being relatively dust-free. As the spheroid building proceeds, the chemical enrichment of the ISM is accompanied by dust production and dispersal. The similarity between the spectra of 0211122, our most polarized HzRG, and several of the AGN-powered ULIRG, eg. FSC 102144724, suggests that these dust-enshrouded objects are the end point of a Gyr of spheroid assembly.
5 Conclusions
By performing spectropolarimetry of the restframe ultraviolet emission from a sample of radio galaxies, we have been able to isolate and identify the dominant contributors to their observed spectra. These are:
-
•
Spatially-extended, dust-scattered light from the underlying obscured quasar. Due to the supposed clumpiness of the scattering medium, a natural ‘luminosity-weighting’ process operates which means that the scattered photons originate predominantly from regions where . This results in approximately grey reflection of a few percent of the quasar luminosity. Deviations from greyness around 2200 Å are expected for standard Galactic dust and are seen in our data if the quasars do not have abnormally strong FeII emission. Based on the spectral shape and the fractional polarization, the scattered light accounts for between 90% and 30% of the total continuum. In the most polarized sources, we also measure the broad line emission from the quasar with approximately the expected equivalent and velocity widths.
-
•
A nebular continuum which, based on the observed strength of the HeII recombination line, is typically 10% of the total flux in the UV.
-
•
The remaining continuum is assumed to arise from a young stellar population although we have only very weak direct observational evidence that this is the case. Constraints from the observed continuum colour severely restrict the age and reddening of such a population in the low polarization objects.
-
•
Strong, spatially-extended narrow emission lines from the ISM of the host galaxy. From photoionization modelling studies it is shown that the dominant fraction of this line emission is excited by the ionizing radiation from the quasar.
The clumpy dust-scattering model we have employed shows that a few percent of the hidden quasar light is rendered visible in the restframe UV spectrum of the radio galaxies. For luminous AGN, this is generally sufficient to dominate the observed continuum in this wavelength range. Only young, luminous and relatively unreddened starbursts will reveal themselves clearly against the scattered ‘white haze’. Given the large uncertainty in the reddening of starbursts and the consequent broad range in the allowed conversion of stellar UV flux to SFR, it is likely that we will have to await more sensitive sub-mm measurements in order to investigate the consistency between the building of the stellar content of the host spheroid and the chemical evolution of the ISM as inferred from the emission lines.
The scattering models allow us to calculate directly the FIR radiation emitted from the same dust within the ionization cones which reflects the AGN. This is very much a lower-bound to the expected FIR flux since it takes account neither of the warm dust emission from the obscuring torus nor the cool dust emission from the shadowed dust outside the cones which could be heated by obscured star-formation as well as reflected quasar light. We show that the contribution from the scattering dust is typically 10% of the observed upper limits (and one 850m detection for 4C48.48) on sub-mm emission from radio galaxies.
With the exception of Ly and Nv, which show substantial relative strength variation within our sample, the strong emission line spectra are very similar and indicate that the ISM is ionized predominantly by the quasar radiation field with an ionization parameter . The presence of absorption components suggests that the variations in integrated Ly emission strength are the result of self-absorption by extended neutral hydrogen halos. The variation by more than a factor of 5 in our sample of the Nv/Civ and Nv/Heii emission line ratios cannot be readily explained by variations in ionization state or by the effects of carbon depletion onto dust. However, galactic chemical evolution models for elliptical galaxies, where the nitrogen enrichment arises predominantly from secondary processes over a timescale of 1 Gyr, offer a good fit to the observations of these lines and are generally consistent with the measurements of other lines. This scenario is similar to that inferred from the BLR measurements of QSO at similar redshifts which imply a range of supersolar metallicities from a few to perhaps twenty times solar. The sequence for the radio galaxy ISM suggests, however, a range of metallicity extending from about half to a few times solar. In contrast to the QSO BLR results, where there appear to be no metal-poor luminous AGN, the much more extended gas in the ISM of radio galaxies shows that massive black holes can exist in relatively metal poor hosts.
The Nv/Civ and Nv/Heii line ratios are positively correlated with the continuum polarization while Ly/Civ is anticorrelated with . We believe that this is most likely to be the result of an evolutionary sequence within which the spheroids become increasingly dust-enshrouded as the chemical enrichment of the ISM proceeds on a timescate of around 1 Gyr. A property of this scenario is that ULIRG like FSC 102144724 are the end point rather than the beginning of such a period.
Our relatively low resolution spectra are not very sensitive to the presence of weak, narrow absorption lines and so we cannot place very stringent constraints on the presence of lines arising in the photospheres of OB stars. We do, however, see a number of low ionization resonance and excited fine structure lines from carbon, oxygen and silicon. These lines are typically much weaker in absorption than seen in Lyman-break galaxies like MS1512-cB58 (Pettini et al. 2000 ) and, indeed, sometimes show redshifted emission components (see Fig.3). There is a weak tendency for high polarization objects to show these lines in emission and low polarization objects to show them in absorption. This could indicate the different locations of the background stellar and scattered continuum sources.
While we demonstrate that scattered quasar light generally dominates the UV continuum of these powerful radio galaxies, the presence of an evolved stellar population would be expected to reveal itself at wavelengths above the 4000 Å break. To this end, we are currently observing a partially overlapping sample of HzRG with in the near infrared with the ESO VLT in order to sample their restframe optical spectra. Measurements of the continuum should reveal the presence of any evolved stellar population while the familiar optical forbidden emission lines will improve our ability to perform reliable abundance analyses of the ionized ISM.
Acknowledgements.
We thank Luc Binette for all of his help and support in the use of the MAPPINGS code, Adolf Witt for discussions about dust and Francesca Matteucci for her advice about galactic chemical enrichment models. The W.M.Keck Observatory is operated as a scientific partnership between the California Institute of Technology and the University of California; it was made possible by the generous financial support of the W.M.Keck Foundation. RAEF is affiliated to the Astrophysics Division, Space Science Department, European Space Agency.| Line | (Å) | 4C03.24 | 0943242 | 0828193 | 4C23.56a | 0731438 | 4C00.54 | 4C48.48 | 0211122 | 4C40.36 |
|---|---|---|---|---|---|---|---|---|---|---|
| Ovi | 1031.9,1037.6 | 5.6 | ||||||||
| Cii , Cii⋆ | 1036.3,1037.0 | 5.2 | ||||||||
| Heii | 1084.9 | 2.2 | ||||||||
| Ly | 1215.7 | 254.4 7.3 | 213.81.8 | 875.211.2 | 77.4 1.2 | 428.12.2 | 261.63.4 | 700.011.8 | 9.00.3 | 1140.538.5 |
| Nv | 1238.8,1242.8 | 4.8 0.8 | 11.2 0.6 | 36.7 5.9 | 11.51.3 | 7.10.6 | 12.41.2 | 14.54.0 | 14.91.3 | 29.15.6 |
| Ly+ Nv broad | 22.55 | 226 | ||||||||
| Siii⋆ | 1264.7,1265.0 | 2.0 | 1.0 | 1.0 | 6.4 | |||||
| Siii⋆ | 1309.3 | 1.8 | 3.0 | 1.9 | 0.9 | 9.6 | ||||
| Cii , Cii⋆ | 1334.5,1335.7 | 4.6 1.3 | 2.4 | 3.3 | 2.2 | 1.1 | 3.9 | 20.9 | ||
| Oiv, Siiv | 1398 | 6.1 2.5 | 8.9 | 31.4 | 1.8 | 9.7 | 10.4 | 13.4 | 3.2 | 22.0 |
| Siiv broad | 1393.8,1402.8 | 8.1 | 6.5 | |||||||
| Niv | 1486.5 | 2.4 0.3 | 7.3 0.8 | 2.20.6 | 1.80.3 | 4.50.8 | 1.00.2 | 2.90.6 | ||
| Siii | 1526.7 | |||||||||
| Siii⋆ | 1533.4 | 1.2 | 0.9 | |||||||
| Civ | 1542.9,1548.2 | 12.5 2.2 | 46.5 1.1 | 181.74.5 | 18.01.5 | 46.51.0 | 29.12.0 | 55.50.5 | 28.21.0 | 136.15.1 |
| Civ broad | 13.91.8 | 9.91.0 | ||||||||
| Nev | 1575.1 | 0.9 | ||||||||
| Neiv | 1602.0 | 2.2 | ||||||||
| Heii | 1640.4 | 5.2 1.3 | 47.11.3 | 103.81.4 | 15.01.0 | 30.40.5 | 21.50.5 | 53.23.5 | 15.70.3 | 77.75.6 |
| Oiii | 1660.8,1666.1 | 7.6 | 18.4 | 4.1 | 6.4 | 3.6 | 6.0 | 1.2 | 12.4 | |
| Niii | 1749 | 1.4 | 6.1 | 8.4 | ||||||
| Siii | 1808.0 | 1.7 | 5.9 | 1.4 | ||||||
| Siii⋆ | 1816.9,1817.5 | 1.4 | 10.1 | |||||||
| Siiii | 1882.5 | 2.9 | 6.2 | 1.7 | ||||||
| Siiii | 1892.0 | 2.5 | 12.0 | 1.0 | ||||||
| Ciii | 1906.7,1908.7 | 29.3 3.1 | 55.96.8 | 10.61.0 | 21.20.5 | 9.60.7 | 32.81.0 | 7.40.5 | 73.911.8 | |
| Ciii broad | 12.2 | 7.1 | ||||||||
| Cii | 2326 | 19.2 | 8.0 | 5.0 | 3.6 | 11.6 | 43.3 | |||
| Neiv | 2421.8 | 49.0 | 13.6 | 18.0 | 22.4 | 32.6 | 4.8 | 37.1 | ||
| Oii | 2471.0 | 20.8 |
| Line | (Å) | 4C03.24 | 0943242 | 0828193 | 4C23.56a | 0731438 | 4C00.54 | 4C48.48 | 0211122 | 4C40.36 |
|---|---|---|---|---|---|---|---|---|---|---|
| Siii | 1260.4 | 3.7 | 3.0 | 7.5 | 1.7 | |||||
| Siii⋆ | 1264.7,1265.0 | 13.4 | 4.9 | 4.6 | 12.5 | |||||
| Oi, Oi⋆, Siii | 1304 | 4.2 | 3.9 | 5.5 | 2.1 | |||||
| Siii⋆ | 1309.3 | 10.8 | 6.8 | 8.6 | 5.7 | 9.6 | ||||
| Cii , Cii⋆ | 1334.5,1335.7 | 31 | 12.4 | 6.8 | 6.7 | 9.9 | 6.1 | 6.9 | 2.2 | 20.9 |
| Siii | 1526.7 | 5.3 | 3.1 | 4.7 | 6.8 | 10.2 | ||||
| Siii⋆ | 1533.4 | 7.8 | 4.2 | 2.7 | 1.0 | |||||
| Siii | 1808.0 | 7.9 | 18.7 | 8.4 | ||||||
| Siii⋆ | 1816.9,1817.5 | 4.5 | 11.6 |
References
- Aller (1987) Aller, L., 1987, Astrophys. Space Sci. Library 112
- Antonucci (1993) Antonucci, R., 1993, ARA&A 31, 473
- Archibald et al. (2000) Archibald, E. N., Dunlop, J. S., Hughes, D. H., Rawlings, S., Eales, S. A., and Ivison, R. J., 2000, MNRAS, submitted, astro-ph/0002083
- Barthel (1989) Barthel, P. D., 1989, ApJ 336, 606
- Best et al. (1998) Best, P. N., Röttgering, H. J. A., Bremer, M. N., Cimatti, A., Mack, K. H., Miley, G. K., Pentericci, L., Tilanus, R. P. J., and Van der Werf, P. P., 1998, MNRAS 301, L15
- Bica (1988) Bica, E., 1988, A&A 195, 76
- Burstein and Heiles (1982) Burstein, D. and Heiles, C., 1982, AJ 87, 1165
- Cardelli et al. (1989) Cardelli, J. A., Geoffrey, C. C., and Mathis, J. S., 1989, ApJ 345, 245
- Carilli et al. (1997) Carilli, C. L., Röttgering, H. J. A., van OJIK, R., Miley, G. K., and Van Breugel, W. J. M., 1997, ApJS 109, 1
- Chambers et al. (1987) Chambers, K. C., Miley, G. K., and van Breugel, W., 1987, Nat 329, 604
- Chambers et al. (1996) Chambers, K. C., Miley, G. K., van Breugel, W. J. M., Bremer, M. A. R., Huang, J.-S., and Trentham, N. A., 1996, ApJS 106, 247
- Cimatti et al. (1996) Cimatti, A., Dey, A., Van Breugel, W., Antonucci, R., and Spinrad, H., 1996, ApJ 465, 145
- Cimatti et al. (1994) Cimatti, A., di Serego Alighieri, S., Field, G. B., and Fosbury, R. A. E., 1994, ApJ 422, 562
- Cimatti et al. (1993) Cimatti, A., di Serego-Alighieri, S., Fosbury, R., Salvati, M., and Taylor, D., 1993, MNRAS 264, 421
- Cimatti et al. (1998a) Cimatti, A., di Serego Alighieri, S., Vernet, J., Cohen, M. H., and Fosbury, R. A. E., 1998a, ApJ 499, L21, (paper I)
- Cimatti et al. (1998b) Cimatti, A., Freudling, W., Röttgering, H. J. A., Ivison, R. J., and Mazzei, P., 1998b, A&A 329, 399
- Cohen et al. (1999) Cohen, M. H., Ogle, P. M., Tran, H. D., Goodrich, R. W., and Miller, J. S., 1999, AJ 118, 1963
- Cohen et al. (1995) Cohen, M. H., Ogle, P. M., Tran, H. D., Vermeulen, R. C., Miller, J. S., Goodrich, R. W., and Martel, A. R., 1995, ApJ 448, L77
- Conti et al. (1996) Conti, P. S., Leitherer, C., and Vacca, W. D., 1996, ApJ 461, L87
- Cristiani and Vio (1990) Cristiani, S. and Vio, R., 1990, A&A 227, 385
- de Mello et al. (2000) de Mello, D. . F., Leitherer, C., and Heckman, T. M., 2000, ApJ 530, 251
- de Young (1998) de Young, D., 1998, ApJ 507, 161
- Dey et al. (1996) Dey, A., Cimatti, A., van Breugel, W., Antonucci, R., and Spinrad, H., 1996, ApJ 465, 157
- Dey et al. (1997) Dey, A., Van Breugel, W., Vacca, W. D., and Antonucci, R., 1997, ApJ 490, 698
- di Serego Alighieri et al. (1993) di Serego Alighieri, S., Cimatti, A., and Fosbury, R. A. E., 1993, ApJ 404, 584
- di Serego Alighieri et al. (1996) di Serego Alighieri, S., Cimatti, A., Fosbury, R. A. E., and Perez-Fournon, I., 1996, MNRAS 279, L57
- Dickson et al. (1995) Dickson, R., Tadhunter, C., Shaw, M., Clark, N., and Morganti, R., 1995, MNRAS 273, L29
- Eales et al. (1997) Eales, S., Rawlings, S., Law-Green, D., Cotter, G., and Lacy, M., 1997, MNRAS 291, 593
- Fan et al. (2001) Fan, X., Strauss, M. A., Shneider, P. D., Gunn, J. E., Lupton, R. H., Becker, R. H., Davis, M., Newman, J. A., Richards, G. T., White, R. L., Anderson, J. E., Annis, J., Bahcall, N. A., Brunner, R. J., Hennessy, G. S., Hindsley, R. B., Masataka, F., Kunszt, P. Z., Ivesic, Z., Knapp, G. R., McKay, T. A., Munn, J. A., Pier, J. R., Szalay, A. S., and York, D. G., 2001, AJ, in press
- Goodrich et al. (1995) Goodrich, R., Cohen, M. H., and Putney, A., 1995, PASP 107, 179
- Goodrich et al. (1996) Goodrich, R. W., Miller, J. S., Martel, A., Cohen, M. H., Tran, H. D., Ogle, P. M., and Vermeulen, R. C., 1996, ApJ 456, L9
- Graham et al. (1996) Graham, M. J., Clowes, R. G., and Campusano, L. E., 1996, MNRAS 279, 1349
- Hamann and Ferland (1993) Hamann, F. and Ferland, G., 1993, ApJ 418, 11
- Hamann and Ferland (1999) Hamann, F. and Ferland, G., 1999, ARA&A 37, 487
- Heckman et al. (1998) Heckman, T. M., Robert, C., Leitherer, C., Garnett, D. R., and Van Der Rydt, F., 1998, ApJ 503, 646
- Henry et al. (2000) Henry, R., Edmunds, M., and Köeppen, J., 2000, ApJ 540, astro-ph/0004299
- Hes et al. (1993) Hes, R., Barthel, P. D., and Fosbury, R. A. E., 1993, Nat 362, 326
- Hines and Wills (1993) Hines, D. C. and Wills, B. J., 1993, ApJ 415, 82
- Hobson and Padman (1993) Hobson, M. P. and Padman, R., 1993, MNRAS 264, 161
- Januzzi et al. (1995) Januzzi, B. T., Elston, R., Schmidt, G. D., Smith, P. S., and Stockman, H. S., 1995, ApJ 454, L111
- Knopp and Chambers (1997) Knopp, G. P. and Chambers, K. C., 1997, ApJ 487, 644
- Kraemer and Crenshaw (2000) Kraemer, S. B. and Crenshaw, D. M., 2000, ApJ 532, 256
- Leitherer et al. (1999) Leitherer, C., Schaerer, D., Goldager, J. D., Gonzàles-Delgado, R. M., Robert, C., Kune, D. F., de Mello, D. F., Devost, D., and Heckman, T. M., 1999, ApJS 123, 3, (Starburst 99)
- Leitherer et al. (1996) Leitherer, C., Vacca, W. D., Conti, P. S., Filippenko, A. V., Robert, C., and Sargent, W. L. W., 1996, ApJ 465, 717
- Manzini and di Serego Alighieri (1996) Manzini, A. and di Serego Alighieri, S., 1996, A&A 311, 79
- Mathis et al. (1977) Mathis, J. S., Rumpl, W., and Nordsieck, K. H., 1977, ApJ 217, 425
- McCarthy (1993) McCarthy, P. J., 1993, ARA&A 31, 639
- McCarthy et al. (1987) McCarthy, P. J., Spinrad, H., Djorgovski, S., Strauss, M. A., van Breugel, W., and Liebert, J., 1987, ApJ 319, L39
- McLure et al. (1999) McLure, R. J., Dunlop, J. S., Kakula, M. J., Baum, S. A., O’Dea, C. P., and Hughes, D. H., 1999, MNRAS 308, 377
- Miller et al. (1991) Miller, J. S., Goodrich, R. W., and Mathews, W. G., 1991, ApJ 378, 47
- Oke et al. (1995) Oke, J. B., Cohen, J. G., Carr, M., Cromer, J., Dingizian, A., Harris, F. H., Labrecque, S., Lucinio, R., Schaal, W., Epps, H., and Miller, J., 1995, PASP 107, 375
- Pagel and Edmunds (1981) Pagel, B. E. J. and Edmunds, M. G., 1981, ARA&A 19, 77
- Pei (1995) Pei, Y., 1995, ApJ 428, 623
- Pentericci et al. (2000) Pentericci, L., McCarthy, P. J., Röttgering, H. J. A., Miley, G. K., van Breugel, W. J. M., and Fosbury, R. A. E., 2000, ApJ, submitted
- Pentericci et al. (1999) Pentericci, L., Röttgering, H. J. A., Miley, G. K., McCarthy, P., Spinrad, H., van Breugel, W. J. M., and Macchetto, F., 1999, A&A 341, 329
- Pettini et al. (2000) Pettini, M., Steidel, C. C., Adelberger, K. L., Dickinson, M., and Giavalisco, M., 2000, ApJ 528, 96
- Röttgering et al. (1994) Röttgering, H., Lacy, M., Miley, G., Chambers, K., and Saunders, R., 1994, A&AS 108, 79
- Röttgering et al. (1995) Röttgering, H., Miley, G., Chambers, K., and Macchetto, F., 1995, A&AS 114, 51
- Sawicki and Yee (1998) Sawicki, M. and Yee, H. K. C., 1998, AJ 115, 1329
- Schmitt et al. (1997) Schmitt, H. R., Kinney, A. L., Calzetti, D., and Storchi -Bergmann, T., 1997, AJ 114, 592
- Shaver et al. (1996) Shaver, P. A., Wall, J. V., Kellermann, K. I., Jackson, C. A., and Hawkins, M. R. S., 1996, Nat 384, 439
- Simmons and Stewart (1985) Simmons, J. F. L. and Stewart, B. G., 1985, A&A 142, 100
- Simpson et al. (1999) Simpson, C., Eisenhardt, P., Armus, L., Chokshi, A., Dickinson, M., Djorgovski, S. G., Elston, R., Jannuzi, B. T., McCarthy, P. J., Pahre, M. A., and Soifer, B. T., 1999, ApJ 525, 659
- Simpson and Rawlings (2000) Simpson, C. and Rawlings, S., 2000, MNRAS 317, 1023
- Tinsley (1980) Tinsley, B. M., 1980, A&A 89, 246
- Vader (1986) Vader, J. P., 1986, ApJ 305, 669
- van Breugel et al. (1998) van Breugel, W. J. M., Stanford, S. A., Spinrad, H., Stern, D., and Graham, J. R., 1998, ApJ 502, 614
- van Ojik et al. (1997a) van Ojik, R., Röttgering, H., van der Werf, P., Miley, G., Carilli, C., Visser, A., Isaak, K., Lacy, M., Jenness, T., Sleath, J., and Wink, J., 1997a, A&A 321, 389
- van Ojik et al. (1996) van Ojik, R., Röttgering, H. J. A., Carilli, C. L., Miley, G. K., Bremer, M. N., and Macchetto, F., 1996, A&A 313, 25
- van Ojik et al. (1997b) van Ojik, R., Röttgering, H. J. A., Miley, G. K., and Hunstead, R. W., 1997b, A&A 317, 358
- Városi and Dwek (1999) Városi, F. and Dwek, E., 1999, ApJ 522, 265
- Vernet (2000) Vernet, J., 2000, Ph.D. thesis, Université Paris VII
- Villar-Martiín et al. (1999) Villar-Martiín, M., Fosbury, R. A. E., Binette, L., Tadhunter, C. N., and Rocca-Volmerange, B., 1999, A&A 351, 47
- Villar-Martin et al. (1996) Villar-Martin, M., Binette, L., and Fosbury, R. A. E., 1996, A&A 312, 751
- Villar-Martín et al. (2001) Villar-Martín, M., Vernet, J., Fosbury, R. A. E., Cohen, M. H., di Serego Alighieri, S., Cimatti, A., and Goodrich, R. W., 2001, A&A, in preparation
- Witt and Gordon (1996) Witt, A. N. and Gordon, K. D., 1996, ApJ 463, 681
- Witt and Gordon (1999) Witt, A. N. and Gordon, K. D., 1999, ApJ 528, 799
- Zubko (1999) Zubko, V. G., 1999, ApJ 513, L29