Mapping the Galactic Free-Free Foreground via Interstellar H Emission
Abstract
Recently completed H surveys of large portions of the sky can be used to create maps of the free-free intensity distribution at high Galactic latitude that are independent of the spectral fits to the CMB data. This provides an opportunity to test the accuracy of the spectral fitting procedures and to search for other sources of Galactic forground contamination that could be confused spectrally with the free-free, such as spinning dust grains. The Wisconsin H Mapper (WHAM) survey has sampled the sky north of declination at about one degree angular resolution and has revealed that, except for a few isolated regions of enhanced emission, Tff(30 GHz) K at Galactic latitudes near 15∘, decreasing to Tff(30 GHz) K at latitudes above 50∘. Also in progress are H surveys that sample the sky at higher angular resolution.
Department of Astronomy, University of Wisconsin-Madison, 475 North Charter Street, Madison, WI 53706
1. Introduction
Diffuse, low density ionized hydrogen at a temperature near K is wide spread throughout the disk and halo of the Milky Way (e.g., Reynolds 1991). The thermal bremsstrahlung associated with this gas is expected to be one of the principal sources of foreground contamination to the CMB observations at mm wavelengths (Bennett et al 1992). However, because Galactic synchrotron emission dominates the spectrum at lower frequencies and thermal emission from dust dominates at higher frequencies, the distribution of the free-free emission over the sky cannot be directly observed.
Fortunately, hydrogen recombination lines, and H in particular, provide a way to trace the ionized hydrogen and thus the free-free. A thorough review of the implications of H observations for studies of the CMB has been provided by McCullough et al (1999). This paper is a brief update with an emphasis on the recently completed Wisconsin H Mapper (WHAM) survey.
2. Relationship between H and Free-Free Emission
Valls-Gabaud (1998) has shown that the brightness temperature of the free-free can be related to the H intensity by
| (1) |
where 1 R = photons s-1 cm-2 sr-1, is the frequency in units of 30 GHz, is the temperature in units of 104 K, is the fraction of helium that is singly ionized, the abundance of helium, and is an approximation for the Maxwellian averaged Gaunt factor, given by
| (2) |
This relation between and is valid for frequencies relevant to the CMB and for sight lines in which the interstellar extinction of the H emission is neglectable. Corrections for extinction could be problematic because the decrease in the observed H surface brightness in a given direction depends not only on the total column of dust but upon the unknown arrangement of the emitting and absorbing material along the line of sight. In addition, because the source is extended on the sky, the albedo and scattering phase function of the grains would need to be characterized. Fortunately, at high Galactic latitudes the extinction at H is small. For example, near the Galactic poles, E(B-V) 0.018 (Schlegel, Finkbiner, and Davis 1998), corresponding to an optical depth ; reaches unity for sight lines within 10∘ of the midplane.
The ionization state of helium in the emitting gas is also uncertain. Tufte (1997) and Reynolds and Tufte (1995) found that was approximately 0.5 or less near the Galactic midplane. However, Rand (1997) observed values closer to unity above the midplane of the edge-on galaxy NGC 891, a galaxy similar to the Milky Way. Thus it is possible that along high latitude sight lines in the Milky Way, which sample gas far from the midplane, . Doubly ionized helium is assumed to be negligible.
The temperature of the emitting gas has been explored through measurements of line widths from different mass ions as well as from the intensities of collisionally excited forbidden lines. A comparison of the width of the H line to that of the [S II] 6716 line indicates a mean temperature of approximately 8000 K (Reynolds 1985). Studies of [S II] 6716/H and [N II] 6584/H intensity ratios by Haffner et al (1999) suggest that temperatures vary from direction to direction, ranging from about 6000 K to 10,000 K or more. This would translate into 11% variations in .
Therefore, for , , , and no correction for extinction,
| (3) |
3. High Galactic Latitude H Observations
Gaustad, McCullough, and Van Buren (1996) and Marcelin et al (1998) were the first to use this relationship between H and free-free emission to set upper limits on the free-free contamination of CMB observations sampling small regions of the northern and southern hemisphere, respectively. Subsequently, much more extensive H mapping programs have been undertaken in an effort to explore the distribution and kinematics of the warm ionized gas in the Galaxy, particularly at high latitudes.
3.1. The WHAM Survey
The Wisconsin H Mapper (WHAM) survey has provided the first comprehensive view of the distribution and kinematics of the diffuse interstellar H emission at high Galactic latitudes (Haffner et al, in preparation). WHAM consists of a 15 cm aperture, dual etalon Fabry-Perot spectrometer coupled to a dedicated 0.6 m telescope (Tufte 1997). For the sky survey WHAM provided a one degree diameter beam on the sky and recorded the average spectrum within that beam at 12 km s-1 resolution within a 200 km s-1 wide spectral window centered on the H line. The tandem Fabry-Perot design provided high spectral purity by suppressing the multi-order “ghosts” arising from the relatively bright terrestrial OH emission, which combined with the high spectral resolution, also made it possible to resolve clearly the weak interstellar H emission from the much brighter geocoronal H line. The WHAM facility is located at Kitt Peak near Tucson, Arizona and operated remotely from Madison, Wisconsin.
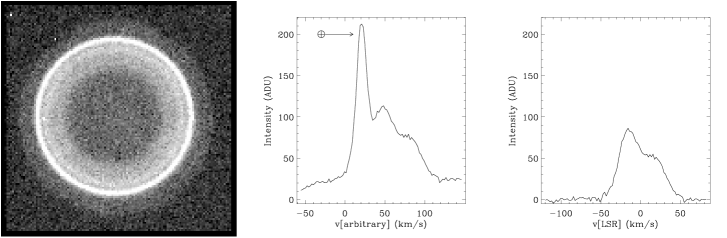
From 1997 January through 1998 September, WHAM obtained approximately 37,000 spectra with its 1∘ diameter beam covering the sky on a grid (,b) north of declination . The integration time for each spectrum was 30 s. Figure 1 illustrates a sample observation from the survey at , , showing both the raw CCD image and resulting H spectra. The geocoronal H line, produced by solar excitation of atomic hydrogen in the earth’s upper atmosphere, is the thin, bright annulus in the CCD “ring spectrum”. This emission appears as a prominent, relatively narrow line in the center frame of Figure 1. The interstellar emission is the broader feature inside the geocoronal ring, appearing in this case to consist of two blended velocity components at +30 km s-1 and +60 km s-1 with respect to the geocoronal line. In general, the separation between the interstellar emission and the geocoronal line is due to a combination of the earth’s orbital velocity, the sun’s peculiar velocity, and intrinsic motions of the interstellar gas, including Galactic differential rotation. The observation for each direction was carried out at a time of the year that resulted in a significant radial velocity separation between the earth and the Galactic local standard of rest (LSR). The two interstellar components in Figure 1 have a total intensity of about 6 R, corresponding to a free-free brightness temperature in this direction of 44 K at 30 GHz (see §2. above). The geocoronal line is removed from the data by fitting each spectrum with gaussian components and then subtracting from the spectrum the fitted gaussian associated with the geocorona. The resulting pure interstellar spectrum is shown in the third frame of Figure 1. The absolute intensity calibration was obtained by comparison with standard astronomical sources (e.g., Scherb 1981) and is accurate to about 15%.
In addition to the bright geocoronal line, much fainter atmospheric emission lines were also removed from each spectrum. Although the origin of these extremely weak ( R) terrestrial lines is not known, their wavelengths and relative intensities have been characterized from long integration spectra obtained over a many month period (Hausen et al, in preparation). The effect of the removal of these lines is shown in Figure 2.

All observations were carried out during dark of the moon to avoid contamination by features in the solar spectrum. However, zodiacal light covers the night sky and contains the H Fraunhoffer absorption line in its scattered solar spectrum. No attempt was made to formally remove this zodiacal feature because there is no clear evidence for it in the processed spectra (see, for example, the third panel in Fig. 2). Its apparent absence is due in part to the fact that core of the line is to a significant degree “fitted out” as part of the removal of the geocoronal line, while the effect of its Lorentzian wings, which are much broader than the band width of the WHAM spectrum, is just to suppress the baseline of the spectrum. Any residual zodiacal absorption feature appears to be at the level of about R or less.
The radial velocity interval for the survey was limited to km s-1 wrt the LSR. This range includes nearly all of the interstellar emission at high latitudes except the H associated with High Velocity H I Clouds (HVCs), which by definition have radial velocities v 80 km s-1. Tufte, Reynolds, & Haffner (1998) observed a number of the large high latitude HVC complexes and found that their H surfaces brightnesses are within a factor of two of 0.1 R. Therefore, the fact that HVCs were excluded from the WHAM survey pass band implies that in those parts of the sky occupied by HVCs (see Wakker & van Woerden 1997), the H intensity on the WHAM survey is too low by about 0.1 R (0.7 K at 30 GHz).
Figure 3 shows a portion of the beam covering pattern for the sky survey. The observations were obtained in “blocks”, with each block usually consisting of 49 pointings made sequentially in a boustrophedonic raster of seven beams in longitude and seven beams in latitude. Each block took approximately 30 minutes, and from one to twenty blocks were observed in a night. The absence or presence of block boundary features in the completed survey map provide an excellent test of the systematic errors associated with observations taken on different nights and different times of the year.
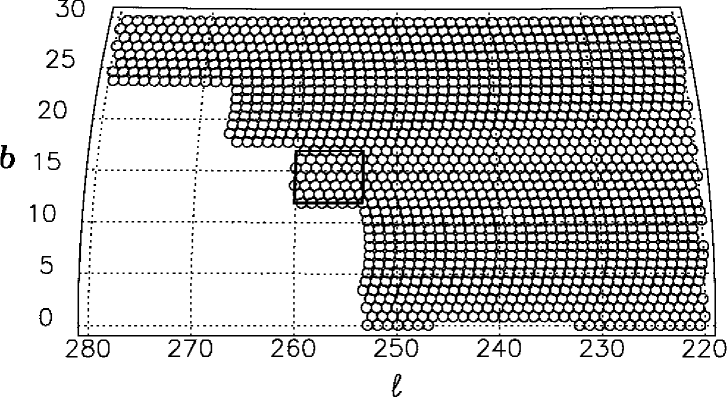
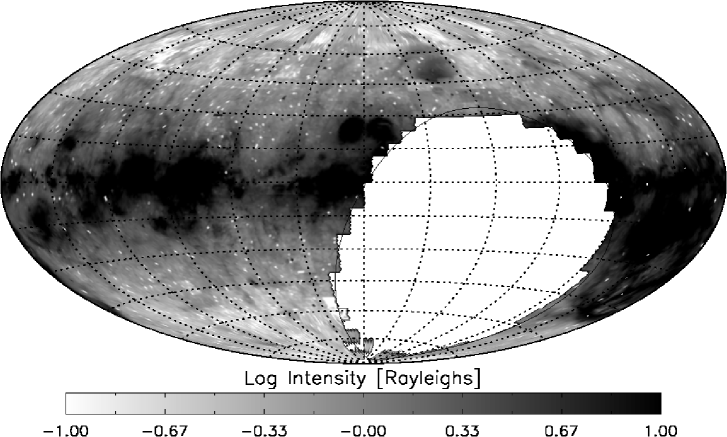
Figure 4 is the resulting survey map showing the total H intensity within the km s-1 interval centered near the local standard of rest. Interstellar H emission extents over virtually the entire sky, with blobs and filaments of enhanced H superposed on a more diffuse background. The highest H intensities are found near the Galactic equator, with a general decrease toward the poles. The relatively bright high latitude enhancement at , is the H II region ionized by Spica (B1 III-IV + B2 V), and some of the other high latitude enhancements also seem to be associated with either B stars or hot white dwarf stars, such as Aqr (B1 V) at 66∘, and sdO PHL 6783 at 124∘, (see Haffner 2000). The large, relatively bright region of diffuse and filamentary emission located between longitudes 180∘ and 240 ∘ and latitudes and is the Orion-Eridanus bubble (Heiles, Haffner, & Reynolds 1999).
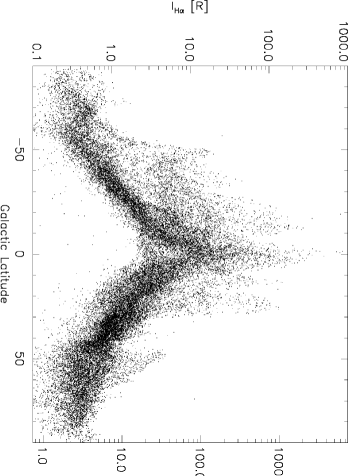
The distribution of H intensities vs Galactic latitude is shown in Figure 5. This plot shows that except for a few isolated regions of enhanced emission, the H intensity variations on scales of one degree or larger are generally less than 4 R (30 K at 30 GHz) at b, 1.7 R (13 K) at b, and 0.5 R (4 K) at latitudes higher than 50o.
3.2. High Spatial Resolution (Sub-Degree) Imaging Surveys
Wide-field CCD imaging has been used to explore the interstellar H on angular scales significantly smaller than 1 degree. This has been accomplished at the expense of spectral resolution, making it impossible to remove the geocoronal H, OH, and other atmospheric emissions. Therefore, the imaging and WHAM spectral surveys complement each other, with the imaging providing valuable new information about the smaller scale structure and WHAM providing the absolute intensity scale and sensitivity to faint, larger scale emission features.
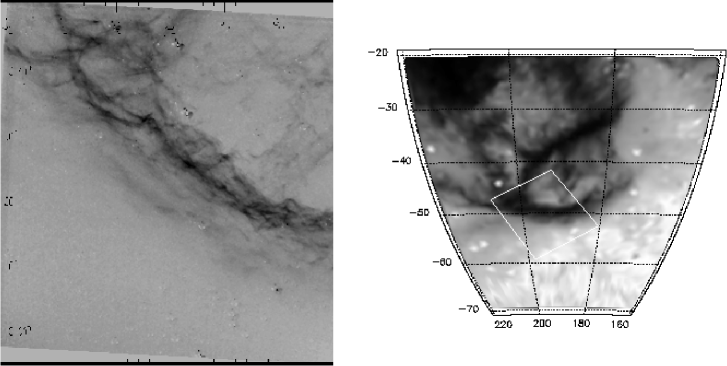
An imaging survey of the sky south of declination has been undertaken by Gaustad et al (1998). The observations, made with a small robotic CCD camera at Cerro Tololo Inter-american Observatory in Chile, consist of 269 images with centers the same as those in the IRAS Sky Survey Atlas. On-band images are obtained through a 30 Å wide H filter with corresponding off-band images obtained through a dual-pass filter that transmitted two 60 Å wide bands on either side of H. The resulting on-band minus off-band images, median filtered to , show interstellar H emission features down to about 1 R with excellent subtraction of the stellar images (see McCullough et al 1999). Most of the observations have been completed, and reduction is underway. Figure 6 compares portions of the Gaustad et al and WHAM surveys. A similar imaging survey, confined to declinations north of and Galactic latitudes b, is being carried out by Dennison, Simonetti, & Topasna (1998) from Virginia, USA.
4. Comparing H with Surveys at Other Wavelengths
Because the WHAM data have just been reduced and the reduction of the high latitude imaging is still in progress, there has not yet been an opportunity to carry out formal analyses incorporating large portions of the sky, to search for correlations between H and the H I, dust, and synchrotron emissions, for example. On the WHAM survey map (Fig. 4), except for the cscb law, no striking correspondences are readily apparent by eye. The H features in the Orion-Eridanus region do have some correspondence with the 21 cm, dust, and soft X-ray emission, presumably associated with energetic events in Orion OB1 (Heiles et al 1999; Reynolds & Ogden 1979); however, other large scale features, like the filament extending from the midplane to at , seem to have no relationship to nearby hot stars or the other phases of the interstellar medium (Haffner, Reynolds, & Tufte 1998). Studies of small parts of the H sky have suggested that some ( 30%) of the H is associated with H I regions (Reynolds et al 1995), and that the amount of thermal dust emission associated with the diffuse H II varies significantly across the sky (Kogut 1997; Arendt et al 1998; McCullough et al 1999; Lagache et al 2000; de Oliveira-Costa et al 2000). A comparision of WHAM data with the 26-46 GHz QMAP observations near the North Celestial Pole shows a correlation with the H consistent with that predicted by equation 3 (de Oliveira-Costa et al 2000), although with marginal significance. More comprehensive analyses using much larger portions of the sky will hopefully further clarify these results. Also, comparisons of the free-free emission, as revealed by the H, with the total “free-free” foreground intensity derived from the spectral fits to the CMB data should help to quantify the amount of microwave emission produced by spinning dust grains (Draine & Lazarian 1998; Ferrara & Dettmar 1994).
5. Summary and Conclusions
Thermal bremsstrahlung from the warm ionized component of the interstellar medium is one of the principal Galactic foregrounds contaminating observations of the cosmic microwave background (CMB). Near the peak of the CMB, the intensity of the free-free may be comparable to that of the Galactic synchrotron and thermal dust emission; however, because it does not dominate the light from the sky at any wavelength, its angular distribution over the sky cannot be observed directly. Within the last few years, surveys of diffuse interstellar H emission have been undertaken to explore the warm ionized interstellar gas. At high Galactic latitudes, where interstellar extinction of the optical H is small, the relationship between the intensity of the H-recombination line and the free-free continuum at a given frequency is only a function of the electron temperature. Since the temperature of the gas is tightly constrained, these high latitude H surveys can provide accurate maps of the Galactic free-free emission, and thus play a potentially important role in testing the accuracy of the spectral fits to CMB foregrounds and exploring the degree to which spinning dust grains contribute to the foreground emission.
6. Acknowledgements
We would like to acknowledge Steve Tufte, Nikki Hausen, Brian Babler, Greg Madsen, Rebecca Pifer, Mark Quigley, Kurt Jaehnig, and Jeff Percival for their work on the WHAM survey. We also thank Peter McCullough for providing a sample from their imaging data. WHAM is supported by the National Science Foundation through grant AST 96-19424.
References
Arendt, R. G., et al 1998, ApJ, 508, 74
Bennett, C. L. et al 1992, ApJ, 396, L7
de Oliveira-Costa, A, Tegmark, M., Devlin, M. J., Haffner, L. M., Herbig, T., Miller, A. D., Page, L. A., Reynolds, R. J., & Tufte, S. L. 2000, ApJ, 542, L5
Dennison, B., Simonetti, J. H., & Topasna, G. A. 1998, Publ. Astr. Soc. Australia, 15, 147
Draine, B. T., & Lazarian, A. 1998, ApJ, 494, L19
Ferrara, A., & Dettmar, R.-J. 1994, ApJ, 427, 155
Gaustad, J. E., McCullough, P. M., & Van Buren, D. 1996, PASP, 108, 351
Gaustad, J. E., Rosing, W. McCullough, P. M., & Van Buren, D. 1998, in IAU Symp. No. 190, 58
Haffner, L. M. 2000, in Fourth Tetons Summer Conference, eds, M.D. Bicay & C.E. Woodward, ASP Conference Series, in press
Haffner, L. M., Reynolds, R. J., & Tufte, S. L. 1998, ApJ, 501, L83
Haffner, L. M., Reynolds, R. J., & Tufte, S. L. 1999, ApJ, 523, 223
Heiles, C., Haffner, L. M., & Reynolds, R. J. 1999, in New Perspectives on the Interstellar Medium, ASP Confreence Series 168, eds., A. R. Taylor, T. O. Landecker, & G. Joncas (San Francisco:ASP), 211
Kogut, A. 1997, AJ, 114, 1127
Lagache, G., Haffner, L. M., Reynolds, R. J., & Tufte, S. L. 2000, A&A, 354, 247
Marcelin, M., Amram, P., Bartlett, J. G., Valls-Gabaud, D., & Blanchard, A. 1998, A&A, 338, 1
McCullough, P. R., Gaustad, J. E., Rosing, W., & Van Buren, D. 1999 in Proceedings of The Sloan Summit on Microwave Foregrounds, eds., A. de Oliveira-Costa & M. Tegmark (ASP, San Francisco, 1999)
Rand, R. J. 1997, ApJ, 474, 129
Reynolds, R. J. 1985, ApJ, 294, 256
Reynolds, R. J. 1991, in The Interstellar Disk-Halo Connection in Galaxies, IAU Symp. No. 144, ed. H. Bloemen (Dordrecht:Kluwer), p.67
Reynolds, R. J. & Ogden, P. M. 1979, ApJ 229, 942
Reynolds, R. J. & Tufte, S. L. 1995, ApJ, 439, L17
Reynolds, R. J., Tufte, S. L., Kung, D. T., McCullough, P. R., & Heiles, C. 1995, ApJ, 448, 715
Scherb, F. 1981 ApJ, 243, 644
Schlegel, D. J., Finkbeiner, D. P., & Davis, M. 1998, ApJ, 500, 525
Tufte, S. L. 1997, PhD Thesis, University of Wisconsin-Madison
Tufte, S. L., Reynolds, R. J., & Haffner, L. M. 1998, ApJ, 504, 773
Valls-Gabaud, D. 1998, Publ. Astron. Soc. Australia, 15, 111
Wakker, B. P., & van Woerden, H. 1997, ARA&A, 35, 217