Cassiopeia A: on the origin of the hard X-ray continuum and the implication of the observed O viii Ly-/Ly- distribution
We present the first results on the hard X-ray continuum image (up to 15 keV) of the supernova remnant Cas A measured with the EPIC cameras onboard XMM-Newton. The data indicate that the hard X-ray tail, observed previously, that extends to energies above 100 keV does not originate in localised regions, like the bright X-ray knots and filaments or the primary blast wave, but is spread over the whole remnant with a rather flat hardness ratio of the 810 and 1015 keV energy bands. This result does not support an interpretation of the hard X-radiation as synchrotron emission produced in the primary shock, in which case a limb brightened shell of hard X-ray emission close to the primary shock front is expected. In fact a weak rim of emission near the primary shock front is discernable in the hardest X-ray image but it contains only a few percent of the hard X-ray emissivity. The equivalent width of the Fe-K line blend varies by more than an order of magnitude over the remnant, it is hard to explain this as Fe-emission from the reverse shock heated ejecta given the ejecta temperature and the age of the remnant. The uniquely high wavelength-dispersive RGS-spectrometer has allowed, for the first time, to extract monochromatic images in several highly ionised element species with high spectral resolution. We present here a preliminary result on the measurement of the O viii Ly- and Ly- brightness distribution and brightness ratios. The large observed decrease of the Ly-/Ly- ratio going from the N to the SE can be explained by small-scale (10 ″) variations in the column over the remnant and the potential presence of resonance scattering of the O viii Ly- photons in the limb brightened shell.
Key Words.:
ISM: supernova remnants – ISM: individual objects: Cas A – X-rays: ISM1 Introduction
The young galactic supernova remnant (SNR) Cassiopeia A (Cas A) is widely believed to be the result of the core collapse of a massive star, probably an early type Wolf-Rayet star (Fesen et al. fesen (1987)). Cas A is classified as an oxygen rich remnant since optical spectroscopic observations (Chevalier & Kirshner chevalier (1979)) show the supernova ejecta (in the form of fast moving knots) to contain mostly oxygen and oxygen burning products such as sulphur, argon and calcium. At all wavelengths Cas A has the appearance of a broken shell with a radius varying between 1.6′ to 2.5′.
One of the outstanding problems in the study of Cas A is the origin of a recently discovered hard X-ray continuum in the spectrum of this remnant. From a theoretical point of view both synchrotron emission from shock accelerated electrons and non-thermal Bremsstrahlung from electrons accelerated from the tail of the thermal emission could be possible explanations for the hard continuum. In addition, high resolution spatially resolved spectroscopy of the remnant in the X-ray domain is a powerful tool to study in detail the distribution and physical properties of the (reverse) shock heated plasma. The bandwidth (up to 15 keV) of XMM-Newton and the presence of high wavelength-dispersive spectrometers (RGS) offers an unique opportunity to address these questions. In this respect XMM-Newton strongly complements Chandra, and this paper gives a first highlight of this capability.
2 Observations
A description of the instrument is given by Jansen et al. (jansen (2001)). The data were obtained in July 2000 with a net exposure time of 30 ks. The telescope was pointed at the centre of the remnant ( =58°48′20″) and the telescope roll angle was such that the RGS dispersion axis was aligned at 45° (NE) on the sky.
The raw data were processed with the development version of the XMM-Newton Science Analysis System(SAS). The RGS spectra were extracted by applying spatial filters to the spectral image and the spectral order () is selected applying the appropriate pulseheight intervals to the CCD spectral camera.
3 The hard X-ray data
A high-energy tail has been observed in the X-ray spectrum of the supernova remnant Cassiopeia A by the Compton Gamma Ray Observatory (The et al. the (1996)), BeppoSAX (Favata et al. favata (1997)) and the Rossi X-ray Timing Explorer (Allen et al. allen (1997)). Previous hard X-ray imaging observations, for example using BeppoSAX (Vink et al. vink (1999)) indicated that the hard continuum radiation originated predominantly in the W region of the remnant, however this result was based on deconvolved images from a typically 1′ resolution telescope with moderate effective area. The combination of large collecting area in the energy band 4.0 to 12.0 keV and angular resolution of a few arcseconds of XMM-Newton provides us with a unique opportunity to search for the distribution and origin of this hard “tail”.
3.1 The X-ray spectrum above 4.0 keV
Below 4.0 keV the observed spectrum is a complicated combination of spectral lines, continuum emission and the effects of interstellar absorption but above 4.0 keV it is dominated by a smooth continuum and the Fe-K emission line complex. A joint spectral fit of the EPIC MOS and PN spectra was performed in the energy band 4.012.0 keV for the complete remnant. The model included a single Bremsstrahlung component plus a power law continuum with photon index fixed at the previously observed value (Allen et al. allen (1997)) of 1.8 below a break energy of 16 keV. Gaussian line features were used to fit the obvious Fe and Ni line blends. The resulting fit is shown in Fig. 1.
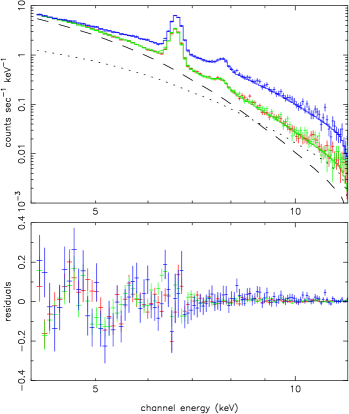
The best fit Bremsstrahlung temperature is keV with emission measure cm-3 for a distance of 3.4 kpc and the power law flux at 1 keV is photons cm-2 s-1 keV-1. The Fe line energy is keV in the MOS and keV in the PN. The errors quoted are statistical only and indicate the high quality of the data, the difference between the MOS and PN values may be attributed to systematic uncertainties which are at present of the order of 10 eV. We estimated the effect of potential pile-up in the PN camera to be not larger than 3 % for the brightest regions. Fig. 1 indeed shows that the MOS spectra, which do not suffer from pile-up, and the PN spectrum are fully compliant. The equivalent width of the Fe line is 1.02 keV for the MOS and 1.11 keV for the PN. The Ni line energy is keV in the MOS and keV in the PN corresponding to Ni xxvi 7.687 keV and/or Ni xxvii 7.799 keV. The equivalent width of the Ni line was 0.130 keV for the MOS and 0.179 keV for the PN. Allen et al. (allen (1997)) fitted the composite spectrum of Cas A over a much broader energy range extending out to 100 keV using two Raymond-Smith collisional ionisation equilibrium (CIE) thermal components with k=0.6 and k=2.9 keV to fit the soft band below 6 keV and a broken power law (=15.9 keV) with photon index 1.8 below and 3.0 above with a flux of 0.038 photons cm-2 s-1 keV-1 at 1 keV. Favata et al. (favata (1997)), from the BeppoSAX observations, obtained a continuum parameterized by two non-equilibrium ionisation (NEI) components with k=1.25 keV, k=3.8 keV and a power law with photon index 2.95 with a normalisation of 0.74 photons cm-2 s-1 keV-1 at 1 keV. It is most important to note that, irrespective of the exact parameterization of these fits, they all share the fact that the X-ray flux above 8 keV becomes dominated by the power law component. More quantitatively, our spectral fit predicts a ratio between the power law and the Bremsstrahlung component in the MOS cameras of 0.29 in the interval 46 keV, 1.04 in the 810 keV band and 2.00 in the 1012 keV hardest band. We shall come back to this point in the next section on the X-ray images.
3.2 X-ray images above 4.0 keV
The MOS and PN images are practically identical. Fig. 2 shows MOS images and Fig. 3 shows combined MOS and PN images.
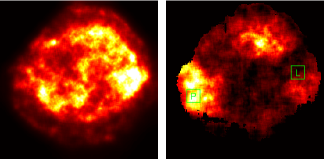
The lefthand panel of Fig. 2 is the continuum map for 4.076.07 keV an energy band in which no bright spectral lines are visible in either the EPIC MOS or PN spectra. The peak of the hard continuum occurs in the large knot to the W but there is also extended emission throughout the volume of the remnant. The outer rim (presumably just behind the blast wave) is visible but is very faint compared with the central volume.
The righthand image of Fig. 2 is the Fe K line equivalent width derived from the narrow energy band 6.206.92 keV. The continuum used to estimate the equivalent width was estimated by interpolation from the bands 4.066.07 keV and 8.1015.0 keV. The Fe line is very bright relative to the continuum on the outer extremities of the SE knots, i.e. region marked P, but is rather weaker in the W where the continuum is bright, i.e. region marked L.
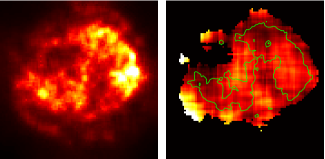
The lefthand panel of Fig. 3 is the hard continuum above the Fe K line, 8.1012.0 keV, which is very similar to the softer continuum image in Fig. 2. In order to try and locate where the hard X-ray tail originates we calculated the hardness ratio (10.015.0)/(8.1010.0) using both the MOS and PN cameras to give the best possible statistics. The result is shown in the righthand panel of Fig. 3. The contour superimposed in green is taken from the hard continuum map 8.1015.0 keV and contains 37 % of the total counts in this energy band, the hardest region in the W contains less than 3 % of the total. The remaining 63 % of the hard flux is spread out over the rest of the remnant. There are significant changes in hardness over the remnant but all the bright features within the green contour have a remarkably similar spectrum above 8.0 keV.
From the spectral fits described in the previous section, it is clear that the photon flux observed in the continuum image in Fig. 3 is dominated by the hard tail (power law) component. XMM-Newton clearly detects the hard X-ray tail from the remnant but the hard X-ray image and the hardness ratio indicate that this flux does not predominate in a few localised regions, but pervades the whole remnant in a distribution similar to the softer thermal components.
3.3 The Fe K emission
Simpler spectral fits using a single Bremsstrahlung and one gaussian line were used to quantify the variation of the continuum and Fe K emission over the remnant. Region L in Fig. 2 corresponds to the brightest hard continuum and a rather low Fe equivalent width and region P to rather weak continuum with the highest Fe K equivalent width. The same model was also used to fit the composite spectrum. The results are summarised in Table 1. The apparent temperature in these fits is a measure of hardness and is higher than the value reported above because the power law continuum has been omitted for simplicity. It is clear that the temperature for the composite fit is similar to that of the small regions (within the statistical accuracy), again indicating that the hard flux is distributed throughout the remnant.
| Parameter | all | L | P |
|---|---|---|---|
| k (keV) | 3.530.02 | 3.410.14 | 3.150.34 |
| (keV) | 6.60 | 6.60 | 6.67 |
| 6.62 | 6.61 | 6.68 | |
| (keV) | 0.950.02 | 0.570.08 | 6.190.56 |
| 1.010.02 | 0.430.18 | 5.280.53 | |
| (keV) | 0.083 | 0.079 | 0.047 |
| 0.078 | 0.042 | 0.031 |
As shown in Fig. 2 and quantified in Table 1 the variation in equivalent width of the iron line is very large. We attempted to fit the composite spectrum from MOS 1 + 2 + PN 4.0712.0 keV with a simple NEI model (see for example Borkowski bork (1994)) plus a power law. The power law was again fixed at index 1.8 and the temperature k fixed at 2.6 keV. This gave a good fit to the continuum with the Fe line blanked out.
A reasonable fit was obtained for an ionisation timescale parameter of s cm-3 or greater. For an age of 340 years, ( seconds) this implies a density of cm-3 which is rather large. This fit gave about the correct equivalent width for the Fe line (assuming solar abundances), but did not fit the line profile very well, presumably because the line is Doppler shifted and/or broadened. It also gave a reasonable fit to the Ni line feature at around 7.7 keV. Lower more reasonable values of the time scale s cm-3 corresponding to a density of 5 cm-3 predict a much larger equivalent width (a factor of 4 too large), a line energy which is too low and no Ni line at 7.7 keV.
Using the same model on region P in the SE where the equivalent width of Fe is very high gave a poor fit. No combination of temperature or time scale could produce a strong enough line at the correct energy. The E knot is clearly anomalous with abnormally high Fe abundance and/or extreme non-thermal equilibrium ionisation.
3.4 Discussion
The spectral form of the non-thermal high-energy “tail” is not inconsistent with a simple model of synchrotron emission from SNRs Reynolds reynolds (1998). However in such a model the electrons need to be accelerated to energies of tens of TeV at the primary shock and the associated synchrotron emission would be expected to be concentrated in the compressed magnetic field just inside the shock front. The hard X-ray continuum maps from XMM-Newton indicates that the 8.015.0 keV flux, predominantly due to the previously reported high-energy tail, does not originate from a few localized regions such as X-ray bright knots and filaments, nor does it originate from a limb brightened (fractionary) shell close to the shock front generated by the primary blast wave. In fact a low brightness outer ring structure, presumably associated with the primary shock, can be discerned in the hard X-ray image but it contains only a few percent of the total hard X-ray flux. Therefore the hard X-ray image is morphologically inconsistent with the simple synchrotron model developed by Reynolds (reynolds (1998)). An alternative explanation for the observation of hard X-ray tails in the spectra of supernova remnants is the presence of non-thermal Bremsstrahlung generated by a population of suprathermal electrons (Asvarov et al. asvarov (1989); Laming laming (2000)). One might expect in this case some degree of correlation with the strong line emitting regions, however abundance variations make this potential correlation ambiguous. A search of Cas A for regions with spectra devoid of line emission, as a possible tracer of synchrotron emission, was unsuccesful although Chandra observations indicated the presence of such a region just beyond the westernmost tip of the N rim of the remnant (Hughes et al. hughes (2000)). We specifically checked this region and still confirm the presence of, relatively weak, line emission, with for example equivalent widths of 200300 eV for the He-like triplet of Si, S and Fe. We cannot exclude some contamination by line emission from neighbouring regions due to the wings of the XMM psf, on the other hand the Chandra data for this region also show line residuals above the continuum fit presented by Hughes et al. In summary we have not spotted any positive evidence, either morphologically or spectrally, for the presence of synchrotron emission in Cas A and, by implication, the associated TeV electrons. Consequently, whether the hard X-ray tail is thermal or non-thermal remains an open question.
4 High-resolution spectroscopic data
4.1 Analysis & results
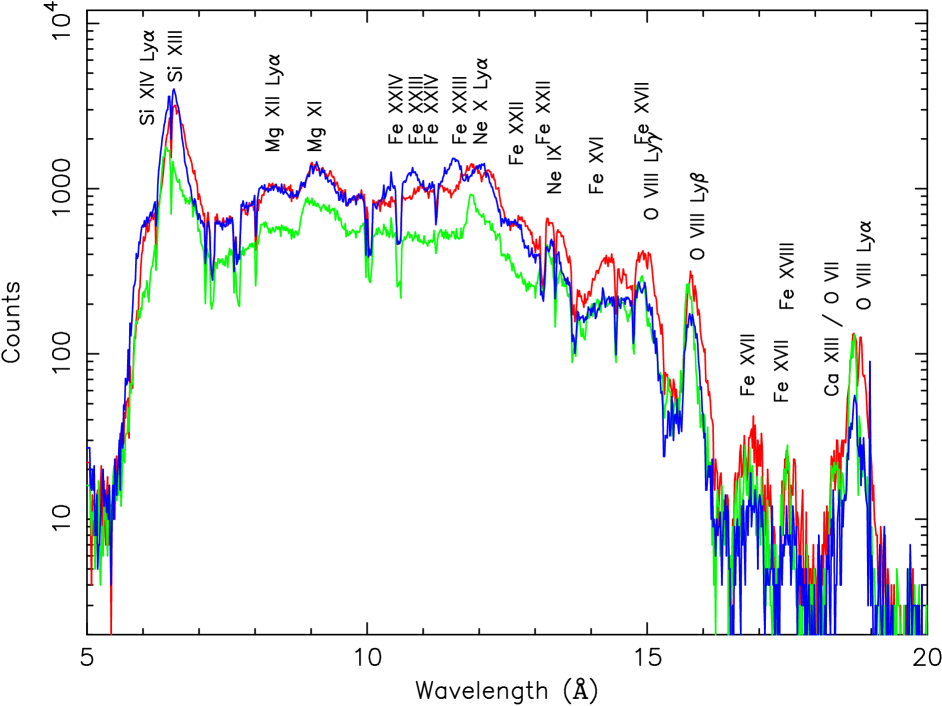
Fig. 4 displays spectra from three extraction regions over the remnant situated in the N, NE and SE of the remnant. The data from RGS1 and RGS2 have been combined in order to increase the statistical weight of the observation. Several lines of highly ionized species of Si, Mg, Ne, Fe L and O are detected in the spectrum. Due to interstellar absorption no features can be measured long-ward of 20 Å. The analysis and interpretation of these spectra will be the subject of a forthcoming paper.
As a first result for this paper we extracted images of the O viii Ly- and Ly- lines to probe small scale variations in absorption effects over this part of the remnant and to investigate the potential presence of resonance scattering in the limb brightened shells viewed edge-on. The temperature range relevant for Cas A has no influence on the Ly-/Ly- ratio. Since RGS is a slitless spectrometer it is possible to extract dispersed monochromatic images of Cas A. These images were converted from wavelength to spatial coordinates using the equation , where is the offset along the dispersion direction, the wavelength shift, the angle of incidence on the gratings and the line distance of the gratings. However, any Doppler broadening is also convolved along the dispersion direction and, depending on its magnitude, Doppler broadening could distort the RGS images.
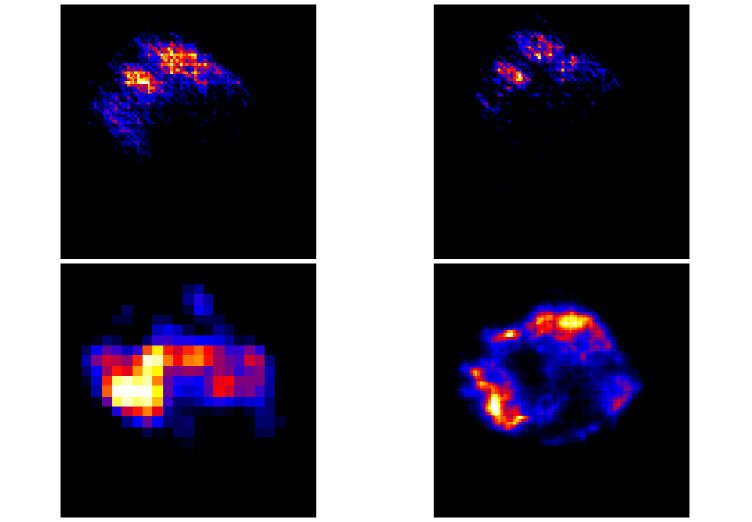
The O viii Ly- and Ly- maps are presented in Fig. 5. The oxygen emission is seen to originate from three blobs on the E and N rim of the remnant. The emission is faintest in the SE blob where there also seems to be a Ly- deficit compared to Ly-. To investigate this we produced cross-dispersion image profiles of the Ly- and Ly- lines by integrating over the dispersion direction. The cross-dispersion profiles together with the Ly- to Ly- ratio have been plotted in Fig. 6 (note that this is the inverse of the ratio plotted in the brightness distribution in Fig. 5 because of the low Ly-/Ly- ratio). The ratio plot seems to steepen gradually from a value of 0.5 to 0.150.20, at a cross-dispersion above +1′. This decrease seems to indicate a Ly- emission deficit in this region. The same effect is seen in the ratio image presented in Fig. 6.

4.2 Discussion
Three possible causes can be identified for explaining the O viii Ly- deficit in the SE part of Cas A, i.e. line blending, variation and resonance scattering.
(1) A line blending effect due to the reduced spectral resolution arising from the finite source extent causes the Ly- line to be ”polluted” by neighbouring lines from the Fe-L complex. Given the limited angular extent of the bright emission region in the dispersion direction, i.e. 1′, and the fact that Cas A is an oxygen-rich remnant, this effect can be neglected, i.e. the oxygen emission lines strongly dominate the Fe-L lines and the spectral resolving power is still adequate (R130).
(2) The potential influence of variations in the column density in this region can be assessed by using the column densities given by Keohane (keohane (1998)). These data take into account both the H i and molecular absorption and have an average resolution of 30″. In the E part of Cas A they centre at cm-2 with a full-width spread ranging from cm-2 (only the bright spot Cas A W shows a larger column of about cm-2). Applying this full range going from N (least absorbed) to the SE bright rim (most absorbed) yields a decrease of the O viii Ly-/Ly- ratio of 1.4. The observed decrease of the Ly-/Ly- ratio, displayed in Fig. 6, appears to be substantially larger, i.e. a factor 3 from about 0.45 to 0.15. Smaller-scale variations could be caused by small scale structure in the value on a 10″ angular scale. To fully explain the decrease observed a column density variation of cm-2 (i.e. from cm-2) would have to be present, which seems rather unlikely.
(3) Alternatively a decrease in the Ly-/Ly- ratio could also be introduced by the presence of resonance scattering of the O viii Ly- photons in the X-ray bright rims if viewed edge-on (Kaastra & Mewe kaastra (1995)). A factor of 23 reduction in Ly- intensity can be explained by an optical depth in the Ly- line of 2 or more (following the discussion in Kaastra & Mewe). For typical conditions in the rims of Cas A, an optical depth larger than 2 is expected to be present if the micro turbulent velocity is smaller than 700 km/s.
Acknowledgements.
The results presented are based on observations obtained with XMM-Newton, an ESA science mission with instruments and contributions directly funded by ESA Member States and the USA. We thank the referee J. Ballet for his helpful comments and suggestions.References
- (1) Allen G.E., Keohane J.W., Gotthelf E.V., et al., 1997, ApJ 487, L97
- (2) Asvarov A.I., Guseinov, O.H., Kasumov, F.K., Dogel’, V.A., 1990, A&A 229, 196
- (3) Borkowski K.J., Sarazin C.L., & Blondin J.M., 1994, ApJ 429, 710
- (4) Chevalier, R.A., Kirshner, R.P., 1979, ApJ 233, 154
- (5) Favata F., Vink, J., dal Fiume, D., et al, 1997, A&A 324, L49
- (6) Fesen, R.A., Becker, R.H., Blair, W.P, 1987, ApJ 313, 378
- (7) Hughes, J.P., Rakowski, C.E., Burrows, D.N., Slane, P.O., 2000, ApJ 528, L109
- (8) Jansen, F.A., Lumb, D., Altieri, B. et al. 2001, A&A, 365 (this issue)
- (9) Kaastra, J.S., Mewe, R., 1995, A&A 302, L13
- (10) Keohane, J.W., 1998, Ph.D. Thesis, NASA/CR-1998-206893
- (11) Laming, J.M., 2000, accepted for ApJ (astro-ph/0008426)
- (12) Reynolds S.P., 1998, Ap.J. 493, 375
- (13) The L.-S., Leising, M.D., Kurfess, J.D., et al, 1996, A&AS 120, 357
- (14) Vink J., Maccarone, M.C., Kaastra, J.S., et al, 1999, A&A 344, 289