Bipolar outflows in OH/IR stars
Abstract
We investigate the development of bipolar outflows during the early post-AGB evolution. A sample of ten OH/IR stars with irregular OH spectra and unusually large expansion velocities is observed at high angular resolution. The sample includes bipolar nebulae (e.g. OH231.8+4.2), bright post-AGB stars (HD 101584) and reflection nebulae (e.g. Roberts 22). The IRAS colour–colour diagram separates the sample into different types of objects. One group may contain the immediate progenitors to the (few) extreme bipolar planetary nebulae. Two objects show colours and chemistry very similar to the planetary nebulae with late IR-[WC] stars. One object is a confirmed close binary.
A model is presented consisting of an outer AGB wind which is swept up by a faster post-AGB wind, with either the AGB or Post-AGB wind being non-spherically symetric. The interface of the two winds is shown to exhibit a linear relation between velocity and distance from the star, giving the impression of an accelerating outflow. The OH data confirms the predicted linear velocity gradients, and also reveals torus-like, uniformly expanding components.
All sources are discussed in detail using optical/HST images where available. ISO data for Roberts 22 reveal a chemical dichotomy, with both crystalline silicates and PAHs features being present. IRAS 163423814 shows a dense torus with mass and density of ; HST data shows four point-like sources located symmetrically around the nebula, near the outer edge of the dense torus.
Lifetimes for the bipolar OH/IR stars are shown to be in excess of yr, longer than normal post-AGB timescales. This suggests that the toruses or disks are near-stationary. We suggest that accretion from such a disk slows down the post-AGB evolution. Such a process could explain the link between the long-lived bipolar nebular geometry and the retarded star.
keywords:
Masers – OH/IR stars – Post-AGB stars – (Proto-) Planetary Nebulae1 Introduction
Stars at the end of the Asymptotic Giant Branch (AGB) experience a phase of high mass loss during which they expel most of the material from their outer atmospheres and form optically-thick circumstellar envelopes (CSEs) (e.g. Schönberner 1989; for a review see Habing 1996). After the cessation of the mass loss, the star heats up rapidly and eventually begins to ionize the expanding envelope. During the post-AGB evolution, a fast wind from the hot star sweeps up the earlier slow AGB wind to form a planetary nebula (PN) (Kwok, Purton & Fitzgerald 1978).
Approximately half of all PNe show bipolar structures. A bipolar structure may form if the slow AGB wind possesses an asymmetry, which will be amplified by the post-AGB wind–wind interaction (Icke 1988). Hydro-dynamical models predict the eventual formation of a dense, slowly expanding equatorial torus, with a faster outflow weakly collimated within two polar cones (Kahn & West 1985; Balick, Preston & Icke 1987; Icke 1988; Frank & Mellema 1994). The predicted structures compare well with the observed range of morphologies of PNe (e.g. Górny et al. 1999).
This interacting-wind model predicts that the AGB wind will show deviations from spherical symmetry. Present evidence shows that the outer winds of AGB stars have a high degree of symmetry. In the OH 1612 MHz survey of te Lintel Hekkert et al. (1991), only 16 out of 852 OH/IR stars showed irregular line profiles. Sevenster et al. (1997a,b) also found almost exclusively regular profiles. The inner wind may be less symmetric, however. Optical interferometry (e.g. Tuthill et al. 1994; Bedding et al. 1997) has shown elongation of the stellar photospheres, and OH main-line masers of Mira variables have shown axi-symmetric structures (Bowers, Johnston & de Vegt 1989; Chapman & Cohen 1985; Chapman, Cohen & Saikia 1991; Chapman et al. 1994). Johnson & Jones (1991) found significant optical and infrared polarization in AGB and post-AGB stars.
The second prediction of the interacting-wind model is that strongly bipolar morphologies will only develop once the star is hot enough to exhibit a fast wind. Asymmetries during the early post-AGB evolution should not yet be amplified, since these stars are too cool (stellar temperature between 5000 and 15000 K) to have a hot wind. However, images of early post-AGB objects show a large proportion of highly bipolar morphologies, in sharp contrast with the model prediction. In combination with the insufficient evidence for significant asymmetries in the AGB winds, this indicates that the standard model is incomplete. Sahai & Trauger (1998) therefore propose that early in the post-AGB evolution, a fast jet-like wind operates. An alternative possiblity is that at the very end of the AGB, the mass loss suddenly becomes strongly equatorially enhanced, caused by e.g. the spiral-in of a Jupiter-like companion.
In this study we present aperture-synthesis observations of the OH maser emission from one or more of the ground-state transitions at 1612, 1665 and 1667 MHz, for 10 likely post-AGB stars with unusually broad and irregular spectral profiles. The principal aim of this study is to investigate the envelope geometries of post-AGB stars and to determine whether these can be explained using a wind-wind interaction model.
Section 2 below describes the OH properties of post-AGB stars and the selection of targets. Section 3 describes the observations. Section 4 discusses momentum-driven wind–wind interactions and gives a geometric model which is used to interpret the results. Section 5 describes the results and their interpretation for individual sources. In Section 6 we discuss the nebular and stellar parameters, lifetimes, two proposed evolutionary sequences and the possible effects of Post-AGB accretion on the stellar evolution. Conclusions are summarized in Section 7.
2 Properties of post-AGB stars
2.1 OH Maser emission
An oxygen-rich CSE may exhibit one or more of the OH 18-cm maser lines at 1612, 1665 or 1667 MHz (e.g. Elitzur 1992). For stars with mass-loss rates above a few 10-7 M⊙ yr-1, the strongest OH maser emission occurs from the satellite line () at 1612 MHz (e.g. Cohen 1989) while for stars with lower mass-loss rates the strongest emission is usually from the OH mainlines () at 1665 and 1667 MHz.
During the post-AGB phase, the OH lines may remain observable for a period of 1000 years (Sun & Kwok 1987). The OH properties of post-AGB stars have been discussed previously by Zijlstra et al. (1989). The maser profiles will become irregular because of the reduced coherence amplification lengths. The 1667 MHz emission becomes relatively stronger and may become dominant (Field 1985, Field & Gray 1988). The OH expansion velocity may increase due to the fact that the AGB/post-AGB wind will become faster as the spectral type of the star becomes earlier. Some post-AGB stars show pronounced but non-periodic variability in the OH maser emission and this may be a common feature of the early post-AGB stars, e.g., OH0.9+0.3 for which the OH flux density was observed to increase over many years at a rate of 1 Jy yr-1 (Shepherd et al. 1989; Zijlstra et al. 1989). Strong circular polarization has been detected from the post-AGB sources OH231.8+4.2 and IRAS 16342-3814, indicating embedded magnetic fields (e.g. Szymczak, Cohen & Richards 1998).
Table 1 is a compilation of stellar sources with unusual OH maser properties, consistent with a possible classification as post-AGB stars.The sources were selected to have OH maser emission with a velocity range of at least 50 km s-1 in one or more of the OH lines, and a spectrum with an emission plateau and/or more than two spectral features. We used the surveys for OH maser emission from IRAS sources with the far-infrared colours of high mass-loss AGB stars (Lewis, Eder & Terzian 1985; Eder et al. 1988; te Lintel Hekkert et al. 1991; te Lintel Hekkert & Chapman 1996). Table 1 however does include a small number of massive supergiant stars which have higher outflow velocities than OH/IR stars. Examples in this category are VY CMa, NML Cyg and PZ Cas. The large expansion velocities in our selection criteria are not a-priori predicted for post-AGB stars and only a biased subset of all post-AGB stars may have been selected. For completeness we include a few carbon-rich post-AGB sources in Table 1 with similarly high outflow velocities, although these do not show OH maser emission.
From the sources listed in Table 1, we selected 10 sources (indicated by an asterisk after the source name) for aperture synthesis observations.
| IRAS | RA | Dec | f12 | f25 | Name | Morphology | Refs | ||
| (B1950) | (B1950) | (Jy) | (Jy) | (km s-1) | |||||
| 043953601 | 04 39 34.1 | +36 01 15 | 471 | 1106 | CRL618 | - | 400 | Bipolar | 1,2 |
| 072092540 | 07 20 55.6 | 25 40 17 | 9919 | 6651 | VY CMa | 57 | 65 | 3,4 | |
| 073991435* | 07 39 59.2 | 14 35 42 | 19.0 | 226 | OH231.8+4.2 | 100 | 200 | Bipolar | 5,6,7,10 |
| 080052356* | 08 00 32.5 | 23 56 16 | 18.0 | 51.8 | 100 | - | Bipolar | 8,9,12 | |
| 093711212 | 09 37 11.6 | +12 12 31 | 0.27 | 4.6 | Frosty Leo | - | 80 | Bipolar | 38 |
| 101975750* | 10 19 44.8 | 57 50 32 | 200 | 1092 | Roberts 22 | 52 | 50 | 11,13,14 | |
| 104816930 | 10 48 08.8 | 69 30 03 | 36.0 | 45.7 | 51 | - | 9 | ||
| 10491-2059 | 10 49 11.4 | 20 59 06 | 1110 | 460 | V Hya | - | 200 | 34 | |
| 113855517* | 11 38 33.9 | 55 17 49 | 92.6 | 138 | HD 101584 | 84 | 300 | Bipolar | 10,15,16,17 |
| 133286244 | 13 32 52.6 | 62 44 01 | 110 | 144 | 50 | - | 9 | ||
| 134426109 | 13 44 17.7 | 61 09 30 | 389 | 285 | 50 | - | 18 | ||
| 140285836 | 14 02 50.5 | 58 36 23 | 23.6 | 40.4 | 50 | - | 19 | ||
| 153035456 | 15 30 20.6 | 54 56 45 | 40.4 | 59.6 | 50 | - | 19 | ||
| 154054945* | 15 40 32.1 | 49 45 54 | 2.4 | 26.5 | 175 | - | Bipolar | 10,20 | |
| 154525459 | 15 45 17.0 | 54 59 42 | 87.1 | 243 | 80 | - | 10 | ||
| 155095207 | 15 50 59.0 | 52 07 41 | 59.5 | 93.2 | 60 | - | 19 | ||
| 163334654 | 16 33 21.8 | 46 54 38 | 44.3 | 54.9 | OH337.5-0.1 | 52 | - | 3,19 | |
| 163423814* | 16 34 17.1 | 38 14 18 | 16.2 | 200 | 140 | - | Bipolar | 10,20,21 | |
| 163834626 | 16 38 19.3 | 46 26 33 | 15.0 | 21.2 | OH338.5-0.2 | 54 | - | 3 | |
| 170793844 | 17 07 57.0 | 38 44 40 | 32.0 | 19.6 | 54 | - | 9 | ||
| 172532831* | 17 25 23.6 | 28 31 04 | 1.4 | 20.1 | 52 | - | 9 | ||
| 173933004 | 17 39 22.4 | 30 04 20 | 256 | 218 | 53 | - | 3 | ||
| 174231755* | 17 42 18.8 | 17 55 36 | 7.1 | 28.3 | He3-1475 | 55 | - | Bipolar | 10,23,24 |
| - | 17 42 33.6 | 28 58 03 | 359.970-0.049 | 50 | - | 25 | |||
| - | 17 43 58.9 | 28 28 52 | 0.548-0.059 | 50 | - | 25 | |||
| 180522016 | 18 05 17.9 | 20 16 42 | 21.4 | 32.5 | OH10.0-0.1 | 57 | - | 3 | |
| 180911815 | 18 09 07.6 | 18 15 11 | 22.1 | 38.0 | OH12.3+0.1 | 67 | - | 3 | |
| 182461032 | 18 24 37.9 | 10 32 30 | 2.2 | 20.3 | OH20.8+0.5 | 55 | - | 3 | |
| 18 33 00.0 | 08 04 03 | OH24.0-0.2 | 64 | - | 3 | ||||
| 183491023 | 18 34 57.8 | +10 23 04 | 720 | 319 | IRC+10365 | 51 | 35 | 3,4 | |
| 184910207* | 18 49 10.7 | 02 07 48 | 5.5 | 23.2 | 180 | - | 10,23 | ||
| 185850900 | 18 58 30.2 | +09 00 43 | 56.8 | 63.5 | 62 | - | 27 | ||
| 190521431 | 19 05 16.8 | +14 31 59 | 2.9 | 3.0 | 59 | - | 27 | ||
| 191140002 | 19 11 25.0 | +00 02 18 | 31.3 | 648 | HD 179821 | 60 | 80 | 8,28,29 | |
| 192441115 | 19 24 26.3 | +11 15 09 | 1346 | 2314 | IRC 10420 | 60 | 104 | Bipolar | 30,31,32 |
| 195001709 | 19 50 01.5 | 17 09 38 | 27.8 | 165 | SAO 163075 | - | 85 | Bipolar | 28,13 |
| 21 00 19.9 | +36 29 45 | CRL2688 | - | 85 | Bipolar | 33 | |||
| 20 44 34.0 | +39 55 54 | NML Cyg | 68 | - | 36, 37 | ||||
| 220365306* | 22 03 40.0 | +53 06 55 | 8.4 | 46.3 | 80 | - | 10,21 | ||
| 234166130 | 23 41 39.1 | +61 30 43 | 373 | 398 | PZ Cas | 53 | - | 3, 35 | |
References: 1) Cernicharo et al. 1989; 2) Kwok & Bignell 1984; 3) te Lintel Hekkert et al. 1989 (and ref. therein); 4) Loup et al. 1993; 5) Morris et al. 1987; 6) Icke & Preston 1989; 7) Reipurth 1987; 8) Likkel 1989; 9) te Lintel Hekkert et al. 1991; 10) te Lintel Hekkert & Chapman 1996; 11) Allen, Hyland & Caswell, 1980; 12) Slijkhuis, de Jong & Hu 1991; 13) Bujarrabal & Bachiller 1991; 14) Sahai et al. 1999a; 15) This paper; 16) Trams et al. 1990; 17) Loup et al. 1990; 18) Gaylard et al. 1989; 19) Gaylard & Whitelock 1989; 20) te Lintel Hekkert et al. 1988; 21) Sahai et al. 1999b; 22) Zijlstra et al. 1989; 23) te Lintel Hekkert 1991; 24) Bobrowski et al. 1995; 25) Lindqvist et al. 1992; 26) Eder, Lewis & Terzian 1988; 27) Lewis, Eder & Terzian, 1985; 28) Likkel et al. 1987; 29) Zuckerman & Dyck 1986; 30) Mutel et al. 1979; 31) Diamond, Norris & Booth 1983; 32) Knapp & Morris 1985; 33) Kawabe et al. 1987; 34) Knapp, Jorissen & Young 1997; 35) Dickinson & Chaisson 1973; 36) Wilson & Barret 1968; 37) Diamond, Norris & Booth 1984; 38) Sahai et al. 2000
2.2 IRAS colours
Fig. 1 shows the IRAS colour–colour diagram for the sources of Table 1 for which good IRAS data is available. The axes are defined as and .

The sources selected for maser observations are shown as encircled points. Some additional objects of interest, discussed in Section 6, are also plotted. Triangles indicate highly bipolar PNe and squares post-AGB stars with mixed C/O chemistry, which may be evolutionary related to the present sample (see Section 6.3). The boxes indicate the regions of the colour-colour diagram where different types of objects are clustered. The box labeled ’outflow sources’ contains a mixture of both young (Emerson 1987) and evolved (e.g. Zijlstra 1991) stars with fast bipolar outflows.
Of the ten sources discussed in this paper, three have colours consistent with AGB/post-AGB evolution: IRAS 080052356, Roberts 22, and IRAS 172532831. The last object has colours corresponding to extremely high, on-going mass loss (evolved PNe may show similar colours but are much fainter and show no OH). The colours of Roberts 22 and IRAS 080052356 can be explained in terms of a detached CSE. One source, IRAS 184910207, has far-infrared colours consistent with HII regions.
He3-1475, IRAS 22036+5306, OH231.8+4.2 and IRAS 16342-3814, are located among the outflow sources. HD 101584 could also be in this group: its colours are at best marginally consistent with normal OH/IR stars. IRAS 154054945 was not detected at 12m, but may also fall among the outflow sources.
Half the selected stars have colours different from those expected for normal post-AGB evolution.
3 Observations
For each of the ten sources indicated in Table 1, observations were
taken between 1986 and 1992 in one or more of the OH transitions at
1612, 1665 or 1667 MHz, using the Very Large Array (VLA), the Jodrell
Bank MERLIN array, the Australia Telescope Compact Array (ATCA) and
the Australian Parkes–Tidbinbilla Interferometer (PTI). The
observations are summarised in Table 2, the columns of which are as
follows:
i) IRAS name
ii) OH transition observed
iii) rms level in the OH images (mJy)
iv) Vres, the velocity resolution (km s-1)
v) BW, the bandwidth of the spectral channels (kHz)
vi) , the total number of channels used
vii) the array used
viii) the longest baseline of the array (km)
ix) the angular resolution (arcsec)
x) the polarisation(s) observed
xi) the date of the observations
The VLA observations were taken using 27 25-m telescopes in either the A or A/B array configuration, with a maximum baseline of 36 km corresponding to a highest angular resolution of one arcsecond. For all southern sources the angular resolution is lower in the North–South direction. The observations were taken in both left and right-circular polarisation with integration times of 10–25 minutes per source, making use of the good instantaneous u-v coverage provided by the VLA. Several different spectral-line observing configurations were used, with total bandwidths between 0.2 and 3.1 MHz and velocity resolutions between 0.5 and 8.8 km s-1. IRAS163423814 was observed at two settings for the central velocity, because it shows two groups of maser lines with a large separation in velocity, indicated in Table 2 as L (low) and H (high) respectively.
MERLIN observations were taken for the source IRAS 080052356 using four telescopes at Lovell, Darnhall, Knockin and Defford. The source was observed using left circular polarisation for a total integration time of approximately six hours. The longest baseline of 127 km, from Lovell to Defford, corresponds to a smallest angular resolution of 0.3 arcsec. The MERLIN correlator gave 160 delay channels per baseline. The data were weighted with a triangular weighting function and were Fourier transformed and averaged to give visibility amplitudes and phases for 64 frequency channels across the spectrum, with a velocity resolution of 0.9 km s-1.
The ATCA data were taken using six 22-m telescopes on an East–West track with a maximum baseline of 6 km. Each source was observed for between 5 and 10 hours using two linear polarisations. A spectral bandwidth of 8 MHz was used, split into either 512 or 1024 spectral channels to give a velocity resolution of either 1.7 or 3.4 km s-1.
The VLA, MERLIN and ATCA data were analysed using standard routines from the AIPS radio astronomy package. The visibility amplitudes and phases were first corrected for atmospheric amplitude and phase variations, either by phase referencing to a nearby continuum source, or by self calibration using the spectral channel with the strongest OH emission. The visibility data were also corrected for bandpass variations and any continuum emission was removed. For the VLA and ATCA data, total-intensity (Stokes I) spectral-line cubes showing the OH emission in each spectral channel were then obtained by Fourier-inverting the data and using the standard clean procedure. For the MERLIN data, images were obtained for left circular polarisation only. For each source and OH line, the spectral line cube was searched for emission features above a detection threshold of three times the rms level. The positions and total flux densities of the emission features were obtained using the AIPS task JMFIT which is a two-dimensional Gaussian fitting procedure.
The PTI (Parkes-Tidbinbilla Interferometer) is a two-element real-time radio-linked interferometer using the 64-m Parkes radiotelescope and the 70-m NASA Deep Space network antenna at Tidbinbilla (Norris et al. 1988). The resolution is 0.13 arcsec at 1612 MHz. PTI observations of IRAS 10197-5750 (Roberts 22) were taken at 1665 MHz in 1986 December and at 1612 MHz in 1987 February, using a bandwidth of 0.5 MHz divided into 256 complex frequency channels. Left circular polarisation was used. The observations were taken by alternating between two sources for a period of about 12 hours, giving for each source a total of about five hours integration time with a full 12-hour u-v coverage. The single, long baseline of 275 km resolves out the extended OH flux and the fringes detect the compact maser spots. It is therefore ideal for the determining very accurate positions for small components.
The PTI data were analysed using a technique in which one ‘reference’ maser feature was chosen for its strong and constant amplitude, which was assumed to be unresolved. The phase of this reference feature was then subtracted from the phases of all other features, thereby performing a phase correction for all atmospheric, ionospheric, and instrumental effects. The residual phases are a sinusoidal function of the positional offset from the reference feature, and so the relative positions in both right ascension and declination were obtained by fitting a sinusoid to the phase. The typical positional accuracy is about 0.01 arcsec in both right ascension and declination.
| IRAS | OH | rms | BW | array | longest | angular | pol. | date | ||
|---|---|---|---|---|---|---|---|---|---|---|
| line | used | baseline | resol. | |||||||
| (MHz) | (mJy) | (km s-1) | (kHz) | (km) | (arcsec) | |||||
| 073991435 | 1667 | 7 | 2.2 | 12.2 | 128 | VLA | 30 | 1.0 | I | 31/10/88 |
| 080052356 | 1612 | 8 | 0.9 | 4.9 | 64 | MERLIN | 128 | 0.3 | L | 24/04/88 |
| 1612 | 7 | 2.2 | 12.2 | 64 | VLA | 30 | 1.0 | I | 15/05/90 | |
| 1667 | 7 | 2.2 | 12.2 | 64 | VLA | 30 | 1.0 | I | 15/05/90 | |
| 101975750 | 1612 | 5 | 0.4 | 2.0 | 256 | PTI | 275 | 0.1 | L | 02/02/87 |
| 1665 | 5 | 0.4 | 2.0 | 256 | PTI | 275 | 0.1 | L | 07/12/86 | |
| 1665 | 15 | 1.7 | 7.8 | 1024 | ATCA | 6 | 6.0 | I | 29/06/92 | |
| 1667 | 15 | 1.7 | 7.8 | 1024 | ATCA | 6 | 6.0 | I | 29/06/92 | |
| 113855517 | 1667 | 5 | 3.4 | 15.6 | 512 | ATCA | 6 | 6.0 | I | 26/08/91 |
| 154054945 | 1667 | 20 | 3.4 | 15.6 | 512 | ATCA | 6 | 6.0 | I | 26/08/91 |
| 1665 | 20 | 3.4 | 15.6 | 512 | ATCA | 6 | 6.0 | I | 26/08/91 | |
| 163423814 | 1612L | 20 | 0.5 | 3.0 | 64 | VLA | 30 | 1.0 | I | 15/05/90 |
| 1612H | 25 | 0.5 | 3.0 | 64 | VLA | 30 | 1.0 | I | 15/05/90 | |
| 172532831 | 1612 | 10 | 2.2 | 12.2 | 128 | VLA | 30 | 1.0 | I | 30/10/88 |
| 174231755 | 1667 | 20 | 1.1 | 6.1 | 128 | VLA | 30 | 1.0 | I | 31/10/88 |
| 184910207 | 1667 | 6 | 8.8 | 48.8 | 64 | VLA | 30 | 1.0 | I | 31/10/88 |
| 22036+5306 | 1612 | 20 | 2.2 | 12.2 | 64 | VLA | 30 | 1.0 | I | 15/05/90 |
| 1665 | 35 | 2.2 | 12.2 | 64 | VLA | 30 | 1.0 | I | 15/05/90 | |
| 1667 | 20 | 2.2 | 12.2 | 64 | VLA | 30 | 1.0 | I | 15/05/90 |
4 Wind–wind models and velocity structures
4.1 A wind–wind model for bipolar emission
The standard interacting wind model assumes that the fast wind has a velocity of order . However, the stellar wind during the early post-AGB evolution is very much slower. Here we will discuss two interacting winds with velocities up to a few 100 km/s. At these speeds the interface between the winds is momentum-driven rather than energy-driven.
Shu et al. (1991) have calculated the velocity structures expected from a , spherically symmetric stellar wind expanding into a dense medium that has a density profile of , with the distance along the polar axis. Such a model can explain the bipolar outflows seen around young stars (e.g. Barral & Canto 1981; Frank et al. 1993). (An alternative model where bipolar structure formation is driven by a jet is described by e.g. Hatchell, Fuller & Ladd, 1999; MHD models which create bipolar structures are discussed in Garcia-Segura et al. 1991). The swept-up material forms two expanding bubbles on either side of the denser equatorial region. At any point along the surface of the bubbles, the velocity is radial with respect to the central star, and is proportional to distance along the polar axis, . If the opening angle of the cone does not vary greatly with , the observed velocity would appear to increase linearly with radial distance and give the appearance of a linearly accelerating outflow.
Velocities increasing with distance from the star has been observed both from unusual OH/IR stars (as shown in this paper) and from PNe (e.g., MyCn18: Bryce et al. 1997; Fleming 1: Lopez, Meaburn & Palmer 1993). The Shu et al. model cannot be applied directly to post-AGB stars or PNe. However, the observed similarities between the two categories suggest that a similar model may apply to post-AGB stars: Jet-like structures observed in a few post-AGB stars bear a striking resemblance to Herbig-Haro objects associated with young stars (Bobrowski et al. 1995; Riera et al. 1995; Bujarrabal et al. 1998), and their IRAS colours (Fig. 1) are also very similar. To adapt the Shu et al. model to the post-AGB evolution, we discuss the problem where a faster, inner wind (subindexed ) collides with a slower, outer wind (subindexed ), at velocities sufficiently low that the wind–wind interaction is momentum-driven. Both the AGB wind and the faster inner wind are assumed to be expanding at terminal (time-independent) velocity, and mass-loss rate, , where and of either wind may have a polar dependence. The wind–wind collision produces a compressed shell of material which extends into the outer wind. To allow for the polar dependence, we define an effective mass-loss rate :
where is the element solid angle centred on the star and is the angle with the pole. The density of the wind at a distance from the star is
The compressed shell moves at a given moment with a velocity , and has a surface density . It is composed of gas from the outer wind, swept up at a velocity relative to the shell, and gas from the inner wind which reaches the shell with a velocity . All the gas flows are assumed to be radial, so that each radial direction, characterized by , can be treated independently. Mass conservation implies
and momentum conservation implies that
where all variables implicitedly depend on . Developing the derivatives and using eq. (1), we obtain:
Multiplying eq. (4) by , isolating the term with the derivative of in eq. (4), and replacing it in eq. (5), yields:
We now have the system
In general, , , of the compressed shell are functions of time. A power-law dependence with time often provides a well-behaved solution to the evolution of radius, velocity, and surface density in scale-free scenarios involving a central source of momentum and energy, as is the present case. Therefore, we have tried to find a non-trivial solution by assuming that power law solutions are possible. If power laws are solutions of eqs. (7) and (8), then both the left- and right-hand sides of eqs. (7) and (8) must also be power laws. Given that the right-hand sides of these equations contain constant terms as summands, the only way to satisfy this condition is that the products of power laws on the left-hand sides be independent of time. Now consider the right-hand side of eq. (7), where the only quantity that may vary is the expansion velocity : the only way of producing a time-independent combination of the quantities that appear there is by assuming that is time-independent, which in turn implies that both sides of eq. (7) are zero. Taking this into account, the right-hand side of eq. (8) becomes time-independent if , so that the product is constant. If this is the case, then the product that appears on the left-hand side of eq. (8) is indeed constant and non-zero, proving that the proposed solution is indeed consistent.
For a time-independent , the right-hand side of eq. (7) is zero. This provides a second-degree equation in , whose meaningful solution is
where
All the terms in eq. (9) may be direction-dependent. The other variables of the problem can be evaluated in a straightforward manner:
A time-independent implies that since . A polar dependence in one of the two winds will lead to a non-spherical compressed shell, with a function of . We therefore find that the velocity . The linear velocity gradients found by Shu et al. for young objects are also recovered for evolved stars. Below we will use the term ‘linear outflow’ for such a component. Note that the relation does not assume any particular geometry, nor does it depend on which wind has the polar dependence.
The velocity of the compressed shell can have large variations with , even if is small (as is expected for a post-AGB wind) and is constant, since the term in the square brackets can have an amplitude of order unity. Eq. (10) shows that will increase significantly over if, in some direction , the momentum in the fast wind becomes comparable to the momentum in the AGB wind: . As an example, if and , then ; for , . This estimate shows that (and therefore ) may vary by a factor of the order of 2 over the shell. Much larger values would require a much faster post-AGB wind for which energy-driven models such as Icke (1988) are more appropriate.
As an aside, the significant variations possible in are a consequence of having maintained the term in eq. (7); if this term is zero or negligibly small in all directions, and is independent of , then it is possible for the two winds to have a large density dependence on , but for the compressed shell to be nearly spherical. In other words, if the two winds are self-similar in their density distributions, then a spherical shell can result even when the density distributions are highly direction-dependent.
4.2 The model applied to OH/IR stars
The model above calculates the true space velocity and true distance from the star for each point on the compressed shell. But only the projected radial velocity and the projected distance can be observed. Therefore a geometrical model is required to obtain observable quantities, even though the calculations above are valid for any geometry.
For ‘classical’ OH/IR stars, the OH 1612 MHz maser distributions are located in a thin shell of constant radius, , expanding at a constant velocity (e.g. Booth et al. 1981; Diamond et al. 1985; Chapman & Cohen 1985; Welty, Fix & Mutel 1987). (The physical location of this shell is determined by the radius at which the external interstellar UV radiation field causes dissociation of H2O, which is the source of the OH (Huggins & Glassgold 1982), and by the internal infrared radiation field, expecially the 35-m photons which pump the maser inversion.) At the extreme blue and red-shifted velocities the strongest maser emission occurs from small regions at the front and back of the envelope centred on the line-of-sight through the star, where the amplification path length is longest. At an intermediate velocity, , weaker emission occurs from a ring of projected radius given by
where is the stellar velocity (e.g. Reid et al. 1977; Herman 1983; Herman et al. 1985). Plots of against may be used to determine the parameters , and .
In the interacting-winds scenario, OH emission may be observed from the swept-up shell (the linear outflow) or from the outer undisturbed AGB wind. The swept-up shell will contain OH if its radius is larger than the H2O dissociation radius, and the OH masers will travel with the swept-up gas (in contrast to AGB stars where the OH maser shell remains at the same radius). If the star is in the post-AGB phase, there are two other differences with AGB shells: (1) the present, faster wind may be atomic rather than molecular; (2) the hotter star may dissociate the H2O molecules also from the inside leaving the entire shell OH-rich. As a consequence, the OH maser shell in the outer AGB wind will now also expand with the gas.


The assumed geometry is indicated in Fig. 2a, and consists of a spherically symmetric, thin shell representing the outer AGB wind (expanding uniformly in all directions), with superposed a biconal or ‘hourglass’-shaped structure (the wind bubbles) representing the interaction between the two winds. The AGB shell (which may also represent a swept-up shell, especialy in the post-AGB phase) is punctured by the cones: if the cones are wide, it becomes cylinder- or torus-like. At large radii the bubbles are expected to close (Icke 1988): this is not included in our model. Along the surface of the cones, the gas flows are radial away from the central star, with velocity increasing linearly with distance from the star. The linear outflow is assumed to start at the radius of the thin torus/AGB shell, with continuity in the velocity at that radius. The separate panel in Fig. 2a shows the predicted - relation for different parts of this geometry111Note that is defined as the angular distance between star and shell, whereas (Section 3) is defined as the linear radius of the shell..
The AGB shell gives rise to the elliptical distribution of points in the - panel. If radial amplification dominates, the strongest OH emission tracing the linear outflow will come from the lines on the surface of the cones closest to the line of sight (dotted lines in Fig. 2a). (Neutral gas is optically thin at these cm wavelengths so that both the front and the back will be visible in OH.) Emission located elsewhere on the cones is less beamed and would normally be fainter or invisible, with a few exceptions: (1) If the maser is amplifying continuum emission from within the cone, the emission from the facing sides of both cones will become stronger (the dotted line on the blue-shifted cone and the dash-dotted line on the red-shifted cone).This may occur if shock-ionization has occurred within the fast wind, filling the cone with ionized gas. (2) If the interface is thin, tangential emission may dominate. In this case the strongest emission would come from the sides of the cone as seen projected on the sky. (3) If the surface of the cones is very thin, non-beamed emission would be seen from the entire surface of the cone. At each distance , this emission would fall within a velocity range determined by the opening angle of the cone.
Radial amplification gives rise to the highest observed velocity gradient (the most horizontal lines in the panel), symmetric for both cones. If continuum amplification occurs, the lowest velocity gradient will be observed for the red-shifted cone.
The precise observed - relations depend on the opening angle of the outflow cones, , and the inclination angle between the line of sight and the equatorial plane, . Fig. 2b shows the predicted diagrams for a range of () pairs. The projected edges of the cones are shown using smaller symbols. If the line-of-sight lies within the opening angle of the cone then the torus will not be seen at the maximum outflow velocity: e.g., the top row of diagrams with = 800 and large , where the line-of-sight is close to the centre of the maser cones.
| IRAS name | common name | line | length | star | ||||
| MHz | km s-1 | km s-1 | arcsec | arcsec | km s-1 | class | ||
| iras073991435 | OH231.8+4.3 | 1667 | 35 | 35 | 2 | 5.5 | 55 | M9I/III, + B? |
| iras080052356 | 1612 | 50 | 40 | 3.2 | - | - | F5I | |
| 1667 | - | - | - | - | - | |||
| 1612Merlin | - | 45 | - | - | - | |||
| iras101975750 | Roberts 22 | 1665 | 3 | 20 | 0.8 | - | - | A2I |
| 1667 | - | 20 | 1 | 1.5 | 35 | |||
| 1612PTI | 0: | 20 | 0.8 | 1.1 | 35 | |||
| 1665PTI | 20 | - | - | - | ||||
| iras113855517 | HD 101584 | 1667 | 40 | - | - | 2.2 | 40 | B9II, binary |
| iras154054945 | 1665 | 60 | - | - | 1 | 45 | ||
| 1667 | 60 | - | - | 1 | 80 | |||
| iras163423814 | Waterfountain | 1612 | 50 | - | - | 1 | 70 | B? |
| iras172532831 | 1612 | 62 | 9 | 0.25 | 0.15 | 16 | ||
| iras174231755 | He3-1475 | 1667 | 50 | 25 | 0.5 | - | - | B[e] |
| iras184910207 | 1667 | 75 | - | - | 1 | 70 | ||
| iras22036+5306 | 1612 | 45 | - | - | - | - | ||
| 1665 | 45 | 20 | 1.0 | 0.5 | 15 | |||
| 1667 | 40 | 25 | 0.7 | 1 | 30 |
4.3 Data representations
For each source and observed OH transition, channel maps were made showing the emission in each frequency channel, corresponding to a radial velocity interval. Fig. 3 shows the OH 1667 MHz channel maps for OH231.8+4.2. The three-dimensional data set (right ascension, declination, and velocity) is a projection of the six-dimensional structure (the three-dimensional geometry of the structure has been projected into the two dimensions of the sky, and only the radial component of velocity is observed). The structure is only visible where the gain of the OH maser is sufficient to produce detectable emission.

We determined the positions of the masers at each velocity by fitting two-dimensional Gaussian components to the detected emission in each channel map. This procedure recovers unresolved or slightly resolved emission but may miss faint, more extended emission or structures such as rings. The position of each component was typically measured to 10% of the FWHM of the restoring beam. We thus reduce the data to a set of delta functions each having an associated position () and velocity (). For each maser position we also determine its projected offset from the stellar position, where
In most cases the stellar position, (), is not accurately known and some assumption about the location of the stellar position relative to the maser positions must be made (section 5).
5 Individual sources
In this section we discuss each of the 10 irregular sources for which we have obtained aperture synthesis images. Of these, OH231.8+4.2 (IRAS 073991435) is the best resolved and is discussed in most detail. For each source we show ‘diagnostic’ plots of the maser spatial distributions (-), the projected separations of the masers against velocity (-) and spectra showing the total integrated emission detected in each velocity channel (-). The results for all sources are summarized in Table 3. For two sources we also discuss HST and ISO results.
5.1 OH231.8+4.2 (IRAS 073991435)
The well-studied nebula OH231.8+4.2 (also known as the Rotten-Egg or Calabash nebula) shows two ionised bipolar lobes on either side of a central obscuring lane (Reipurth 1987). The bipolar axis is at a position angle of 200. The southern, red-shifted lobe is more extended than the northern, blue-shifted lobe, with a total extent (both lobes) along the bipolar axis of 50 arcsec. Shock-excited emission from Herbig-Haro features occurs from the front edges of both lobes (Cohen et al. 1985; Reipurth 1987). The obscured central star (QX Pup, Kastner et al. 1998) is classified as M9III or M9I (Feast et al. 1983), and shows Mira-like variability, indicative of an evolved AGB star. The stellar period has increased from 648 to 708 days over 20 years (Feast et al., Kastner et al., Bowers & Morris 1984). An excess of blue continuum emission indicates the presence of a companion star (Cohen et al. 1985). Morris et al. (1987) found an anomalously high sulphur (hence rotten egg) abundance, and suggest that a nova explosion may have occured in the system.
The bipolar nebula of OH231.8+4.2 is a rich source of molecular material, with a total molecular mass in the range 0.5–1 M⊙ (Alcolea, Bujarrabal & Sanchéz Contreras 1996; Sanchéz Contreras, Bujarrabal & Alcolea 1997). The strongest thermal molecular emission, from 12CO, is detected at velocities between and 250 km s-1 with a strong central peak at 35 km s-1 which is also seen in other molecular lines. We take this velocity to be the stellar velocity. Approximately half of the envelope mass is located within an unresolved ( 10 arcsec) central region at velocities within 25 km s-1 of the stellar velocity. At higher and lower velocities the CO emission is extended along the bipolar axis over the full extent of the optical nebula with a systematic outwards velocity gradient of 6 km s-1 arcsec -1, with blue-shifted emission from the northern lobe and red-shifted emission from the more extended southern lobe. For an inclination angle of the bipolar axis to the plane of the sky of 400 (Kastner et al. 1992), the maximum deprojected outflow velocity of the CO emission, from the southern lobe, is 300 km s-1.
OH231.8+4.2 was the first ‘irregular’ OH/IR star to be discovered (Turner 1971; Cohen et al. 1985; Cohen & Frogel 1977). The OH emission is strongest at 1667 MHz with a broad emission plateau between and km s-1 and an emission spike at km s-1. From VLA images, Morris, Bowers & Turner (1982) showed the OH emission to be concentrated in the equatorial plane, with weak emission also detected above and below the plane. Bowers & Morris (1984) found a distance of 1.3 kpc from OH phaselag measurements. At this distance, the star is a likely member of the open cluster M46 (Jura & Morris 1985) with a progenitor mass of approximately 3 M⊙, determined from the turn-off mass of the cluster. An initial stellar mass of at least 3 M⊙ has also been inferred from an overabundance of nitrogen in the Herbig Haro knots (Cohen et al. 1985).
Fig. 3 shows the individual channel maps for the 1667 MHz observations taken with the VLA in 1988. The source was well resolved with OH emission detected within a region of maximum north-south extent 10 arcsec. Across this region there is a general velocity gradient with the most blue-shifted masers in the north and the most red-shifted masers in the south. At almost all velocities the images show a well-defined symmetry axis at a position angle of 200, corresponding to the bipolar axis of the nebula. Near the stellar velocity of 35 km s-1, the OH images show ring-like or v-shaped structures.
A comparison of the images shown in Fig. 3 with those of Morris et al. (1982) shows no detectable changes in the maser structure between 1981 and 1987. From the earlier data, Bowers (1991) modelled OH231.8+4.2 with an ellipsoidal density distribution, and an OH expansion velocity of 100 km s-1, several times higher than normally seen in OH/IR stars (e.g. Baud & Habing 1983). Here we interpret our data using the two-component model discussed in section 4.
The -, - and - plots for OH231.8+4.2 are shown in Fig. 4a. From the - diagram it can be seen that most of the maser centroids are located within a tilted disk or torus-like structure. The axial ratio of the central region of 0.4 is consistent with an inclination angle of between the line-of-sight and the plane of the disk.

For OH231.8+4.2, the stellar position is not known to a high accuracy relative to the OH masers. In the following discussion we assume that the stellar position is located at the centre of the OH torus. From the absolute maser positions we estimate the stellar position (J2000) to be at: , . This position is indicated by the filled star in Fig. 4a.
From the - diagram we identify two separate kinematic structures corresponding to a central ‘torus’ and a bipolar outflow, in agreement with the models of Fig. 2. The ring or torus is expanding outwards with a maximum expansion velocity of 35 km s-1 and outer radius of 2.5 arcsec. The maser velocities in this region appear better constrained at red-shifted velocities. The scatter of points within the toroidal shell, which is larger at blue-shifted velocities, may indicate a velocity gradient within the torus, or possibly the presence of multiple shells. The precise distribution of points in the - diagram depends on the adopted stellar position but a larger scatter in the blue-shifted maser spots is evident for any reasonable choice of stellar position. The maximum expansion velocity of 35 km s-1 estimated for the torus is higher than normal for OH/IR stars also indicating that some acceleration is likely to have occured in the torus.
Weaker blue- and red-shifted emission is seen above and below the equatorial plane. In the - diagram these reveal a bipolar outflow with blue- and red-shifted emission detected from the northern and southern lobes respectively. Across these features, the OH maser velocities increase linearly with distance from the star reaching velocities of 50 km s-1 (with respect to the stellar velocity), at a radial offset of 5.5 arcsec. The OH velocity gradient of 10 km s-1 arcsec -1 detected over 10 arcsec is in the same direction but steeper than the average gradient of 6 km s-1 seen in CO emission over 50 arcsec.
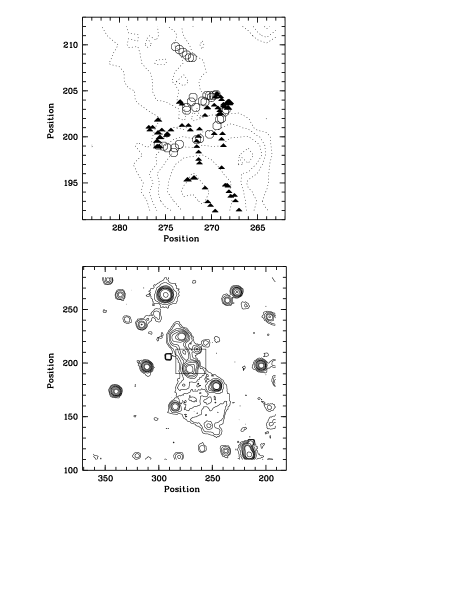
Fig. 4b (bottom panel) shows an optical H image of OH231.8+4.2 which we retrieved from the La Palma archive. The pixel scale is 0.55 arcsec per pixel. The area indicated in the centre is shown enlarged in the top panel, overlaid with the OH maser positions. The images were aligned using stellar positions from the Digital Sky Survey to an estimated precision of 0.3 arcsec. The OH positions for masers within the torus agree closely with the central dark lane discussed by Reipurth (1987). It is likely that the CO emission detected within 25 km s-1 of the central velocity is also associated with the central torus, with a total molecular mass in the torus of at least 0.2 M⊙.
In Fig. 4b the bipolar OH features are well aligned with the optical lobes but only trace the inner few arcsec of each lobe. A comparison of the OH positions with the models shown in Fig. 2 indicates that the OH masers are detected from the front side of the blue-shifted cone and the back-side of the red-shifted cone where the observed velocity gradients are steepest. For a moderate cone opening angle (Fig. 2) we estimate the inclination angle of the OH cones to be approximately 40 degrees in good agreement with previous values for the inclination angle from Reipurth (1987) and Kastner et al. (1992). The opening angle of the OH cones is not well constrained but we suggest that the bipolar OH masers are located on the surface of the optical lobes, near the base of the bipolar outflows.
5.2 IRAS 080052356
Slijkhuis, de Jong & Hu (1991) selected this source as a bright IRAS source with far-infrared colours consistent with a detached shell, and identified it with a supergiant. Bakker et al. (1997) assigned a spectral type of F5I and a mass-loss rate of M⊙ yr-1 with an expansion velocity of 50 km s-1. The mass-loss rate is based on C2 and CN absorption lines and may be overestimated if the mass loss occurs preferentially along the line of sight. The extreme mass-loss rate extends the photosphere and lowers the effective temperature; Bakker et al. suggest that the actual temperature of the star is much higher than derived from its spectral type. From the similarity with HD 101584 (section 5.4) Bakker et al. argue for a binary companion, and narrow chromospheric emission lines are interpreted as evidence for an accretion disk. They argue that such an accretion disk could be the source for the high-velocity outflow.
The OH maser spectra have total velocity widths of 100 km s-1, similar to that of the C2 and CN absorption lines. At 1612 MHz, the OH spectrum is dominated by the strongest emission feature near 0 km s-1 (Fig. 5a). The relative strength of this feature strongly suggests maser amplification of radio continuum emission which originates nearer the star. The origin of this central radio continuum source is not clear, since the central star is not hot enough to ionize the surrounding medium. We take the position of the strongest blue-shifted component as the position of the star. With this choice, the VLA 1612 MHz maser positions of the faint emission at velocities above 10 km s-1 suggest a shell structure (Fig. 5a, middle panel).


At the extreme blue-shifted velocities the much brighter emission is evident as a linear - structure, at almost constant position, possibly slightly offset in position from the extreme red-shifted emission. The linear - structure is unlikely to correspond to a true linear outflow. Linear - structures at the extreme velocities are seen in classical OH/IR stars where the emission is under-resolved (e.g. Herman 1983; Chapman 1985). The Gaussian fitting procedures introduce a cutoff velocity, beyond which all components are centred at the same position. An unresolved structure extending over an extended velocity range might also occur if there are radial velocity gradients across the shell, or multiple shells, so that maser emission is detected over a range of velocities along the line-of-sight to the star. The higher spatial resolution of the MERLIN data (Fig. 5b) resolves the structure into a shell-like component. The increase in radius of 0.15 arcsec between 0 and 16 km s-1 is surprisingly small when compared to the maximum offset of around 3.2 arcsec evident in the VLA data at velocities near 50 km s-1. Whatever the cause, the small angular scale emission seen at the extreme blue-shifted velocities is probably physically different from the linear outflow structures we are investigating in this paper.

Fig. 5c shows the results obtained with the VLA for the 1667 MHz masers. We find that the (fainter) 1667 MHz emission at 0 km s-1 is spatially coincident with the extreme blue velocities at 1612 MHz. However the spatial structure of the 1667 MHz masers is not clear and we do not attempt to interpret this further.
From the OH 1612 MHz data, we interpret IRAS 080052356 as an expanding shell with an expansion velocity of 45 km s-1 and a shell radius of . The expansion velocity of the shell is too high for a normal AGB wind (e.g. Habing et al. 1994), suggesting acceleration after the original AGB wind.
5.2.1 Chemical dichotomy in IRAS 080052356
The absorption spectrum of Bakker et al. (1997) indicates a carbon-rich outflow: it is the only object to show a Phillips absorption band and OH emission. Bakker et al. suggest a recent change occured from an oxygen-rich to a carbon-rich star. IRAS 080052356 does not show the 21-m feature which is normally found in carbon-rich post-AGB stars (Kwok, Hrivnak & Geballe 1995; Szczerba et al. 1997), supporting a radial gradient in chemical composition.
The timescales involved suggest that an old disk acted as an oxygen-rich reservoir (see the discussion on Roberts 22 which also shows a chemical dichotomy). The close agreement between the velocities of the OH masers and the (present) carbon-rich wind of the central star is interesting, since the chemistry indicates they trace different gases. However, the carbon wind velocity may have been underestimated since the absorption lines only measure the line of sight to the star.
5.3 Roberts 22 (IRAS 101975750)
Roberts 22 was first discovered as an emission-line object and classified as a suspected WR star (Roberts 1962). It was later shown to be a reflection nebula, with the central star completely obscured but a spectral type of A2I was inferred from the scattered light from the two lobes (Allen, Hyland & Caswell 1980). The H line arising from the central star has a width of 450 km s-1. Roberts 22 is a strong source of variable OH maser emission at 1612 and 1665 MHz with weaker emission at 1667 MHz. HST images of this bipolar nebula (Sahai et al. 1999a) show a dark lane across the centre of the object, with additional dark regions in the Northern half, close to where the dark lane is least clear. Sahai et al. suggest that the dark regions are remnants torn off of the torus. The diameter of the optical nebulosity is ; the disk is evidently seen edge-on.


Fig. 6a shows the diagnostic OH 1665 MHz diagrams obtained from the ATCA data in 1992. As the star has not been optically identified, the stellar position is not known to a high precision. We assume that the stellar position coincides with the 1665 MHz blue-shifted emission peak at 27 km s-1. The absolute position of this component is , (J2000). This is offset from the centre of the HST nebula, but the phase calibrator used at the ATCA may have had a slightly uncertain position.

At velocities between 30 and +15 km s-1, the strong 1665 MHz OH emission from Roberts 22 reveals a torus-like structure of extent 1 arcsec which is seen nearly edge on, aligned with the dark lane seen in the optical images222For Roberts 22, we also observed the 1665 MHz emission between -35 and -30 km s-1 but are unable to include that data as it was strongly affected by spectral ringing from the sharp-edged emission peak at -27 km s-1. From the maximum observed radial offset at 0.7 arcsec, we take the stellar velocity to be at 0 km s-1. The expansion velocity of the torus, determined from the blue-shifted emission is approximately 20 km s-1. The maser emission from the torus is far brighter on the blue-shifted side while the extreme velocity red-shifted emission is not detected. The gap of emission at the most red-shifted velocities in Fig. 6a can be explained if there is a central ionized region near the star which is optically thick at 18 cm.
The OH 1665 MHz distribution of Roberts 22 is similar to the OH 1612 MHz distribution of IRAS 080052356 (Section 5.2). Both sources also show a horizontal feature in the - diagram which extends over 10 km s-1 at the outer blue-shifted velocities. As discussed for IRAS 08005-2356, this feature is unlikely to correspond to a true linear outflow. The weaker 1667 MHz emission of Roberts 22 (Fig. 6b) covers a larger area of 2.5 arcsec. As for other sources, the maser geometry is least clear at 1667 MHz. Within the position errors the peak emission at 1665 and 1667 MHz is coincident.
Fig. 6c shows composite - and - diagrams where the ATCA 1665 and 1667 MHz results are plotted together with the higher angular resolution 1665 and 1612 MHz results from the PTI observations. We have aligned the PTI positions with the ATCA positions by assuming that the positions of the 1612 and 1665 MHz emission features at km s-1 are coincident.
The PTI maser positions and velocities confirm the torus-like structure evident from the ATCA 1665 MHz data, for the velocity range to 15 km s-1. At 1612 MHz, the PTI observations also detected the weaker emission feature at the extreme blue-shifted velocities between and km s-1. This feature is evident as the northern group in Fig. 6c. Across this group there is a systematic velocity gradient from km s -1 at the southern edge to km s-1 at the northern edge. In the - diagram the northern feature is seen as a linear feature which is aligned with part of the 1667 MHz emission. The 1665 MHz PTI data confirms the large range of velocities (15 km s-1) seen in the blue-shifted emission towards the central star. These velocities may trace a radial velocity gradient or may be due to a turbulent velocity field.
Overall we interpret the maser emission from Roberts 22 as a nearly edge-on disk which coincides with the dark lane between the two optical reflection lobes, as expected if the torus is oxygen-rich. The detection of the linear feature to the north and the more scattered 1667 MHz emission indicates that some collimated outflows may also be present.
5.3.1 Chemical dichotomy in Roberts 22

Molster et al. (1996) have suggested that Roberts 22 exhibits a mixed oxygen/carbon chemistry. The ISO (Infrared Space Observatory, Kessler et al. 1996) spectrum of Roberts 22 is shown in Fig. 6d. The observations were taken on July 27, 1996, with the Short Wavelength Spectrometer (SWS, de Graauw et al. 1996). The total integration time was 3454 seconds. Unfortunately, ISO was pointed about of the centre, and the flux calibration is badly affected by wavelength-dependent aperture losses. It also caused flux jumps at 27.5 and 29.2 m because of the larger apertures used at these wavelengths. The flux calibration is therefore not reliable.
Bad data points were identified by comparing different detectors at the same wavelength, and were manually removed. The detectors were combined into a single spectrum for each of the 12 subbands. The different sub-band spectra were scaled to match each other for band 1A to 3D (2.4 – 27.5 m). Band 3E (27.5 – 29.2 m) and band 4 (29.2 – 45 m) are not scaled to the other detectors: the jumps are caused by the pointing error.
To enhance the features present on top of the continuum, we have subtracted a spline (see Fig. 6d) fitted through selected points where no feature was believed to be present, separately for band 1A to band 3D and for band 4. For band 3E no continuum was drawn because of the short wavelength coverage in this band. Very broad features are treated as continuum by this method, and the strength of broad features may be reduced. The spline fit continuum has no physical meaning and is only used to enhance the features.
The dual chemical character of the dust is clearly visible in the continuum-subtracted spectrum. Carbon-rich dust is indicated by the PAH features at 3.3, 6.25, 7.8, 8.7, 11.3, 11.9 and 12.7 m. However, at wavelengths longwards of 15 m the crystalline silicates features at 18, 19.4, 23.5, 33.5, 40.5 and 43 m dominate the spectrum. There is also a hint of the broad 18 m amorphous silicates feature. The crystalline silicate feature at 43m is probably blended with crystalline water-ice, since there is a hint in the LWS (45 – 200 ) spectrum (not shown) of a 60 m bump, which is usually attributed to crystalline water-ice (see e.g. Barlow 1998). All these are a clear sign of the presence of oxygen-rich dust species. The strength of the crystalline silicate features compared to the continuum is within the range of ordinary outflow sources (Molster et al. 1999).
This chemical dichotomy, with both carbon-rich and oxygen-rich dust being simultaneously present, is shown by only a few post-AGB stars: the binary (post-)AGB nebula ‘the Red Rectangle’ (HD 44179: Waters et al. 1998a), a number of planetary nebulae with WR central stars (so-called [WC] stars) (Waters et al. 1998b), and the extreme bipolar PN NGC 6302. Waters et al. assume that the silicate features arise from an old disk, formed at a time when the central star was oxygen-rich (see also Jura & Kahane 1999), and the present outflow is carbon rich. Of the AGB carbon stars which show silicate emission (Willems & de Jong 1986, Little Marenin 1986), only two show evidence for both silicate and carbon (SiC) circumstellar features: IRAS 044966958 in the LMC (Trams et al. 1999) and CS1003 in the Galaxy (Little Marenin 1986). The other silicate carbon stars show only oxygen-rich dust. The preferred explanation for the silicate carbon star also involves a long-lived disk (Lloyd Evans 1990).
5.4 HD 101584 (IRAS 113855517)
HD 101584 is an optically identified star of spectral type B9II (Bakker et al. 1996a) and belongs to a group of high-latitude, bright, A–G post-AGB stars (Bidelman 1951; Parthasarathy & Pottasch 1986). From optical photometry, Bakker et al. (1996b) obtained a periodicity of 218 days and inferred that the star is in a close binary system with an unseen companion. The star has a strong stellar wind with a maximum outflow velocity close to the star, determined from Balmer line P Cygni profiles, of 100 km s-1 (Trams et al. 1990; Bakker et al. 1996b). The distance is in the range 0.6–1.1 kpc (Bakker et al. 1996a). The Hipparcos parallax is milli-arcsec.
Molecular 12CO and 13CO emission from HD 101584 occurs over an extreme velocity range of almost 300 km s-1 (Trams et al. 1990; Loup et al. 1990; Van der Veen, Trams & Waters 1993; Olofsson & Nyman 1999). The 12CO spectral profiles show weakly double-peaked emission which extends over 100 km s-1, together with highly extended emission wings which cover 300 km s-1 and two relatively narrow features at velocities of and 173 km s-1. The stellar velocity is well defined from the centre of the 12CO profiles to be km s-1 (Olofsson & Nyman 1999) The 13CO profiles are similar but show an additional narrow feature which is centred precisely at the stellar velocity.
Olofsson & Nyman find that the 12CO(21) emission is extended along a position angle of 900. The high velocity CO emission is bipolar with higher expansion velocities detected at larger distances from the star. The extreme blue and red-shifted CO emission is offset by 4.5 arcsec to the west and east of the stellar position respectively with an average CO velocity gradient between the two sides of approximately 30 km s-1 arcsec-1. The spatially unresolved low and intermediate velocity CO emission within 60–70 km s-1 of the stellar velocity is located much closer to the star within a region of radius 1 arcsec, indicating a higher velocity gradient or turbulence in this region.

The OH 1667 MHz maser distribution for HD 101584 has previously been discussed by te Lintel Hekkert, Chapman & Zijlstra (1992) but is included here for a comparison with the recent CO results. The OH 1667 MHz emission (Fig. 7a) shows two emission features over a considerably smaller total velocity range of 84 km s-1. The central OH velocity agrees well with the systemic CO velocity. The masers are located within two groups at a position angle of 60o which extend between one and two arcseconds on either side of the star. The systematic velocity gradient is approximately 25 km s-1 arcsec -1.

Fig. 7b shows the ATCA maser positions plotted together with the CO positions from Olofsson & Nyman (1999). Olofsson & Nyman have presented a geometrical model in which the OH maser emission together with the low and intermediate velocity CO emission are located within an equatorial disk while the high velocity CO emission originates in a bipolar outflow aligned in the perpendicular polar directions. However, from the model presented in this paper, the linear velocity gradient of the OH masers is consistent with a bipolar outflow. No evidence for a disk- or shell-like OH structure is seen.
The narrow 13CO emission feature with an expansion velocity of 7 kms-1, centred on the stellar velocity, shows evidence for a molecular disk near the star. The lack of any OH emission from this disk can be understood if the density in the disk is sufficiently high for collisional de-excitation of the OH molecules. The absence of the disk feature in the 12CO line is consistent with a high optical depth and high density in material surrounding the disk. Both the intermediate velocity CO and OH may come from this surrounding gas.
Although the averaged velocity gradient of the OH masers is similar to that of the high velocity CO emission, the bipolar OH distribution (observed in 1991) cannot be aligned with the high velocity bipolar CO distribution (observed in 1997). Fig. 7b shows that the east-west axis of the CO emission is rotated by an angle of 150o (anticlockwise) with respect to the northwest-southeast OH axis. The OH and CO therefore trace different components. The CO is likely to trace the most massive component. The OH could come from a smaller region of higher excitation, such as e separate jet-like structure which developed within the expanding gas (e.g., Frosty Leo: Sahai et al. 2000). Another possibility, also raised by Olofsson & Nyman, is that some precessional motion is present.
Although Bakker et al. suggest that the disk is seen edge on, a moderate inclination as suggested by Olofsson & Nyman seems consistent with the available data. HD 101584 is associated with an optically bright post-AGB star which indicates a low circumstellar extinction. The CO velocity gradient also argues against either a pole-on or edge-on viewing angle. The observed velocity variations arising from the binary orbit indicates that the line of sight cannot be close to pole-on, unless the circumstellar disk and the binary orbit are in different planes.
5.5 IRAS 154054945
Single-dish OH spectra of IRAS 154054945 (te Lintel Hekkert & Chapman 1996; te Lintel Hekkert et al. 1988) show a broad velocity range of 80 km s-1 at 1612 MHz, 105 km s-1 at 1665 MHz and 155 km s-1 at 1667 MHz. No optical counterpart is known. Due to its location in the Galactic plane and cold IRAS colours, the object has been interpreted as a possible ultra-compact HII region. A search for methanol maser emission was unsuccessful and so did not confirm such a classification (Walsh et al. 1997). From the centre of the two main-line OH profiles, we take the stellar velocity to be 60 km s-1. The centre of the 1612 MHz profile is offset, with a median value of 74 km s-1.


The OH 1665 and 1667 MHz - plots (Figs 8a, b) show that the masers lie in an elongated elliptical-shaped region, with a position angle of 45 degrees and a total diameter of approximately 2 arcsec. At 1665 MHz there is a clear separation of the blue- and red-shifted masers. The stellar position is assumed to coincide with the unweighted emission centroid of the OH 1665 and 1667 MHz maser positions. te Lintel Hekkert et al. (1988) attribute the extreme blue-shifted feature to amplification of the stellar continuum; the present data does not support this.
The separation of the blue and red-shifted masers at 1665 MHz argues for an axi-symmetric, possibly bipolar outflow which is however very poorly resolved (Fig. 8b). At 1667 MHz the largest offsets occur at the extreme velocities, more consistent with a linear outflow than with an expanding shell. The extreme velocity ranges of the OH spectra are not easily explained with an expanding shell structure. We therefore interpret the OH maser spectra and positions as evidence for a wind–wind interaction with ‘jet-like’ rather than ‘shell-like’ maser distributions. Higher spatial resolution observations are needed to confirm this hypothesis.
The OH profiles show significant variability. The OH 1612 MHz maser profile has nearly doubled in strength overall since its discovery in 1987, whilst a large number of individual maser spikes have appeared and others have disappeared (see Figs 1 and 2, te Lintel Hekkert et al. 1988). The OH 1667 MHz feature between –20 km s-1 and –10 km s-1 has decreased significantly in strength and other, broad features have increased.
5.6 IRAS 163423814
This outflow source was first discovered by Likkel & Morris (1988) and te Lintel Hekkert et al. (1988), and shows both OH and H2O outflows. The highly variable H2O masers occur in pairs at opposite velocity, at a number of discrete velocities (Likkel, Morris & Maddalena 1992). HST images show two asymmetric bipolar reflection lobes on either side of a dark lane which is identified as an edge-on equatorial disk or torus (Sahai et al. 1999b). The forbidden stellar velocity argues that IRAS 163423814 belongs to a lower-mass, old population.

Fig. 9a shows the maser results obtained from the VLA 1612 MHz observations. The red- and blue-shifted masers are located in two well-separated groups with an east-west gap between the two groups of 0.35 arcsec which coincides with the location of the central torus. From the - diagram, the blue-shifted masers show a linear structure which extends over 0.8 arcsec, similar to HD 101584.
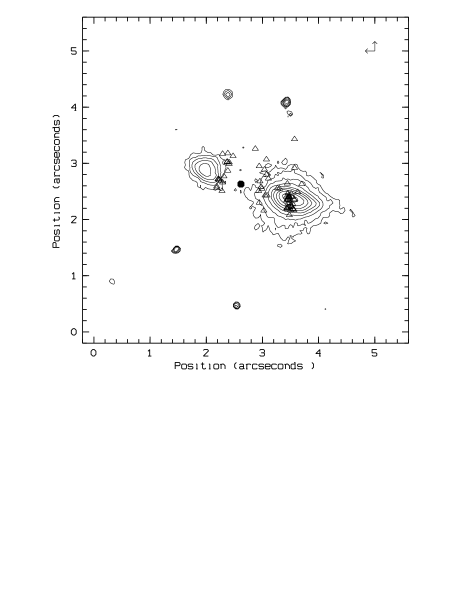
We recalibrated an archive HST V-band image of IRAS 163423814 (principal investigator Bobrowski; used in the V–I colour composite image of Sahai et al. 1999b). An astrometric accuracy of 0.2 arcsec was achieved using the Digital Sky Survey, and the frame was rotated and corrected for astrometric distortions. Fig. 9b shows the OH 1612 MHz maser positions overlaid on the HST image. The red-shifted masers are detected from the inner edges of the eastern lobe while the stronger blue-shifted masers are located along the inner edge and towards the centre of the brighter western lobe. The OH masers avoid the dark torus. The strongest OH emission feature, at km s-1, coincides with the brightest point of the reflection nebula. This is almost certainly due to amplification of radio continuum emission from the lobe. Radio continuum emission may arise from shock-ionization due to the presence of a narrow jet within the lobe, as in M1-92 where the radio continuum emission is also centred on the brightest reflection lobe rather than at the star (Bujarrabal et al. 1998).
The OH spectra of IRAS 163423814 have similar variability characteristics to IRAS 154054945 (see Figs 3 and 4, te Lintel Hekkert et al. 1988). Whilst the OH 1612 MHz emission was at a similar strength in 1988 and 1990, the OH mainline emission has increased in intensity by more than 50 per cent with striking changes in the spectral profiles. One difference between this source and IRAS 154054945 is that the OH maser emission is strongly circularly polarized in all lines, which is rare in OH/IR stars.
5.6.1 The disk parameters of IRAS 163423814

The density and size of the edge-on disk of IRAS 163423814 can be determined using infrared modeling. We have recalibrated the LRS spectrum using the IRAS Software Telescope (Assendorp et al. 1995). The spectrum plus available photometry (van der Veen et al. 1989) is shown in Fig. 9c. The 18-m feature is in absorption, and a lack of hot dust is evident shortward of the 9.8-m feature.
We fitted the spectrum using a radiative-transfer code (see Siebenmorgen, Zijlstra & Krügel 1994) which includes a range of dust sizes and incorporates scattering effects. The code assumes spherical symmetry. We applied a correction factor to allow for the fact that the torus only covers a finite solid angle as seen from the star. This approach is possible because the disk is almost seen edge-on. The ratio of optical depth of the 18-m to 9.8-m features is very sensitive to the temperature of the innermost dust. Thus the inner radius of the dust shell is quite well determined. The best fit is shown in Fig. 9c, using model parameters summarised in Table 4.
The best fit indicates a distance considerable less than assumed by Sahai et al. (1999b). We used a distance of 700 pc. At this distance the star is somewhat sub-luminous compared to most Post-AGB stars, but at larger distances the mass in the shell becomes too large for AGB mass loss. The present distance would reduce the extremely high mass-loss rate implied by Sahai et al.
The torus parameters required to fit the LRS spectrum indicate an inner radius of approximately and an outer radius of . The values agree very well with the HST image in Fig. 9b. The dust temperature runs from 200K at the inner edge to 80K at the outer. The density of the disk is about : this is far above the density where OH masers are collisionally de-excited and is in agreement with the fact that no OH masers are seen towards the dark torus. The torus in the model covers about 10% of the sky as seen from the central star, and has a mass of about 0.1 M⊙.
The HST image of IRAS 163423814 reveals four remarkable point-like sources (Fig. 9b) distributed almost symmetrically around the obscured torus. Their positions correspond well with the outer edge of the disk model. This suggests that they may be caused by scattered emission from the edge of the disk.
| star | ||
| distance | 700 pc | |
| 2500 L⊙ | ||
| 15000 K | ||
| nebula | disk | outer shell |
| inner radius | cm | cm |
| outer radius | cm | cm |
| inner density | cm-3 | cm-3 |
| density profile | ||
| covering angle | 10 % | 90 % |
| Mass | 0.10 M⊙ | 4: M⊙ |
The long wavelength IRAS fluxes cannot be fitted with a disk. Instead we had to assume an outer shell. The fit parameters from this shell are however not well determined. To reduce the mass in this shell, a shallow density gradient of was chosen (based loosely on eq. (12)). This dust may be located in the intershell region between the two winds, in which case the values in Table 4 are not relevant. The 60-m flux may also in part be due to the crystalline ice band.
The optical photometry of van der Veen et al. cannot be fitted, and are also inconsistent with the HST image (Sahai et al. 1999b): it is believed that these data represent a nearby field star. The infrared data also is not well fitted: the model predicts that the extinction towards the star ( mag) is too low to hide the star beyond a few micron. The fact that no bright star is seen in the infrared indicates both a low luminosity and a high temperature. However, the stellar temperature cannot be much higher than 15 kK since no ionization is seen.
5.7 IRAS 172532831
This OH source was listed by Zijlstra et al. (1989) as a possible coincidence with the planetary nebula Th3-19 (PN358.4+03.3; IRAS 172532824). However, the present OH data shows that the Parkes position was offset by . The far more accurate VLA position is within several arcseconds of IRAS 172532831, which has a very red 12/25 m colour with strongest infrared emission at 25m, consistent with an OH/IR star with deep silicate absorption. A SIMBAD search did not reveal any other published data of this source.
The OH profile shows peculiar emission wings outside of the two strongest OH peaks. OH 1612 MHz emission was detected at velocities between 78.2 and 46.4 km s-1 with the strongest emission from the two emission peaks at 53.2 and 71.4 km s-1. From the mid-velocity of the two peaks we take the stellar velocity to be at 62 km s-1.

The OH 1612 MHz maser emission (Fig. 10) was detected within a compact, poorly resolved region of arcsec diameter. In Fig. 10 we have adopted a position mid-way between the positions of the two emission peaks as the best estimate of the stellar position. For this stellar position, the - diagram shows an elliptical distribution of points at velocities between the two emission peaks as expected for a circumstellar shell with an expansion velocity of 9 km s-1 and an angular radius of approximately 0.25 arcsec. In contrast, at velocities outside of the emission peaks the maser positions show an increase in the position offsets with velocity, indicating a likely bipolar outflow.
From the VLA data we interpret IRAS 172532831 as an AGB wind with low expansion velocity, where the emission profile is extended beyond the expansion velocity of the shell due to a bipolar outflow which results from a wind–wind interaction. Higher resolution observations are needed to confirm this interpretation.
5.8 IRAS 174231755 (He3-1475)
This object shows one of the most spectacular bipolar post-AGB outflows known (Bobrowski et al. 1995; Riera et al. 1994; Borkowski, Blondin & Harrington 1997). The optical images show a curved line of shock-ionized knots on both sides of the central object, with velocities in excess of 500 km s-1. The star is classified as a B[e] star and is only seen in reflection against the back of the torus (Bobrowski et al. 1995). The emission spectrum shows many iron lines arising from very dense gas close to the star (Riera et al. 1994, Bautista & Pradhan 1998).

The OH 1667 MHz spectrum is faint, and shows a fairly flat profile but with enhanced emission near the stellar velocity at 50 km s-1. Bobrowski et al. attribute this feature to amplification of radio continuum emission from the shock-ionized jet. The diagrams of Fig. 11 show a poorly resolved shell-like structure which is better defined on the blue-shifted side. On the red-shifted side the emission is more scattered in position but no clear linear outflow is visible. We interpret the OH as being associated with the expanding shell or torus.
5.9 IRAS 184910207
The classification of IRAS 184910207 is uncertain. The IRAS colours are consistent with an HII region (Fig. 1), however Walsh et al. (1998) did not detect methanol maser emission and the NVSS survey did not reveal radio continuum emission (Condon et al. 1988). The IRAS variability index of 31% is more consistent with a classification as a post-AGB star. Its nature thus remains to be determined.

The OH 1667 MHz maser emission from IRAS 184910207 covers an extreme width of 150 km s-1. The VLA data (Fig. 12) are limited by the very poor velocity resolution of 8.8 km s-1. The stellar position is assumed to coincide with the unweighted emission centroid. The OH masers are unresolved in declination but show a systematic velocity gradient of 75 km s-1 arcsec -1 in right ascension. An axi-symmetric or bipolar distribution is indicated by the separation of the blue and red-shifted masers. We interpret the maser distributions as a linear outflow source, with a bipolar maser distribution similar to that of HD 101584 and IRAS 163423814. Higher velocity and spatial resolution maser observations would be well worthwhile.
5.10 IRAS 22036+5306
Oudmaijer et al. (1992) identified the IRAS source with HD 235718 (SAO34043). However, the present observations show the OH emission to be located 40′′ south of the star (see also Meixner et al. 1999). Coulson, Walther & Dent (1998) report a small, very red nebulosity near this position with near-infrared magnitudes of (J,H,K,L)=(11.8,9.6,7.4,5.2). The POSS O- and E-plates show a faint, red pointlike source at this position. The infrared photometry can be fitted using two blackbody curves with temperatures of 1000 K and 130 K. Near-infrared spectra of this source taken in 1992 show CO bandheads at 2.3m-2.5m and Brackett-gamma emission at 2.167 m, both signatures of mass loss, and a 10-m spectrum showed broad deep absorption between 8 and 12 m possibly due to ice-covered silicates (Coulson, priv. comm.).


The object is close to the Galactic plane and the central OH velocity of km s-1 is consistent with a location in the Perseus arm. The NVSS survey (Condon et al. 1998) did not reveal radio continuum emission within of this position arguing against a classification as an HII region. The characteristics of the OH masers and the absence of a water maser (Zuckerman & Lo 1987) are consistent with an evolved object, perhaps similar to IRAS 163423814, but an evolved massive star is also possible.

The stellar position is not known and we have assumed that it is at the unweighted emission centroid of all the detected masers. From the centre of the 1667 MHz spectral profile, which extends over the largest velocity range of 70 km s-1, we take the stellar velocity to be km s-1.
Figs 13a–c show axisymmetric distribution of the OH masers, with a separation of the blue and red-shifted maser components present in all three lines. The OH 1667 MHz masers are located within a linear structure extending over 1.8 arcsec. The - diagram for the 1667 MHz masers however is more complicated and indicates an incomplete shell-like feature at velocities between and km s-1, while the masers at the extreme velocities appear to be more linear in -. The angular diameter of the OH emission is only marginally consistent with the unresolved 10-m counterpart (Meixner et al. 1999).
The OH 1665 MHz and 1612 MHz masers appear to be located within a small number of clumpy regions which may form part of the same structures seen in the 1667 MHz line. Each of the three transitions occupies different regions of the plane as expected if the masers are located in clumpy regions in which different physical conditions favour one of the OH transitions. The OH 1665 MHz masers cover the smallest velocity range of 45 km s-1 and also appear to be located closest to the star. The 1612 MHz masers are more extended in both space and velocity. Overall, we interpret the OH masers of IRAS 22036+5306 as a combination of shell and linear outflow but the separation between these components is not very clear.
IRAS 22036+5306 shows strong evolution in the spectral profiles between the earlier data of te Lintel Hekkert (1988) and the present data (1990). At both 1612 and 1667 MHz the low velocity features, between –80 km s-1 and –60 km s-1, have strengthened significantly while the high velocity maser feature, between –25 km s-1 and –10 km s-1 has weakened. At the same time, a plateau of emission has emerged. In 1990, the OH 1667 MHz spectral profiles of this source was very similar to the high outflow sources OH231.8+4.2 and IRAS 154054945. Unfortunately, no polarization information is available.
5.11 Summary: the two components
The OH maser structures indicate that at least one of the two components predicted by the model are present in the majority of the sources.
Six objects show a shell/torus component. The expansion velocities for this component listed in Table 3 show limited expansion velocities mostly of 20–25 km s-1. OH231.8+4.2 and IRAS 080052356 have shell expansion velocities which are too high for an AGB wind. CO emission from disks around evolved stars shows typical expansion velocities around 7 km s-1 (e.g. Olofsson & Nyman 1999, Zweigle et al. 1997). This suggests that the OH torus may not be the original circumstellar AGB torus but traces gas that has already been accelerated. For IRAS 163423814, the infrared model shows that the density in its disk is sufficiently high to collisionally quench the OH maser inversion. This may also be the case for the other three sources which show a linear outflow but not a shell or torus.
All but two objects (IRAS 174231755 and IRAS 080052356) show evidence for a ‘linear outflow’, with velocity increasing linearly with distance from the star. Extreme velocities with respect to the star range from 15 to 80 km s-1. Where both components are seen, the linear outflow velocity reaches about twice the velocity of the shell component. Deprojection may make the ratio a little larger. The observed velocity ratio between shell and linear outflow is in good agreement with the predicted ratio of about a factor of 2 from the interacting-wind model. The spatial size of the linear jet tends to be smaller than the shell (except for OH231.8+4.2 where they are similar). The linear outflow appears to be seen close to the line of sight, which suggests that the radial masers are seen and that velocity deprojection effects are minor. The linear outflow appears to begin at the radius and velocity of the shell, in those cases where both components are seen. This is in agreement with the geometry assumed in section 4.2.
Strong circular polarization (25 per cent or more) of the OH maser lines is seen in IRAS163423814, and in OH231.8+4.2, and five sources (IRAS163423814, IRAS154054945, IRAS22036+5306, OH231.8+4.2 (Morris & Bowers 1980), and Roberts 22 (Allen et al. 1980)) show variability in the ratio between different velocity components. Such effects are not seen in normal AGB stars (e.g., Cohen et al. 1987). The variability of upto a factor of 2 suggests the effect may be related to line overlap between different Zeeman components along the line of sight (Deguchi & Watson 1986).
6 Discussion
6.1 Nebulae
The IRAS colour–colour diagram (Fig. 1) shows evidence for two distinct groups, one with with colours typical for outflow sources and the other with PostAGB colours.
All objects where imaging has shown a well-developed bipolar outflow, are indeed found among the outflow sources. The optical morphology of remaining two outflow sources (IRAS 22036+5306 and IRAS 154044945) is not known. The outflow sources exhibit a narrow range in the 60/25-m flux ratio. The 25/12-m micron flux ratio varies by a factor of 4: our modeling of IRAS 163423814 (Section 5.6.1) suggests this reflects a range in the optical depth of the silicate feature, which will depend on disk density and inclination. HD 101584 may be related to this group but with a much lower disk optical depth. Its CO emission indicates a similarly well-developed bipolar structure. The sources with the highest OH linear outflow velocities are located at the red end of the outflow box; two of these lack a shell component. If these sources have edge-on disks (as suggested by the red colour), the high projected outflow velocity would indicate that the outflow is located near the surface of the disk, close to the equatorial plane, with a large opening angle.
The two sources with Post-AGB colours, IRAS 080052356 and Roberts 22, appear to exhibit bipolar outflows which are much less collimated. A possible explanation could be that their circumstellar disks are wider and less dense. Both objects show evidence for chemical evolution and for the onset of central ionization. Thus, these nebulae appear physically very different from the outflow sources, although with a similar wind–wind interaction.
6.2 Stars
Spectral types are known for five stars in our sample (Table 3). The star of IRAS 163423814 has not been detected but our infrared modeling favours spectral class B, based on its non-detection. The central ionization indicated for IRAS 080052356 and Roberts 22 would require earlier types than listed, with temperature of 15000K or a little higher. This agrees with Bakker et al. (1997; see subsection 5.2 above). For temperatures above 18000 K extensive ionization is expected which is not observed (e.g. Zijlstra et al. 1989). No correlation is seen between derived temperatures and position in the IRAS colour–colour diagram.
The observed wind velocities of the central stars, based on H, are 450 km s-1 for Roberts 22 and km s-1 for He 3-1475 (from the spectra in Bobrowski et al. 1995) but only 130 km s-1 for HD 101584 (Bakker et al. 1996a) (much less than the velocities of the molecular outflow). Such velocities are found in post-AGB stars of spectral class late B, although the wind velocity depends on the luminosity (Pauldrach et al. 1988) which is not known. The early spectral types may be related to our selection criterium of high OH outflow velocities which in our model requires a fast stellar wind. In this case, most of the obscured, undetected stars in our sample would require similar spectral types.
The Mira star of OH231.8+4.2 is the exception, and its fast wind is likely to originate from a stellar companion which must have spectral type of B or earlier. Cohen et al. (1985) find some evidence for a blue companion. The turn-off mass of its parent cluster excludes a B-type main sequence star and so the companion would be a post-AGB star itself. OH231.8+4.2, far from being the proto-type of its class, is in fact a major exception. We suggest a classification as a symbiotic OH/IR star.
Within our sample, only HD 101584 is an observationally confirmed binary (Bakker et al. 1996a). Bipolar nebulae are often argued to be related to binary evolution (e.g. Soker 1998), but direct evidence for such a connection is missing.
6.3 Evolution
An important question is whether an evolutionary sequence can be defined linking the bipolar OH/IR stars to PNe and to AGB stars. We show that two such links may be present: the first with extreme bipolar PNe, and the second with the IR-[WC] stars.
6.3.1 Bipolar PNe
Strong bipolar morphologies are very rare among PNe: most objects show indication only for mild bipolarity or elliptical structures. There are six PNe known with morphologies resembling those of the outflow sources (NGC6302, M2-9, Hb4, He2-437, 19W32 and K3-35; the classification of K3-35 is uncertain). Their IRAS colours, indicated by the triangles in Fig. 1, agree surprisingly well with the ’outflow’ sequence of the bipolar OH/IR stars. The similarity in morphology and colours make a connection is likely, either by direct evolution (in which case the star would have to evolve to higher temperatures on short time scales compared to the colour evolution of the nebula), or the PNe may be closely related objects but with faster evolving central stars. The peculiar IRAS colours of the bipolar PNe has previously been noted by Corradi & Schwarz (1995).
Two of the PNe, NGC6302 and K3-35, show OH maser emission (only two other PNe are known to show OH, one of which is discussed below). They are the objects with the reddest 25/12 micron colours, and therefore likely the highest optical depth through the disk. The OH strengthens the case for a connection between the outflow sources and this rare group of PNe. Whether on longer time scales these objects evolve into more familiar PNe is not known. There are more PNe known with less distinct bipolar structures which could be a later evolutionary phase, however a relation with the far more numerous elliptical PNe is unlikely (e.g. Corradi & Schwarz 1995).
6.3.2 The IR-[WC] stars
The chemical dichotomy seen in two of our objects is shared by a few infrared-bright late [WC] stars (e.g. Zijlstra et al. 1991, Zijlstra 2000). The open squares in Fig. 1 show that these IR-[WC] stars have IRAS colours closely similar to IRAS 080052356 and Roberts 22. The IR-[WC] stars have temperatures only slightly higher than the stars in the present sample. The possible ionized central region may indicate that Roberts 22 is already becoming a planetary nebula. One of the IR-[WC] stars, IRAS 070277934, has a strong OH maser (Zijlstra et al. 1991)
The combination of the dual chemistry, which is known for no other PN, the closely similar stellar temperatures, and the OH emission of one of the IR-[WC] stars, argues for a close relation between the IR-[WC] stars, and Roberts 22 and IRAS 080052356. The main difference is however that the [WC] stars have little or no hydrogen, while Roberts 22 shows strong hydrogen emission. To proof an evolutionary connection would thus require a mechanism for removing the surface hydrogen, e.g. mixing it down into the lower hydrogen-poor layers (e.g. Herwig 2000).
It is not evident that a dual-chemistry source can evolve into a PN with a single (C or O-dominated) chemistry. Roberts 22 is the best candidate at present for a [WC] star progenitor, but further evolution into a typical PN seems unlikely.
We thus find two possible evolutionary sequences: one leading to the few PNe with extreme bipolar morphologies, and a second leading to the (equally rare) IR-[WC] stars.
6.3.3 Progenitors
The only object known among the OH/IR stars which could be considered a progenitor of the bipolar OH/IR stars, is OH 19.21.0. Chapman (1988) modeled this star using a bipolar outflow model; the MERLIN data indicates a velocity gradient across the source. OH 19.21.0 is variable with a period of 600 days, and this and also its IRAS colours (Fig. 6 in Chapman 1988) assign it to the tip of the AGB. When this object will leave the AGB with declining mass loss, it could become very similar to the objects studied in this sample. The outflow velocity of OH 19.21.0 is just below 50 km s-1. Thus, it is possible that our criterium of high outflow velocity introduced a bias against AGB stars.
Only a very small percentage of the OH/IR stars show irregular spectra similar to OH19.21.0. This would imply that well-developed bipolar outflows are much more common in the post-AGB evolution than on the AGB.
Corradi (1995) makes a strong case for a relation between strongly bipolar PNe and symbiotic stars. This possibility should also be explored for the bipolar OH/IR stars. If its binarity is confirmed, specially OH231.8+4.2 would be a candidate for a classification as a symbotic OH/IR star.
The Red Rectangle also shows mixed chemistry around a Post-AGB star (Waters et al. 1998a). It has a very old ( yr) disk and no OH emission, and is known to be a binary with a period of 318 days (Waelkens et al. 1996). It is unlikely to be a progenitor of the bipolar OH/IR stars, but may have a related origin.
6.4 Post-AGB life times and evolution
If the bipolar OH/IR stars are the main progenitors of PNe and white dwarfs, their observed space density can be used to infer life times of this phase.
The birth rate of white dwarfs (Iben & Laughlin 1989) corresponds to on average 1 object per hundred year within 2 kpc of the Sun. The rate for PNe is the same or slightly higher for a local column density of and an observable lifetime of yr (Zijlstra & Pottasch 1991).
Within our sample, three objects are very likely to have distances less than 2kpc: OH231.8+4.2 (1.3kpc), HD 101584 (0.6–1.1 kpc, Hipparcos parallax) and IRAS 163423814 (0.7 kpc). Roberts 22 is likely to be about 2 kpc distant or less (Sahai et al. 1999a). For all four objects, the total in-band IRAS flux is incompatible with a distance larger than 2 kpc, assuming post-AGB stellar luminosities. The remaining objects in Table 2 are fainter, but there are a few additional post-AGB objects in Table 1 (CRL 618, SAO 163075) where the IRAS flux indicates distances less than 2 kpc. All are within 200 pc of the Galactic plane and likely derive from the main disk population.
The transition time from AGB to PN can be calculated:
where is the number of observed objects within 2 kpc of the Sun, is the fraction of the white dwarf population passing through this phase and is the fraction of the transition time for which these objects have high-velocity OH outflows.
Based on the objects above, we take . We assume that , since the derived velocities of the fast wind of the stars require stellar temperatures above approximately 8000 K, as also indicated by the observed stellar types. During the first half of the transition time this suggests that the linear outflow has velocities less than our selection criterium requires. This gives a minimum life time of 1200 yr. To estimate , we note that 14 per cent of PNe are bipolar and a further 4 per cent show point-symmetric structures (Corradi & Schwarz 1995) (the fraction of strongly bipolar PNe is much less). This indicates or less. We obtain that the post-AGB transition time for the bipolar OH/IR stars is yr, with a probable value in excess of yr.
Such a large value is not compatible with the dense shells implied by the IRAS colours (e.g. Siebenmorgen et al. 1994) or the expected yr during which OH would remain observable. It should also be compared with the dynamical age of the shells, using an inner radius of cm (e.g. Table 4) and an expansion velocity of 7 km s-1 which yields about 500 yr. The dynamical age of the linear outflows is even less. We conclude that the bipolar OH/IR stars remain in this evolutionary phase far longer than the dynamical age of the envelope suggest. A near-stationary reservoir of molecular gas, such as a Keplerian disk, could act as a continuous source for the observed structures. This would go beyond the model of Section 4, since non-radial flows of gas would be required to transport the OH from a source in the disk to the bi-cones. Alternatively, observed life times can be extended if phases of fast and slow winds alternate, allowing the structures to re-form.
The main uncertainty in the time scales comes from , since is based on observed numbers and cannot easily be lower than assumed here. If all post-AGB stars pass through the bipolar/disk phase, and yr. But a high value for is implausible, based on the distinct IRAS colours in our sample, and the lack of indications for disks in the majority of PNe. However, the derived time scale is an average and it is not necessary to infer that all objects in our sample evolve so slowly. If a minority of post-AGB stars show delayed evolution, they could still dominate the observed numbers and increase the average . Thus, the post-AGB sample is likely a mixture of objects with a range of transition times.
Based on Post-AGB evolutionary tracks, the stars should evolve to much higher temperatures within the long timescales. Slower evolution of the star is possible if the core mass is very low (as suggested by Bobrowski et al. 1995) rather than high (as suggested by Mellema 1997). A different, self-consistent model to explain the apparent link between a slow star and a slow nebula is presented below.
6.5 Post-AGB accretion
The Red Rectangle is a known case where a post-AGB star is surrounded by a near-stationary (circum-binary) disk. The surface abundances of its star show that dust-depleted gas from its disk has been accreted unto the star (Van Winckel et al. 1992, Waelkens et al. 1996). If the present sample shows circumstellar disks similar to the Red Rectangle, the possibility of accretion should be considered.
The increase in during the Post-AGB evolution is caused by the slow decrease in stellar envelope mass due to nuclear burning and Post-AGB mass loss. Accretion will add gas to the envelope. This will have little effect on the AGB evolution, when the mass loss dominates the evolution, but can can become significant during the Post-AGB phase.
The Post-AGB mass-loss rate slowly decreases with increasing temperature (Pauldrach et al. 1988, Blöcker et al. 1995). If at some temperature the accretion rate equals the sum of the nuclear-burning rate and the mass-loss rate, evolution to higher temperature will cease. The required accretion rate is of the order of . The subsequent evolution will occur on the time scale of growth in core mass (causing the luminosity to increase) rather than the time scale for envelope removal. This would slow down post-AGB evolution by an order of magnitude.
Accretion could thus explain Post-AGB transition times of yr, but it requires the presence of non-expanding gas near the star. Thus, accretion self-consistently links the slow nebula with the evolutionary-challenged star. Even if only a small number of objects would experience accretion, the greatly increased lifetime would mean that such objects could dominate in observed number density. This would yield a possible explanation for the much higher occurrence of bipolar outflows among the post-AGB stars compared to the AGB stars.
The effects of accretion could explain many of the observed characteristics of the extreme bipolar objects, and link these characteristics to the presence of a circumstellar disk. The slow disk itself remains unexplained. In the Red Rectangle and related stars, it is believed to be formed due to the interaction between the binary companions. This possibility should be investigated for the present sample as well.
7 Conclusions
We have presented an investigation into the onset of bipolar structure formation for OH/IR stars. The selected stars show irregular OH spectra with high expansion velocities, consistent with a possible classification as post-AGB star. We postulate an interaction between an outer slow wind and an inner, somewhat faster wind, with at least one component showing a dependency of mass-loss rate or expansion velocity with polar angle. The main conclusions are:
1. In the presence of a post-AGB–AGB wind–wind interaction, the velocity of the swept-up shell is predicted to increase linearly with distance from the star. The OH data confirms the presence of such a linear outflow component. A torus-like component is also seen with expansion velocity of typically 25 km .
2. All objects with a well-defined bipolar morphology and high-velocity outflows have IRAS colours closely similar to those of young outflow sources. This indicates that similar morphologies may be present in both evolutionary phases.
3. Two of the selected stars show evidence for a chemical dichotomy, with both crystalline silicates and PAHs or other carbon molecules being present. The silicates are probably located in the torus (as shown by the OH data for Roberts 22).
4. IRAS 163423814 shows four point-like sources located symmetrically around the central star, at a distance consistent with the outer edge of the circumstellar torus. The nature of these (scattering?) sources is not clear.
5. For five objects where data for the central stars are available, the observed spectral types are M9, F5, A2, B9 and Be. However, the F star has been suggested to have an earlier underlying type (late or early B), affected by an extended atmosphere. The A star (Roberts 22) shows indications for ionization also suggesting an earlier type. For IRAS 163423814, modeling implies a central star with a temperature around 15 kK, or late B. The present wind velocities of up to a few 100 km s-1 appear consistent with spectral type around late B.
6. Two evolutionary sequences are indicated. The strongly bipolar objects appear related to the (few) planetary nebulae with similar morphologies and may constitute their progenitors. Two objects show colours and chemistry similar to the infrared-bright, late IR-[WC] stars and may be evolutionary related. One bipolar OH/IR star is known on the AGB (OH 19.21.0), which is a possible progenitor of the bipolar post-AGB stars.
7. OH231.8+4.2 has a Mira central star but also a fast wind. Its wind velocity also indicates a B-star. The central star is therefore likely a binary. The presence of a Mira precludes a B-type main sequence star, and therefore the companion appears to be a post-AGB star. Following Cohen et al. 1985, we suggest OH231.8+4.2 is a symbiotic OH/IR star.
8. The lifetime of this phase of bipolar post-AGB OH/IR stars is found to be of the order of yr. This is much longer than expected from normal post-AGB evolution. Accretion from a circumstellar torus on a post-AGB star could stall its evolution near the observed spectral types. Such a process could explain the apparent link between retained disks and retarded stellar evolution.
Acknowledgments
Some of the associations of the detected IRAS sources are based on the SIMBAD data retrieval system, database of the Strasbourg, France, astronomical Data Center. The National Radio Astronomy Observatory is operated under cooperative agreement with the National Science Foundation. The Australia Telescope National Facility is funded by the Commonwealth of Australia for operation as a National Facility managed by CSIRO. MERLIN is operated by the University of Manchester as a national facility of the Particle Physics & Astronomy Research Council. IRAS data were obtained using the IRAS database server (IRAS Software Telescope) of the Space Research Organisation of the Netherlands (SRON), funded by the Netherlands Organisation for Scientific Research (NWO) and also partly funded through the Air Force Office of Scientific Research, grants AFOSR 86-0140 and AFOSR 89-0320. This research has been supported by dedicated grants from the Leidse Kerkhoven Bosscha Fonds, SAAO, MSSSO and ESO. The VLA staff is thanked for their assistance, and for their efficient archive. We have also made use of the HST and the La Palma archives. Griet Van de Steene is thanked for help with the reduction of the data. Richard Hook is acknowledged for helping with the astrometry of the HST image of IRAS 163423814. Hans Olofsson is thanked for the use of the CO data on HD 101584. We thank Jim Caswell and Miller Goss for useful discussions and Lars-Ake Nyman for very helpful comments on this paper. This paper has grown primarily out of the original work (and thesis) of Peter te Lintel Hekkert.
References
- [1] Alcolea J., Bujarrabal V., Sánchez Contreras C., 1996, A&A, 312, 560
- [2] Allen D.A., Hyland A.R., Caswell J.L., 1980, MNRAS, 192, 505
- [3] Assendorp R., Bontekoe T.R., de Jonge A.R.W., Kester D.J.M., Roelfsema P.R., Wesselius P.R., 1995, A&AS, 110, 395
- [4] Bakker E.J., Lamers H.J.G.L.M., Waters L.B.F.M., Waelkens C., Trams N.R., van Winckel H., 1996a, A&A, 307, 869
- [5] Bakker E.J., Lamers H.J.G.L.M., Waters L.B.F.M., Waelkens C., 1996b, A&A, 310, 861
- [6] Bakker E.J., van Dishoeck E.F., Waters L.B.F.M., Schoenmaker T., 1997, A&A, 323, 469
- [7] Balick B., Preston H.L., Icke V., 1987 AJ, 94, 1641
- [8] Barlow M.J., 1998, A&SS, 255, 315
- [9] Barral J.F., Canto J., 1981, Rev. Mex. Ast. Ap. 5, 101
- [10] Baud B., Habing H.J., 1983, A&A, 127, 73
- [11] Bautista M.A., Pradhan A.K., 1998, ApJ, 492, 650
- [12] Bedding T.R., Zijlstra A.A., von der Lühe O., Robertson J.G., Marson R.G., Barton J.R., Carter B.S., 1997, MNRAS, 286 957
- [13] Bidelman W.P., 1951, ApJ, 113, 304
- [14] Blöcker T., 1995, A&A, 299, 755
- [15] Bobrowski M., Zijlstra A.A., Grebel E.K., Tinney C.G., te Lintel Hekkert P., Van de Steene G.C., Likkel L., Bedding T.R., 1995, ApJ, 446, L89
- [16] Booth R.S., Norris R.P., Porter N.D., Kus A.J., 1981, Nature, 290, 382
- [17] Bryce M., Lopez J.A., Holloway A.J., Meaburn J., 1997, ApJ, 487, L161
- [18] Borkowski K.J., Blondin J.M., Harrington J.P., 1987, ApJ, 482, L97
- [19] Bowers P.F., Johnston K.J., de Vegt C., 1989, ApJ, 340 479
- [20] Bowers P.F., Morris, M., 1984, ApJ, 276, 646
- [21] Bowers P.F., 1991, ApJS, 76, 1099
- [22] Bujarrabal V., Bachiller R., 1991, A&A, 242, 247
- [23] Bujarrabal V., Alcolea J., Sahai R., Zamoramo J., Zijlstra A.A., 1998, A&A, 331, 361
- [24] Cernicharo J., Guelin M., Penalver J., Martin-Pintado J., Mauersberger M., 1989, A&A, 222, L1
- [25] Chapman, J.M., 1985, PhD thesis, Victoria University of Manchester
- [26] Chapman J.M., 1988, MNRAS, 230, 415
- [27] Chapman J.M., Cohen R.J., 1985, MNRAS, 212, 375
- [28] Chapman J.M., Cohen R.J., Saikia D.J. 1991, MNRAS 249 227
- [29] Chapman J.M., Sivagnanam P., Cohen R.J., Le Squeren A.M., 1994, MNRAS, 268 475
- [30] Cohen J.G., Frogel J.A., 1977, ApJ, 211, 178
- [31] Cohen M., Dopita M.A., Schwartz R.D., Tielens A.G.G.M., 1985, ApJ, 297, 702
- [32] Cohen M., Barlow M.J., Sylvester R.J.. Liu X.-W., Cox P., Lim, T., Schmitt B., Speck A.K, 1999, ApJ, 513, L135
- [33] Cohen, R.J., 1989, Rep. Prog. Phys., 52, 881
- [34] Cohen R.J., Downs G., Emerson R., Grimm M., Gulkis S., Stevens G., Tarter J., 1987, MNRAS, 225, 491
- [35] Condon J.J, Cotton W.D., Greisen E.W., Yin Q.F., Perley R.A., Taylor G.B., Broderick J.J., 1998, AJ, 115, 1693
- [36] Corradi R.L.M., Schwarz H.E., 1995, A&A, 293, 871
- [37] Corradi R.L.M. 1995, MNRAS, 276, 521
- [38] Coulson I.M., Walther D.M., Dent W.R.F., 1998, MNRAS, 296, 934
- [39] de Graauw Th., Haser L.N., Beintema D.A., et al., 1996, A&A 315, L49
- [40] Deguchi S., Watson W.D., 1986, ApJ, 300, L15
- [41] Diamond P.J., Norris R.P., Booth R.S., 1983, A&A, 124, L4
- [42] Diamond P.J., Norris R.P., Booth R.S., 1984, MNRAS, 207, 611
- [43] Diamond P.J., Norris R.P., Rowland P.R., Booth R.S., Nyman L.-A., 1985, MNRAS, 212, 1
- [44] Dickinson, D.F. & Chaisson E.J., 1973, ApJLett, 181, L135
- [45] Eder J.A., Lewis B.M., Terzian Y., 1988, ApJS, 66, 183
- [46] Elitzur M., 1992, Astronomical Masers (Kluwer, Dordrecht)
- [47] Emerson J.P., 1987, in: Formation and evolution of low mass stars, ed. A.K. Dupree & M.T.V.T. Lago, NATO ASI Series C, (Kluwer, Dordrecht), Vol. 241, p.193
- [48] Feast M.W., Catchpole, R.M., Whitelock, P.A., Roberts, G., Jones, J.S., Carter, B.S. 1983, MNRAS, 203, 1207
- [49] Field D. 1985, MNRAS, 217, 1
- [50] Field D., Gray M.D., 1988, MNRAS, 234,353
- [51] Frank A., Mellema G., 1994, A&A, 289, 937
- [52] Frank A., Balick B., Icke V., Mellema G., 1993, ApJ 404, L25
- [53] Garcia-Segura G., Langer N., Rózyczka M., Franco J., 1999, ApJ, 517, 767
- [54] Gaylard M.J., Whitelock P.A., 1989, MNRAS, 235, 123
- [55] Gaylard M.J., West, M.E., Whitelock, P.A., Cohen, R.J., 1989, MNRAS, 236, 247
- [56] Górny S.K., Schwarz H.E., Corradi R.L.M., van Winckel, H, 1999,A&AS, 136, 145
- [57] Habing H.J., Tignon J., Tielens A.G.G.M., 1994, A&A, 286, 523
- [58] Habing H.J., 1996, Astron. Astroph. Rev., 7, 97
- [59] Hatchell J., Fuller G.A., Ladd E.F., 1999, A&A, 344, 687
- [60] Herman J., 1983, The Nature of OH/IR Stars, PhD Thesis, University of Leiden
- [61] Herman J., Baud B., Habing H.J., Winnberg A., 1985, A&A, 143, 122
- [62] Herwig F., 2000, A&A, 360, 925
- [63] Huggins P.J., Glassgold A.E., 1982, AJ, 87, 1828
- [64] Iben Jr. I., Laughlin G., 1989, ApJ, 341, 312
- [65] Icke V., 1988, A&A, 202, 177
- [66] Icke V., Preston H.L., 1989, A&A, 211, 409
- [67] Johnson J.J., Jones T.J., 1991, AJ, 101, 1735
- [68] Jura M., Morris M., 1985, ApJ, 292, 487
- [69] Jura M., Kahane C., 1999, ApJ, 521, 302
- [70] Kahn F.D., West, K., 1985, Royal Observatory Star Formation Workshop, p. 129
- [71] Kastner J.H., Weintraub D.A., Zuckerman B., Becklin E.E., Mclean I., Gatley I., 1992, ApJ, 398, 552
- [72] Kastner J.H., Weintraub D.A., Merrill K.M., Gatley I., 1998, AJ, 116, 1412
- [73] Kawabe R., Ishiguro M., Kasuga T., Morita K.-I., Ukita N., Kobayashi H., Okumura S., Fomalont E., Kaifu N, 1987, ApJ, 314, 322
- [74] Kessler M.F., Steinz J.A., Anderegg M.E., et al., 1996, A&A 315, L27
- [75] Knapp G.R., Morris M.,1985, ApJ, 292, 640
- [76] Knapp G.R., Jorissen A., Young K., 1997, A&A, 326, 318
- [77] Kwok S., Purton C.R., FitzGerald M.P., 1978, ApJ, 219, L125
- [78] Kwok S., Bignell R.C., 1984, ApJ, 276, 544
- [79] Kwok S., Hrivnak B.J., Geballe T.R., 1995, ApJ, 454, 394
- [80] Lewis B.M., Eder J.A., Terzian Y., 1985, Nature, 313, 200
- [81] Likkel L., 1989, ApJ, 344, 350
- [82] Likkel L., Morris M., Omont A., Forveille T., 1987, A&A, 173, L11
- [83] Likkel L., Morris M., 1988, ApJ, 329, 914
- [84] Likkel L., Morris M., Maddalena R.J., 1992, A&A, 256, 581
- [85] Lindqvist M., Winnberg A., Habing H.J., Mattews H.E., 1992, A&AS, 92, 43
- [86] Little-Marenin I.R, 1986, ApJ, 307, L15
- [87] Lloyd-Evans T., 1990, MNRAS, 243, 336
- [88] Lopez J.A., Meaburn J., Palmer J.W., 1993, ApJ, 415, L135
- [89] Loup C., Forveille T., Omont A., Nyman L.-A., 1990, A&A, 227, L29
- [90] Loup C., Forveille Th., Omont A., Paul J.F., 1993, A&AS, 99, 291
- [91] Meixner M., Ueta T. Dayal A., Hora J.L., Fazio G., Hrivnak B.J., Skinner C.J., Hoffmann W.F., Deutsch L.K., 1999, ApJS, 122, 221
- [92] Mellema G., A&A, 321, L29
- [93] Molster F., Waters L.B.F.M., de Jong T., Prusti T., Zijlstra A.A., Meixner M., 1996, in : IAU Symposium 180, Planetary Nebulae, ed. H. Habing, H.J.G.L.M. Lamers (Kluwer, Dordrecht) p.361
- [94] Molster F.J., Yamamura I., Waters L.B.F.M., Tielens A.G.G.M., de Graauw Th., de Jong T., de Koter A., Malfait K., van den Ancker M.E., van Winckel H., Voors R.H.M., Waelkens C., 1999, Nature, 401, 563
- [95] Morris M., Bowers P.F., Turner B.E., 1982, AJ, 259, 625
- [96] Morris M., Guilloteau S., Lucas R., Omont A., 1987, ApJ, 321 888.
- [97] Mutel R.L., Fix J.D., Benson J.M., Webber J.C., 1979, ApJ, 228, 771
- [98] Norris R., Kesteven M.J., Wellington K.J., Batty M.J., 1988, ApJS, 67, 85
- [99] Olofsson H., Nyman L.-Å., 1999, A&A, 347, 194
- [100] Oudmaijer R.D., van der Veen W.E.C.J., Waters L.B.F.M., Trams N.R., Waelkens C., Engelsman E., 1992, A&AS, 96, 625
- [101] Parthasarthy M., Pottasch S.R., 1986, A&A, 154, L16
- [102] Pauldrach A., Puls J., Kudritzki R.P., Méndez R.H., Heap S.R., 1988, A&A, 207, 123
- [103] Pottasch S.R., Bignell C., Olling R., Zijlstra A.A., 1988, A&A, 205, 248
- [104] Reid M.J., Muhlemann D.O., Moran J.M., Johnston K.J., Schwartz P.R., 1977, ApJ, 214, 60
- [105] Reipurth B., 1987, Nature, 325 787
- [106] Riera A., Garcia-Lario P., Manchado A., Pottasch S.R., Raga A.C., 1995, A&A, 302, 137
- [107] Roberts M.S, 1962, AJ, 67, 79
- [108] Sahai, R., Trauger, J.T., 1998, AJ, 116, 1357
- [109] Sahai R., Zijlstra A.A., Bujarrabal V., te Lintel Hekkert P., 1999a, AJ, 117, 1408
- [110] Sahai R., te Lintel Hekkert P., Morris M., Zijlstra A.A., Likkel L., 1999b, ApJ, 514, L115
- [111] Sahai R., Bujarrabal V., Castro-Carrizo A., Zijlstra A.A., 2000, A&A (Letters), 360, L9
- [112] Sánchez Contreras C., Alcolea J., Bujarrabal V., Neri R., 1997, A&A, 327, 689
- [113] Schaeidt S.G., Morris P.W., Salama A., et al.: 1996, A&A 315, L55
- [114] Schönberner, D. 1989, in: From Miras to Planetary Nebulae, Which Way for Stellar Evolution, ed. M.O. Mennessier and A. Omont (Editions Frontieres, Gif sur Yvette), p.355
- [115] Szczerba R., Omont A., Volk K., Cox P., Kwok S., 1997, A&A, 317, 859
- [116] Sevenster M., Chapman J.M., Habing H.J., Killeen N.E.B., Lindqvist M., 1997a, A&AS, 122, 79
- [117] Sevenster M., Chapman J.M., Habing H.J., Killeen N.E.B., Lindqvist M., 1997b, A&AS, 124, 509
- [118] Shepherd M.C., Cohen, R.J., Gaylard, M.J., West M.E., 1989, Nature, 344, 522
- [119] Siebenmorgen R., Zijlstra A.A., Krügel E., 1994, MNRAS, 271, 449
- [120] Shu F.H., Ruden S.P., Lada C.J., Lizano S, 1991, ApJ, 370, L31
- [121] Slijkhuis S., de Jong T., Hu, J.Y. 1991, A&A, 248, 547
- [122] Soker N., 1998, ApJ, 496, 833
- [123] Sun J., Kwok S., 1987, A&A, 185 258
- [124] Szymczak M., Cohen R.J., Richards A.M.S., 1998, MNRAS, 297, 1151
- [125] te Lintel Hekkert P., 1991, A&A, 248, 209
- [126] te Lintel Hekkert P., Habing H.J., Caswell J.L., Norris R.P., Haynes R.F., 1988, A&A, 202, L19
- [127] te Lintel Hekkert P., Versteege-Hensel H.A., Habing H.J., Wiertz M., 1989, A&AS, 78, 399
- [128] te Lintel Hekkert P., Caswell J.L., Haynes R.F., Norris R.P., Habing H.J., 1991, A&AS, 90, 327
- [129] te Lintel Hekkert P., Chapman, J.M., Zijlstra A.A., 1992, ApJ, 390 L23
- [130] te Lintel Hekkert P. & Chapman J.M., 1996, A&AS, 119, 459
- [131] Trams N.R., Lamers H.J.G.L.M., van der Veen W.E.C.J., Waelkens C., Waters L.B.F.M., 1990, A&A, 233, 153
- [132] Trams N.R., van Loon J.Th., Zijlstra A.A., Groenewegen M.A.T., Waters L.B.F.M., Whitelock P.A., Blommaert J.A.D.L., Loup C., Siebenmorgen R., Heske A., 1999, A&A, 344, L17
- [133] Turner B.E., 1971, ApL, 8, 73
- [134] Tuthill P.G., Haniff C.A., Baldwin J.E., Feast M.W., 1994, MNRAS, 266, 745
- [135] Valentijn E.A., Feuchtgruber H., Kester D.J.M., et al., 1996, A&A 315, L60
- [136] van der Veen W.E.C.J., Habing H.J., Geballe T.R., 1989, A&A, 226, 108
- [137] van der Veen W.E.C.J., Trams N.R., Waters L.B.F.M., 1993, A&A, 269, 231
- [138] Van Winckel H., Mathis J.S., Waelkens C., 1992, Nature, 356, 500
- [139] Vassiliadis E., Wood, P.R., 1993, ApJ, 413, 64
- [140] Waelkens C., Van Winckel H., Waters L.B.F.M, Bakker E.J., 1996, A&A, 314, L17
- [141] Walsh, A.J., Hyland A.R., Robertson G., Burton M.G., 1997, MNRAS, 291, 261
- [142] Waters L.B.F.M., Cami J., de Jong T., Molster F.J., van Loon J.Th., Bouwman J., de Koter A., Waelkens C., van Winckel H., Morris P.W., 1998a, Nature, 391, 868
- [143] Waters L.B.F.M., Beintema D., Zijlstra A.A., de Koter A., Molster F.J., Bouwman J., de Jong T., Pottasch S.R., de Graauw Th., 1998b, A&A, 331, L61
- [144] Welty A.D., Fix J.D., Mutel R.L., 1987, ApJ, 318, 852
- [145] Willems F., de Jong T., 1986, ApJ, 309, L39
- [146] Wilson W.J., Barret, A.H., 1968, Science, 161, 778
- [147] Zijlstra A.A., 1991, MNRAS, 248, 11p
- [148] Zijlstra A.A., 2000, in: Low mass Wolf-Rayet Stars: origin and evolution, (Amsterdam 1999) in press
- [149] Zijlstra A.A., te Lintel Hekkert P., Pottasch S.R., Caswell J.L., Ratag M., Habing H.J., 1989, A&A, 217 157
- [150] Zijlstra A.A., Roelfsema P.R., Engels D., te Lintel Hekkert P., Pottasch S.R., Umana G., 1990, MNRAS, 246, 217
- [151] Zijlstra A.A., Gaylard M.J., te Lintel Hekkert P., Menzies J.W., Nyman L.-A., Schwarz H.E., 1991, A&A, 243, L9
- [152] Zijlstra A.A., Pottasch S.R., 1991, A&A, 243, 478
- [153] Zuckerman B., Dyck H.M., 1986, ApJ, 311, 345
- [154] Zuckerman B., Lo K.Y., 1987, A&A, 173, 263
- [155] Zweigle J., Neri R., Bachiller R., Bujarrabal V., Alcolea J., 1997, A&A, 324, 624