On the apparent coupling of neutral hydrogen and dark matter in spiral galaxies
Abstract
We have studied a mass model for spiral galaxies in which the dark matter surface density is a scaled version of the observed HI surface density. Applying this mass model to a sample of 24 spiral galaxies with reliable rotation curves one obtains good fits for most galaxies. The scaling factors cluster around 7, after correction for the presence of primordial helium. But for several cases different, often larger, values are found. For galaxies that can not be fitted well the discrepancy occurs at large radii and results from a fairly rapid decline of the HI surface density in the outermost regions. Because of such imperfections and in view of possible selection effects it is not possible to conclude here that there is a real coupling between HI and dark matter in spiral galaxies.
1 Introduction
The first indications that spiral galaxies are surrounded by unseen matter date to the early seventies (Freeman 1970; Roberts 1975; Shostak 1973). Later 21-cm line studies, especially those of Bosma (1978,1981) and Begeman (1987), have all confirmed this discovery. Dark matter manifests itself already in the outer(most) parts of the luminous body of spiral galaxies (Rubin 1978; Kent 1986), but its main signature is the general flatness of rotation curves well outside the optical radius.
Bosma (1978, 1981) noted a curious result for the galaxies in his sample: the total surface density of matter needed to explain the observed rotation curve in the outer region, i.e. outside the optical radius, was roughly proportional to the surface density of neutral hydrogen. Later work has shown that this proportionality not only holds for the high surface brightness (HSB) galaxies studied by Bosma, but also for dwarf galaxies (Carignan 1985a; Carignan & Puche 1990; Jobin & Carignan 1990).
These results, and other considerations, have led Pfenniger et al. (1994a, b) to the hypothesis that the dark matter surrounding spiral galaxies consists of cold gas, mainly in the form of molecular hydrogen. The spatial distribution of this cold gas should be similar to that of the observed neutral hydrogen.
As the contribution of luminous matter to the total mass density is negligible in the outer parts (under the assumption that the mass-to-light ratio of the luminous matter is independent of radius), Bosma’s relationship is equivalent to a proportionality of dark matter and neutral hydrogen.
This apparent coupling of dark matter and neutral hydrogen deserves closer scrutiny, because it seems at odds with the current view that dark haloes are triaxial (but not extremely flattened) and that they consist of non-baryonic material. Rather, this coupling suggests possible support for the hypothesis put forth by Pfenniger et al. (1994a).
Several questions should be considered: (i) How tight is this relation between the surface densities of HI and dark matter for the galaxies with the best available data? (ii) To what extent does the relation depend on the use of the so-called maximum disc assumption? (iii) Does the relation also hold for the low surface brightness (LSB) galaxies?
In this paper we investigate the apparent coupling of dark matter and neutral hydrogen for a sample of 24 spiral galaxies with good rotation curves. The sample contains both HSB and dwarf galaxies. Unfortunately the quality of the rotation curves for LSB galaxies is still rather poor and we have decided not to include those galaxies in the present discussion.
We wish to stress at the outset that there is a potentially powerful selection effect that may cause a relationship between the surface densities of HI and dark matter for the galaxies in our sample. This is because the HI surface density distributions of the galaxies in our sample have the common characteristic that the highest values in the inner regions, as well as the lowest values in the outer regions are similar from galaxy to galaxy (the latter being linked to the sensitivity reached in the observations). As a result, a large radial extent implies a large radial scale length of HI and vice versa. In section 5 we discuss how this can lead to a proportionality between dark matter and HI.
2 Mass model
To study the mass distribution, and in particular the apparent coupling between the dark matter and HI, we use axisymmetric distributions of matter containing three components. These are used to model the derived rotation curves. The various components of the mass model are:
-
Stars:
The stars are distributed in a disc. If present, we also include a bulge component. The radial surface density profiles of the stellar components are estimated using luminosity profiles from the literature, assuming a mass-to-light ratio independent of radius. We further assume that the stellar disc has an exponential vertical density profile, with a scale height that is one fifth of the optical disc scale length (van der Kruit & Searle 1981a,1981b).
-
Gas:
We use the observed radial surface density distribution of HI and we assume that the vertical distribution mimics that of the stars. In reality most of the neutral hydrogen lies in a thin disc, but our results are not sensitive to the detailed distribution because in the inner regions (where the thick disc description for HI does not hold) the contribution of HI to the gravitational field can be safely neglected. Apart from neutral hydrogen, detectable through the 21-cm line, galaxies contain molecular gas. We assume that the bulk of this molecular gas follows the surface density profile of the stellar component. In this way the presence of molecular gas is taken into account in the value of the mass-to-light ratio of the stellar component.
-
Dark matter:
Usually a spherical halo is used to describe the density distribution of the dark matter. If the dark matter and neutral hydrogen are indeed coupled, as Pfenniger et al. (1994a) argue, it is reasonable to assume that their spatial distributions are similar. In this paper we therefore assume that the surface density of dark matter is proportional to the observed surface density of neutral hydrogen. The vertical scale height of the dark matter, like that of HI, is taken equal to that of the stars. For the discussion in this paper the choice of the scale height is fairly arbitrary because the changes in calculated rotation velocities, given a surface density profile, are small when the scale height is varied. But the derived total masses do depend on scale height.
The mass model can be fitted to the observations in two ways: one can fit the model rotation curve to the observed one, or one can compare the total surface density, calculated from the rotation curve, to the measured surface densities of stars and HI. We prefer to fit the circular velocities calculated from the mass model to the observed rotation curves. To do so, we compute the rotation velocity of a disc using (Cuddeford 1993):
| (1) |
where is the Bessel function of order and where is given by:
| (2) |
In these equations is the surface density of the disc as a function of radius , and is the scale height of the disc, assuming a density profile given by .
Equation (1) requires that the surface density is known out to infinity. This can only be achieved through extrapolation, for which we assumed an exponential law. At large radii the surface densities are low, thus giving rise to minor contributions to the integral. Finally, the model rotation curve is calculated by adding the circular velocities, calculated for the different components, in quadrature:
| (3) |
where denotes the surface density of the dark matter component and where is the surface density of the HI disc.
In making the fits we have three free parameters at our disposal: , and . For late type galaxies, that show no clear signs of a bulge, we omitted the (spherical) bulge contribution. The fits were done by eye, in such a way that the model rotation curve explained the observed rotation curve as far out as possible.
| Name | Type | Distance | Ref. | Name | Type | Distance | Ref. | ||||
|---|---|---|---|---|---|---|---|---|---|---|---|
| (1) | (2) | (3) | (4) | (5) | (6) | (1) | (2) | (3) | (4) | (5) | (6) |
| [Mpc] | [mag] | [km/s] | [Mpc] | [mag] | [km/s] | ||||||
| DDO 154 | Irr | 4.0 | –13.8 | 48 | 1, 2 | NGC 3109 | Sm | 1.7 | –16.8 | 67 | 14, 15 |
| DDO 168 | Irr | 3.5 | –15.2 | 55 | 3 | NGC 3198 | Sc | 9.4 | –19.4 | 157 | 14, 16 |
| DDO 170 | Sm | 12.0 | –14.5 | 66 | 4 | NGC 5033 | Sbc | 11.9 | –20.2 | 225 | 10, 13 |
| NGC 55 | Sm | 1.6 | –18.6 | 87 | 5 | NGC 5371 | Sb | 34.8 | –21.7 | 242 | 13, 20 |
| NGC 247 | Sd | 2.5 | –18.0 | 108 | 6, 7 | NGC 5533 | Sab | 55.8 | –21.4 | 302 | 3, 9, 18 |
| NGC 300 | Sd | 1.8 | –17.8 | 97 | 8, 7 | NGC 5585 | Sd | 6.2 | –17.5 | 92 | 19 |
| NGC 801 | Sc | 79.2 | –21.7 | 238 | 3, 10 | NGC 6503 | Scd | 5.9 | –18.7 | 121 | 12, 20 |
| NGC 1560 | Sd | 3.0 | –15.9 | 79 | 12 | NGC 6674 | Sb | 49.3 | –21.6 | 291 | 3,9 |
| NGC 2403 | Scd | 3.3 | –19.3 | 136 | 13, 14, 23 | NGC 6946 | Scd | 10.1 | –21.4 | 170 | 11, 17 |
| NGC 2841 | Sb | 18.0 | –21.7 | 326 | 13, 14 | NGC 7331 | Sb | 14.9 | –21.4 | 257 | 12, 14 |
| NGC 2903 | Sbc | 6.4 | –20.0 | 216 | 13, 14 | UGC 2259 | Sdm | 9.8 | –17.0 | 90 | 21, 14 |
| NGC 2998 | Sc | 67.4 | –21.9 | 214 | 3, 10 | UGC 2285 | Sc | 78.7 | –22.8 | 298 | 10, 22 |
Galaxy types, listed in column (2), have been taken from Broeils (1992a) or from the original papers. Distances as given in Broeils (1992a) have been adopted (). Total blue magnitudes have been taken from Broeils (1992a) as well, when available. If not, we used values listed in the original papers. is the maximum observed rotation velocity of the galaxy.
| Key to the references: | ||
| 1 Carignan & Freeman (1988) | 9 Broeils & Knapen (1991) | 17 Kamphuis (1993) |
| 2 Carignan & Beaulieu (1989) | 10 Kent (1986) | 18 Kent (1984) |
| 3 Broeils (1992a) | 11 Carignan et al. (1990) | 19 Côte, Carignan & Sancisi (1991) |
| 4 Lake, Schommer & van Gorkom (1990) | 12 Broeils (1992b) | 20 Wevers (1984) |
| 5 Puche, Carignan & Wainscoat (1991) | 13 Begeman (1987) | 21 Carignan, Sancisi & van Albada (1988) |
| 6 Carignan & Puche (1990) | 14 Kent (1987) | 22 Roelfsema & Allen (1985) |
| 7 Carignan (1985b) | 15 Jobin & Carignan (1990) | 23 Sicking (1997) |
| 8 Puche, Carignan & Bosma (1990) | 16 Begeman (1989) |
3 The sample
The sample used for this study is essentially that of Broeils (1992a), with galaxies characterized by the following:
-
The HI rotation curve has been measured with the Westerbork Synthesis Radio Telescope or with the Very Large Array.
-
The galaxy has a smooth and fairly symmetric velocity field and gas distribution.
-
High precision photometric data are available.
-
Inclination and position angle have been derived kinematically, using a tilted ring analysis of the velocity field.
We have included NGC 5371 (Begeman 1987), which was not used by Broeils ‘because of its clumpy gas distribution and asymmetric velocity field’. For our purpose the properties of this galaxy are sufficiently regular. We have further added NGC 6946 using data from Kamphuis (1993). NGC 1003 from Broeils’ sample could not be used, because the data are not readily available. The selected galaxies are listed in Table 1, together with some of their basic properties. The distances given in this table are based on the values∗*∗*Adopting 75 km/s/Mpc. given in Broeils (1992a). For NGC 5371 and NGC 6946 distances from Begeman (1987) and Carignan et al. (1990) have been used.
The galaxies in Table 1 span a considerable range in Hubble type, from Sab to Irr. Although most galaxies are of type Sc or later, the sample allows for a systematic study of galaxy properties from types Sb to Irr. Note that our sample does not include LSB galaxies.
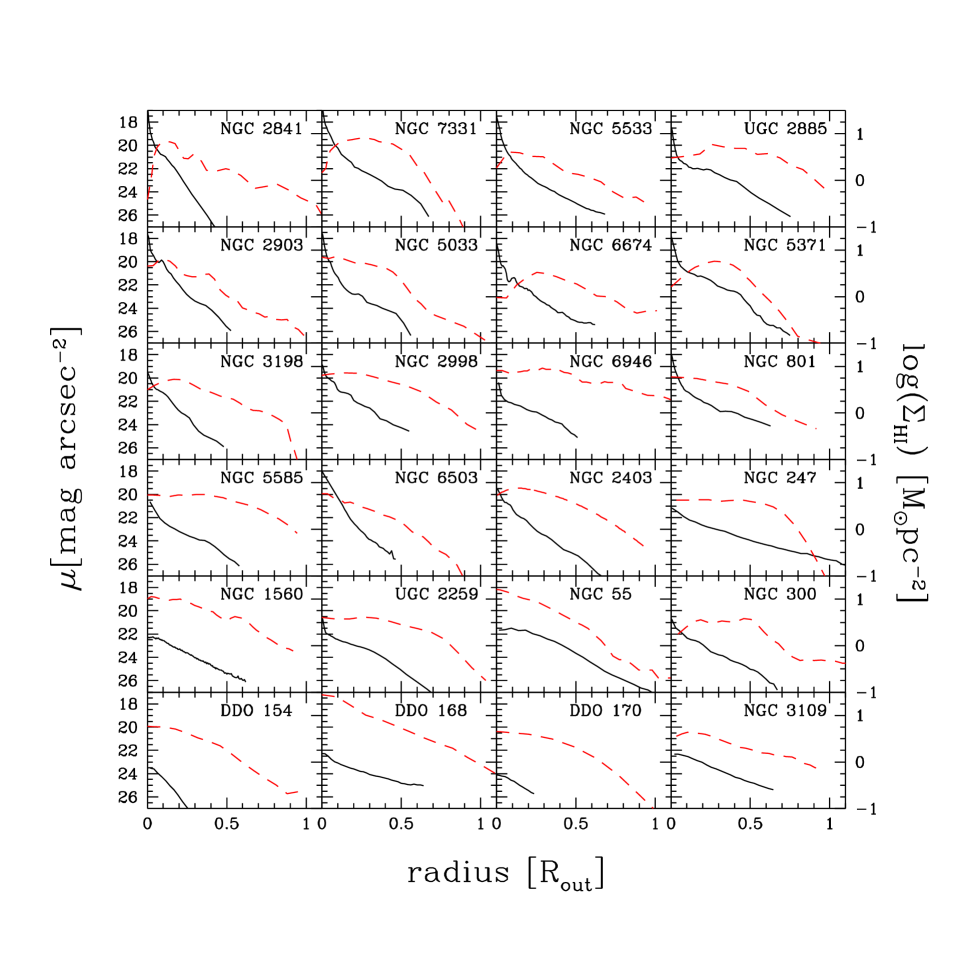
The light profiles and HI surface density distributions for the galaxies in Table 1 are shown in Figure 2. Apart from the occasional presence of a bulge, most light profiles are essentially exponential. The HI surface density distributions show a larger variety of shapes, but the maximum surface densities reached in the inner regions are remarkably similar: about . Note the larger radial extent of the neutral hydrogen component compared to the light, and the steepening of the HI profile in the outer region for several galaxies. However, for some of the dwarf galaxies the scalelengths of light and HI gas are quite similar.
The HI surface density profiles in Figure 2 have been derived from 21-cm line synthesis observations. For large galaxies the HI flux in the outer parts may therefore have been underestimated. As a consequence of the missing “large scale length” HI components, rotation curves in Figure 4 may show a decrease in the outermost parts. Comparison of the total flux with that measured with single dish telescopes (Rots 1980) shows that the profiles of NGC 55 and 300 may well suffer from this. This may also be true for NGC 3109.
4 Results of mass model fits
In this section we present and discuss the fits of the adopted mass model to the rotation curves of the 24 galaxies in Table 1. In Table 2 we list the values of the fitted parameters and the inferred masses of the various components.
| Name | Type | |||||||
| (1) | (2) | (3) | (4) | (5) | (6) | (7) | (8) | (9) |
| DDO 154 | Irr | 1.0 | - | 8.0 | 0.052 | - | 0.28 | 2.6 |
| DDO 168 | Irr | 1.2 | - | 7.0 | 0.23 | - | 0.21 | 1.9 |
| DDO 170 | Sm | 3.5 | - | 9.5 | 0.34 | - | 0.45 | 5.3 |
| NGC 55 | Sm | 0.5 | - | 7.0 | 2.2 | - | 0.9 | 9.4 |
| NGC 247 | Sd | 4.4 | - | 8.0 | 11 | - | 0.8 | 18 |
| NGC 300 | Sd | 2.8 | - | 11.0 | 5.9 | - | 0.7 | 14 |
| NGC 801 | Sc | 2.8 | 4.5 | 9.0 | 160 | 72 | 22 | 450 |
| NGC 1560 | Sd | 1.0 | - | 7.0 | 0.36 | - | 0.82 | 6.9 |
| NGC 2403 | Scd | 1.8 | - | 9.5 | 15 | - | 3.1 | 46 |
| NGC 2841 | Sb | 5.3 | 3.1 | 23.0 | 280 | 68 | 16 | 730 |
| NGC 2903 | Sbc | 2.7 | - | 37.0 | 43 | - | 2.4 | 130 |
| NGC 2998 | Sc | 1.5 | 5.0 | 7.0 | 130 | 8.5 | 23 | 320 |
| NGC 3109 | Sm | 0.8 | - | 13.5 | 0.66 | - | 0.49 | 7.8 |
| NGC 3198 | Sc | 3.9 | - | 12.5 | 35 | - | 5.0 | 100 |
| NGC 5033 | Sbc | 5.8 | - | 12.0 | 110 | - | 6.5 | 190 |
| NGC 5371 | Sb | 2.9 | 3.3 | 8.0 | 120 | 60 | 8.6 | 260 |
| NGC 5533 | Sab | 5.0 | 8.0 | 16.5 | 220 | 96 | 25 | 750 |
| NGC 5585 | Sd | 2.0 | - | 9.0 | 3.2 | - | 1.3 | 16 |
| NGC 6503 | Scd | 1.2 | - | 17.5 | 5.6 | - | 1.6 | 35 |
| NGC 6674 | Sb | 4.5 | 7.0 | 9.0 | 210 | 110 | 30 | 620 |
| NGC 6946 | Scd | 1.2 | - | 4.5 | 53 | - | 20 | 160 |
| NGC 7331 | Sb | 4.6 | 1.8 | 8.0 | 110 | 59 | 11 | 270 |
| UGC 2259 | Sdm | 4.0 | - | 10.0 | 3.9 | - | 0.42 | 8.5 |
| UGC 2885 | Sc | 1.5 | 7.5 | 9.5 | 270 | 210 | 44 | 940 |
Mass-to-light ratios in columns (3) and (4) are given in units of ; masses in columns (6), (7), (8) and (9) are given in . Column (9) gives the total mass of the model.
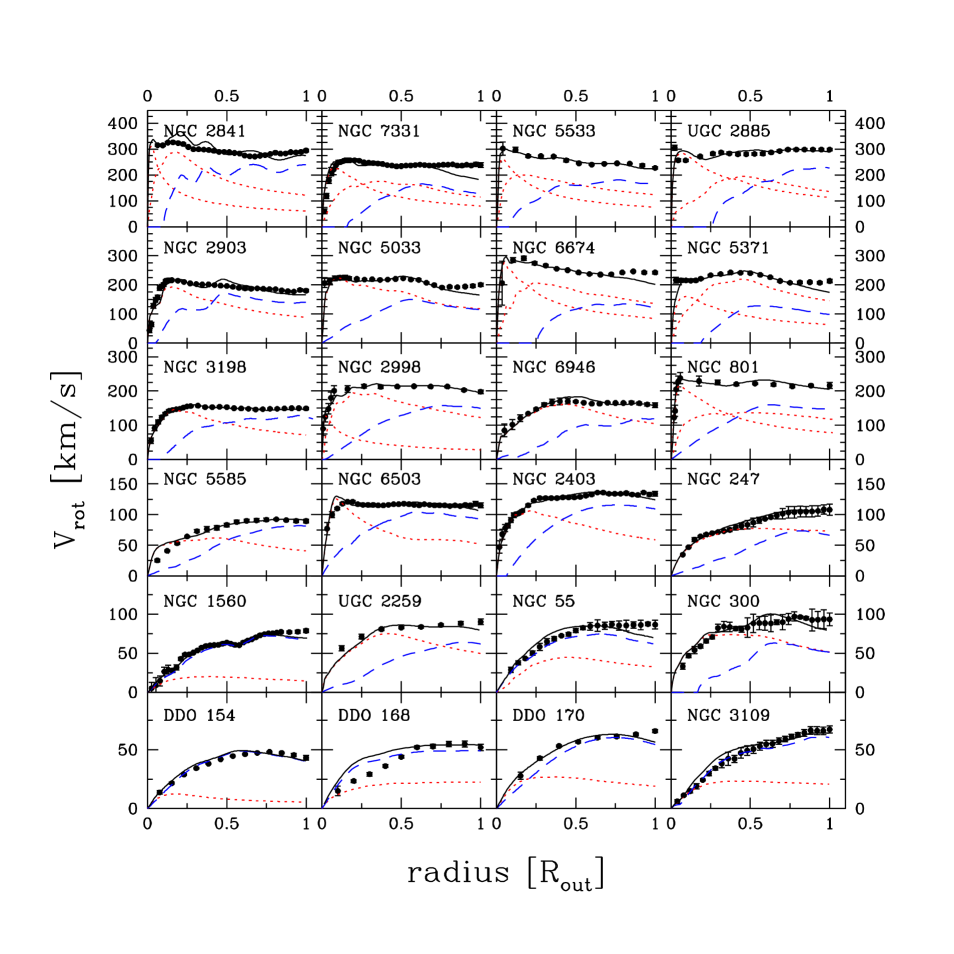
The models are compared to the observed rotation curves in Figure 4. The radius is expressed in units of , the radius of the last measured point of the rotation curve. The circular velocities for the stellar component(s) (dotted) and the scaled HI component (dashed) are also plotted.
We see that most of the 24 rotation curves can be fitted rather well over their full extent by scaling up the HI surface density. The poorer fits can be categorized as follows:
-
(1)
The model curve does not agree with the observed rotation curve in the inner region. This can be due to an incorrect bulge contribution.
For dwarf galaxies the inner parts of the rotation curves may be affected by beam smearing, as in the case of NGC 5585 (compare with the optical rotation curve by Blais-Ouellette et al. 1999). In the case of DDO 168 the published rotation curve may be too low in the inner parts and the model rotation curve is in fact consistent with the observations. The fits for the other dwarf galaxies in Table 2 are quite acceptable.
-
(2)
The model rotation curve shows large wiggles that are not present in the observed rotation curve. This effect is seen for NGC 2841, NGC 2903 and NGC 300. In estimating the contribution of the gas to the rotation velocity, we have used a radial profile that is an azimuthal average of the HI distribution. Features such as spiral arms or blobs of HI, however, may cause bumps in the radial profile. In the model rotation curve strong features will then show up, because the scaling of HI amplifies the irregularities in the HI distribution. Indeed the HI map of NGC 2903 shows clear spiral structure and blobs related to the wiggles. For NGC 2841 and NGC 300 the situation is less clear. The presence of wiggles in the rotation curves shows that the distribution of dark matter can not be an exact copy of the distribution of HI. At best, the smeared-out distribution of HI is a tracer of dark matter.
-
(3)
The model rotation curve drops below the observed rotation curve at large radii. Seven galaxies fall in this category (NGC 7331, 5033, 6674, 5371, 1560, 55, and also NGC 300). In Section 3 we noted that for large galaxies HI flux may be missed in the 21-cm synthesis observations. Obviously this could be a contributing factor to a decline of the HI rotation curve in the outer parts. In the same vein, hydrogen may be partly ionised in the outer regions due to photons of intergalactic origin. This possibility has been discussed for NGC 3198 by Maloney (1993). Irrespective of the presence of molecular gas, the observed HI surface density may therefore not always trace the total gas density in the outer parts.
We conclude from the comparisons in Fig. 4 and the results above that the rotation curves of two-thirds of the galaxies in our sample, spirals and dwarfs alike, can be fitted with a mass model based on the distribution of light and the distribution of HI, provided that the scale factors and can be chosen freely. The values we find for the mass-to-light ratios of the stellar component(s) agree well with the values given in Broeils (1992a) and Begeman (1987). From Fig. 4 one sees that many fits are nearly maximum disc fits (van Albada & Sancisi, 1986). This is indeed a remarkable property of this type of modeling: scaling of HI to represent the dark component only works in combination with maximal discs. We have verified this by gradually lowering the disc mass. Decreasing the disc mass by more than below its maximum value results in a substantially smaller core radius of the dark component, and such a dark component can then no longer be represented by a scaled-up HI distribution.
In Fig. 6 the frequency distribution of the scaling factor is shown. It is strongly peaked around a value of approximately 9. Correcting for primordial helium we find that the dark matter surface density is approximately 6.5 times the gas surface density (i.e. HI + He). As can be seen from Table 2, the HI scaling factor does not change much with galaxy type, although the scatter increases towards earlier types.
Two galaxies, NGC 2841 (23) and NGC 2903 (37), have . These galaxies are the two most compact ones in the sense that they have small scale lengths in comparison to their maximum rotation velocities; they therefore require a relatively massive dark halo. Their HI surface densities do not differ much from those of other galaxies and this results in an HI scale factor that is above average.

5 Discussion
As shown above, in general the distribution of HI mimics the distribution of dark matter remarkably well, provided the contribution of the disc to the rotation curve is close to maximal. We now examine more closely which property, or properties, of the HI layer in galaxies play a role in this.
5.1 Bias against small HI scale length
The rotation curves of the galaxies in our sample extend to well beyond the radius of 2.2 scale lengths where the rotation curve of the luminous component reaches its maximum. For a good match, we therefore require a rotation curve for the HI component rising to well beyond , in order to compensate for the decline of the rotation curve of the stars. Put differently, the radial ‘scale length’ of the HI distribution must be large, about 0.4 times the outer radius of the HI disc, , or even larger. For the galaxies in our sample we find an average , only barely enough for HI scaling to work. Figure 1 shows that for most galaxies the HI surface density profiles curve downwards with increasing radius. This is why for several galaxies scaling of HI gives a poor fit in the outer parts, with the model curve falling below the observed rotation curve (see e.g., NGC 7331 and 5371). Apparently, with the present 21-cm line sensitivity we may be reaching the border of the region where scaling of atomic hydrogen to fit the rotation curve works. Extension of the rapidly declining HI surface density profiles to larger radii would result in progressively poorer fits.
It is worth noting that our selection in favour of a large radial extent in HI excludes galaxies with small HI scale lengths, for the following reason. The HI surface density in the inner region of spiral galaxies, leaving aside a possible central depression, varies only by a modest amount from galaxy to galaxy (Broeils 1992a, Rhee 1996 and Fig. 2). In the mean for our sample . The smallest HI surface densities measured in the outer regions are set by the sensitivity of the observations. For our sample typically: . The corresponding range in is therefore about a factor of 20 for most galaxies in our sample, corresponding to three scale lengths for an exponential distribution. As a result our sample is biased against galaxies with substantially larger than 3. Obviously, for such galaxies scaling of HI to fit the rotation curve does not work.
5.2 The HI scale factor
Above we have shown that the success of our model fits is related to rather specific properties of the HI distributions for the galaxies in our sample. Could a selection effect also be responsible for the small range in the scale factor seen in Figure 6? Below we shall argue that this is unlikely.
Let us assume that the mass distribution in a galaxy can be represented by two exponential discs: one for the stars and one for the dark matter. The maximum rotation velocity of an exponential disc is proportional to the product of the scale length and the central surface density. One observes a more or less flat rotation curve when the maximum velocities of both discs are similar, i.e. when
| (4) |
where and are the central surface densities of respectively the stellar disc and the dark halo, and where and indicate their scalelengths. This equation is a description of the disc-halo conspiracy (van Albada & Sancisi, 1986).
If we assume that the surface density profile of the dark matter is a scaled version of the HI surface density, we can write for the scale factor :
| (5) |
where is a measure of the maximum HI surface density, ignoring a possible central depression. The small spread in the scale factor therefore implies a coupling of the scale lengths of stars and dark matter, as well as a coupling of the surface mass densities of stars and HI.
As mentioned above, the maximum surface density of the HI disc of high surface brightness galaxies does not vary much from galaxy to galaxy. Similarly, for luminous spiral galaxies the central surface brightness of the disc is remarkably constant (Freeman, 1970). Assuming some constant value for the mass-to-light ratio, this would result in a fairly small variation in the central surface density of the stellar disc. Thus, the spread in the first factor in Equation (5) may well be small. This suggests that if the ratio of scale lengths of the dark disc and the stellar disc were approximately constant, then the scale factor would be more or less constant. We note that, when calculating total surface densities from observed rotation curves, we indeed found a more or less exponential surface density profile in the outer parts. The scale length of this profile was in many cases about 4 to 5 times the optical scale length. Thus for the HSB galaxies in our sample, there appears to be a coupling between the linear scales of the disc and the dark halo. Similar results were found by Sackett (1997). Consequently, the expected spread in is small for HSB galaxies.
Our sample also includes several dwarf galaxies, with central surface brightnesses lower than those of the more luminous galaxies. Their HI surface densities are comparable to the larger galaxies however. Although we do not know how the stellar values of dwarfs and more luminous galaxies differ, it seems unlikely that equation (5) would apply. The similarity of the scale factor for dwarfs to that of the more luminous galaxies therefore seems a significant result that can not easily be explained in terms of a selection effect in our sample.
Swaters (1999) has applied HI scaling to a sample of 35 late-type dwarf galaxies. With one or two exceptions he finds excellent fits. Here too discrepancies, if any, occur mainly in the outermost regions. The required scaling factors for HI show a considerable spread, with a peak between 3 and 6. In the mean they are about a factor of two smaller than the scaling factors found above.
6 Summary & Conclusions
We have fitted mass models to the observed rotation curves of 24 galaxies under the assumption that the dark matter surface density is proportional to the HI surface density. For about two thirds of the galaxies we obtain good fits to the data. After correction for primordial Helium the required scaling factor is about 7. The main discrepancies occur at large radii, with the fitted rotation curves falling below the observed ones. This results from a fairly rapid decline of the HI surface density in the outermost regions.
For the HI data used here, the radial density profiles of HI typically extend to about 3 scale lengths, i.e. close to or just beyond the radius where the rotation curve of the HI component is expected to decline. The good fits are therefore somewhat coincidental. More sensitive HI observations would reach the declining part of the rotation curve of the HI component for several galaxies in our sample (provided the HI surface density remains exponential further out). If the observed circular velocity of the galaxy remains constant with radius it would then no longer be possible to fit such a flat rotation curve with a scaled up distribution of HI. Furthermore, in several galaxies scaling up of HI leads to rotation curves with wiggles, and in some galaxies not included in this paper the neutral hydrogen density drops rather abruptly around the optical radius.
Therefore, in many cases, there seems to be little or no relation between HI and dark matter. Note, however, that for a number of reasons (ionisation by the intergalactic radiation field, presence of molecular gas and missing HI flux) the observed HI densities may be lower than the actual gas densities. Because of these complications and the selection effects sketched above, it is not possible to conclude here that there is a real coupling between HI and dark matter in spiral galaxies.
Acknowledgments
We thank Kor Begeman, Adrick Broeils and Floris Sicking for kindly providing their data.
References
- 1 Begeman, K.G. 1987, Ph.D. thesis, University of Groningen
- 2 Begeman, K.G. 1989, A&A, 223, 47
- 3 Blais-Ouellette, S., Carignan, C., Amram, P., & Côté, S. 1999, AJ, 118, 2123
- 4 Bosma, A. 1978, Ph.D. thesis, University of Groningen
- 5 Bosma, A. 1981, AJ, 86, 1825
- 6 Broeils, A.H. 1992a, Ph.D. thesis, University of Groningen
- 7 Broeils, A.H. 1992b, A&A, 256, 19
- 8 Broeils, A.H., & Knapen, J.H. 1991, A&AS, 91, 469
- 9 Carignan, C. 1985a, ApJ, 299, 59
- 10 Carignan, C. 1985b, ApJS, 58, 107
- 11 Carignan, C., & Beaulieu, S. 1989, ApJ, 347, 760
- 12 Carignan, C., Charbonneau, P., Boulanger, F., & Viallefond, F. 1990, A&A 234, 43
- 13 Carignan, C., & Freeman, K.C. 1988, ApJ, 332, L33
- 14 Carignan, C., & Puche, D. 1990, AJ, 100, 641
- 15 Carignan, C., Sancisi, R., & van Albada, T.S. 1988, AJ, 95, 37
- 16 Côté, S., Carignan, C., & Sancisi, R. 1991, AJ, 102, 904
- 17 Cuddeford, P. 1993, MNRAS, 262, 1076
- 18 Freeman, K.C. 1970, ApJ, 160, 811
- 19 Jobin, M., & Carignan, C. 1990, AJ, 100, 648
- 20 Kamphuis, J.J. 1993, Ph.D. thesis, University of Groningen
- 21 Kent, S.M. 1984, ApJS, 56, 105
- 22 Kent, S.M. 1986, AJ, 91, 1301
- 23 Kent, S.M. 1987, AJ, 93, 816
- 24 Lake, G., Schommer, R.A., & van Gorkom, J.H. 1990, AJ, 99, 547
- 25 Maloney, P. 1993, ApJ, 414, 41
- 26 Pfenniger, D., Combes, F., & Martinet, L. 1994a, A&A, 285, 79
- 27 Pfenniger, D., Combes, F., & Martinet, L. 1994b, A&A, 295, 94
- 28 Puche, D., Carignan, C., & Bosma, A. 1990, AJ, 100, 1468
- 29 Puche, D., Carignan, C., & Wainscoat, R.J. 1991, AJ, 101, 447
- 30 Roberts, M. S., & Whitehurst, R. N. 1975, ApJ, 201, 327
- 31 Rhee, M.-Y., 1996, Ph.D. thesis, University of Groningen
- 32 Roelfsema, P.R., & Allen, R.J. 1985, A&A, 146, 213
- 33 Rots, A.H. 1980, A&AS, 41, 189
- 34 Rubin, V.C., Thonnard, N., & Ford, W.K., Jr. 1978, ApJ, 225, L107
- 35 Sackett, P.D. 1997, PASA, 14, 11
- 36 Shostak, G. S. 1973, A&A, 24, 411
- 37 Sicking, F.J. 1997, Ph.D. thesis, University of Groningen
- 38 Swaters, R. 1999, Ph.D. thesis, University of Groningen
- 39 van Albada, T.S., & Sancisi, R. 1986, Phil. Trans. Roy. Soc., London, A320, 447
- 40 van der Kruit, P.C., & Searle, L. 1981a, A&A, 95, 105
- 41 van der Kruit, P.C., & Searle, L. 1981b, A&A, 95, 116
- 42 Wevers, B.H.M.R. 1984, Ph.D. thesis, University of Groningen