Mining the local Universe: the QSO space density \toctitleMining the local Universe: the QSO space density 11institutetext: ST European Coordinating Facility, European Southern Observatory, Karl-Schwarzschild-Strasse 2, D-85748 Garching bei München, Germany 22institutetext: Dipartimento di Astronomia, Vicolo dell’Osservatorio 5, I-35122 Padova, Italy 33institutetext: Vatican Observatory Research Group, University of Arizona, Tucson AZ 85721, US
*
Abstract
We present progress results of a new survey for bright QSOs (, , ) covering the whole sky at high galactic latitudes, . The surface density of QSOs brighter than turns out to be . The optical Luminosity Function at shows significant departures from the standard pure luminosity evolution, providing new insights in the modelling of the QSO phenomenon.
1 Introduction
Why a survey for local QSOs?
Because in the epoch of 2dF and SDSS, of the thousands of QSOs at , it is important to have precise information about the spatial
density and the clustering of nearby AGN to provide
zero-point and leverage for the study of the QSO evolution.
As in other fields, it is paradoxical that
we know much better the properties of the high-z QSO population than
the local one.
The technical problem is however not trivial since, as
the PG survey (Schmidt & Green 1983) made clear, it is necessary to
cover the whole sky to obtain sufficient statistics
where the present data are unsatisfactory:
at and magnitudes around .
Such a task has become relatively simpler in recent times, thanks to
the availability of large high-quality databases.
2 The Photometric Database
What do we need ?
First of all, since our goal is the study of the optical luminosity
function (OLF) of QSOs, we need a homogeneous database of optical
fluxes covering the whole sky.
Of various existing possibilities:
APM111http://www.ast.cam.ac.uk/apmcat/,
ROE/NRL222http://xweb.nrl.navy.mil/www_rsearch/RS_form.html,
USNO1333http://archive.eso.org/skycat/usno.html,
GSC1444http://www-gsss.stsci.edu/gsc/gsc.html,
DSS555http://www-gsss.stsci.edu/dss/dss.html,
none turned out to be entirely satisfactory.
After a careful analysis of their sensitivity,
completeness, accuracy, we have chosen a combination of the catalogs GSC,
USNO and DSS:
-
1.
in the Northern hemisphere objects from the GSC catalog with . The relation between the band and the corresponding Johnson turned out to be: , with .
-
2.
in the Northern hemisphere objects from the USNO catalog with . The relation between the band and the corresponding Johnson-Kron-Cousins turned out to be , with .
-
3.
in the Southern hemisphere we have derived magnitudes from the Digitized Sky Survey (DSS). Small scans (“postage stamps” of ) of each object of interest and of 20-50 surrounding objects with known GSC magnitudes were extracted from the DSS. The magnitude of the object of interest was then calibrated against the GSC objects. In this way a of was obtained in the interval .

3 The QSO Selection
The second step is to select among the millions of objects in the magnitude range of interest the few hundreds of QSOs. We have used the RASS Bright Source Catalogue (RASS-BSC, Voges et al. 1999) to compute the X-optical color, (La Franca et al., 1995), which provides a key signature of the AGN phenomenon. If we take from the Véron & Véron catalog (1998) all the non X-ray selected bright QSOs with , assign to them the optical magnitudes of our databases and plot them vs. the corresponding RASS fluxes, we obtain the diagram of Fig. 1. We can see that, if we select objects with (the circles in Fig. 1), the incompleteness does not depend on the optical flux: we lose a fraction of about of the QSOs, which can be accounted for, and we obtain a reasonably short list of candidates: 520 in the North over 8000 sq.deg. and 301 in the South over 5600 sq.deg.
Conveniently, more than of the objects have already an identification in SIMBAD666http://simbad.u-strasbg.fr/Simbad or NED777The NASA/IPAC Extragalactic Database (NED) is operated by the Jet Propulsion Laboratory, California Institute of Technology, under contract with NASA. For the remaining ones we are taking spectra with the telescopes at the Asiago, La Silla and Kitt Peak observatories. The success rate is around . We have observed of the candidates in the North, in the South, collecting a total of 290 QSOs. At completion we expect to produce a sample of about 450 QSOs.
4 Results of the Asiago-ESO/RASS QSO Survey
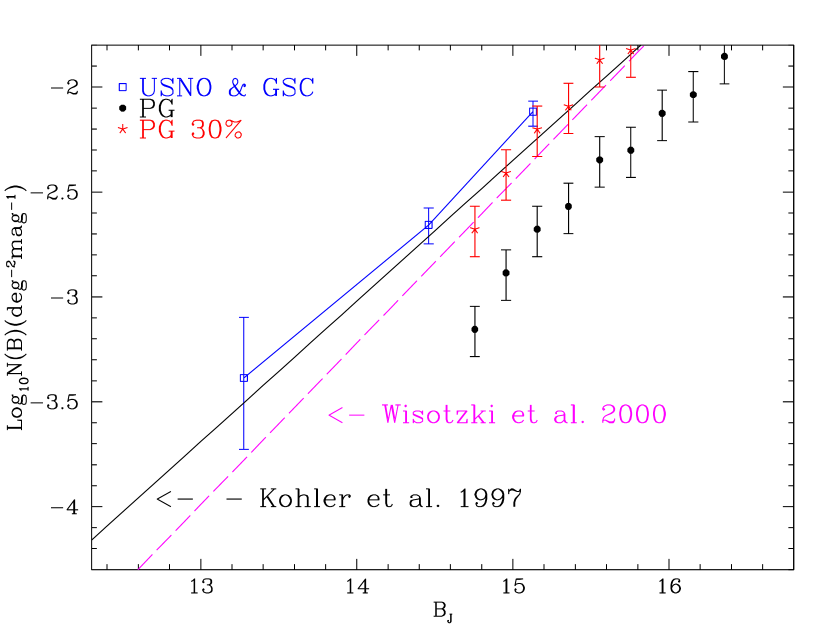
Preliminary results have been reported in Grazian et al. (2000). The optical counts have been computed in the band, correcting our V and R magnitudes according to the average colors of the sample, and are shown in Fig. 2. They confirm the well known (Goldschmidt et al., 1992) incompleteness of the PG survey (about a factor 3) and agree with the extrapolation of other recent surveys carried out at somewhat fainter magnitudes.
The derived OLF confirms and strengthens the claim of La Franca & Cristiani (1997, LC97), i.e. a significant departure of the evolution at low-z from the pattern generally described with a Pure Luminosity Evolution (PLE).

It is debatable whether the best parameterization of the data is provided by a Luminosity Dependent Luminosity Evolution (e.g. LC97) or by a slow-down of the evolutionary rate and/or a mild density evolution at low-z (e.g. Cavaliere & Vittorini, 2000). To obtain a more physical insight it is however advisable to put these results in the context of the models of formation and evolution of galactic structures, for evidence is mounting that the QSO activity, the growth of super-massive black holes (BH) and the formation of spheroids are closely linked phenomena.
On the one hand, the increased (with respect to previous measurements) QSO space density at low-z corresponds better to the predictions of semi-analytical models (Kauffmann & Haehnelt 2000). In this scenario the recurrent activity of short-lived QSOs is driven by the merging rate of CDM halos, the availability of cold gas and the timescale of the accretion onto the central BH. On the other hand, a weak density evolution and a smoother overall shape of the OLF at low-z are natural predictions of the model of Cavaliere & Vittorini (2000). According to them, the accretion onto an active BH is controlled by the surrounding structures: efficient fueling is triggered by the encounters of a gas-rich galaxy with companions in a group; these destabilize the gas and induce accretion. Strong luminosity evolution is produced as star formation and these encounters deplete the gas supply in the host; an additional, milder density evolution derives, since the interactions become progressively rarer as the groups grow richer but less dense.
A refined measurement of the QSO clustering and its evolution, now possible over nine tenths of the history of the Universe, will be instrumental in disentangling the various hypotheses.
References
- [1] Cavaliere, A., Vittorini, V. (2000), astro-ph/0006194
- [2] Goldschmidt, P., Miller, L., La Franca, F., Cristiani, S. (1992), MNRAS 256, 65
- [3] Grazian, A., Cristiani, S., D’Odorico, V., Omizzolo, A., Pizzella, A. (2000), AJ 119, 2540
- [4] Kauffmann, G., Haehnelt, M. (2000), MNRAS 311 576
- [5] Köhler, T., Groote, D., Reimers, D., Wisotzki, L. (1997), AAP 325, 502
- [6] La Franca, F., Cristiani, S. (1997), AJ 113, 1517
- [7] La Franca, F., Franceschini, A., Cristiani, S., Vio, R. (1995), A&A 299, 19
- [8] Schmidt, M., Green, R. F. (1983), APJ 269, 352
- [9] Véron, M.P., Véron, P. (1998), A Catalogue of QSOs and Active Nuclei, ESO Scientific Report No. 18.
- [10] Voges, W., Aschenbach, B., Boller, T., Brauninger, H., Briel, U., et al. (1999), A&A 349, 389
- [11] Wisotzki, L., Christlieb, N., Bade, N., Beckmann, V., Köhler, T., et al. (2000), A&A 358, 77