The Giant Flare of 1998 August 27 from SGR 190014: I. An Interpretive Study of BeppoSAX and Ulysses Observations
Abstract
The giant flare of 1998 August 27 from SGR 1900+14 was extraordinary in many ways: it was the most intense flux of gamma rays ever detected from a source outside our solar system; it was longer than any previously detected burst from a soft gamma repeater (SGR) in our Galaxy by more than an order of magnitude; and it showed a remarkable four-peaked, periodic pattern in hard X-rays with the same rotation period that was found modulating soft X-rays from the star in quiescence. The event was detected by several gamma-ray experiments in space, including the Ulysses gamma-ray burst detector and the BeppoSAX Gamma Ray Burst Monitor. These instruments operate in different energy ranges, and comparisons of their measurements reveal complex patterns of spectral evolution as the intensity varies. In this paper, we present a joint analysis of the BeppoSAX and Ulysses data and discuss some implications of these results for the SGRs. We also present newly-analyzed Venera/SIGNE and ISEE-3 data on the 1979 March 5 giant flare from an SGR in the Large Magellanic Cloud (SGR 0526-66), and compare them with the August 27 event. Our results are consistent with the hypothesis that giant flares are due to catastrophic magnetic instabilities in highly magnetized neutron stars, or “magnetars”. In particular, observations indicate that the initial hard spike involved a relativistic outflow of pairs and hard gamma rays, plausibly triggered by a large propagating fracture in the crust of a neutron star with a field exceeding 1014 Gauss. Later stages in the light curve are accurately fit by a model for emission from the envelope of a magnetically-confined pair-photon fireball, anchored to the surface of the rotating star, which contracts as it emits X-rays and then evaporates completely in a finite time. The complex four-peaked shape of the light curve likely provides the most direct evidence known for a multipolar geometry in the magnetic field of a neutron star.
Subject Headings: gamma rays: bursts – stars: neutron – X-rays: stars
1 Introduction
During recent years, soft X-ray observations of the quiescent counterparts to SGR 1806-20 and SGR 1900+14 have revealed periodicities in the 5–8 s range and spindown rates of – s s-1 (Kouveliotou et al. 1998a, Hurley et al. 1999c). These rotation periods are similar to that of SGR 0526-66, which displayed an 8 s periodicity during the giant flare of 1979 March 5 (Mazets et al. 1979b, Barat et al. 1979). Precise localizations of SGRs indicate that they may be associated with supernova remnants (SNRs) of ages years. SGR 1806–20 was localized by detecting its bursts in X–rays (Murakami et al. 1994) to a position consistent with a radio synchrotron nebula that may be a plerionic SNR (Kulkarni & Frail 1993); however a recent more accurate localization of the bursting source provides evidence that the SGR is displaced from the radio nebula core (Hurley et al. 1999d). SGR 1627-41, discovered in 1998 (Kouveliotou et al. 1998c ; Feroci et al. (1998)), is also positionally coincident with a young SNR (Hurley et al. 1999e, Woods et al. 1999a, Smith, Bradt & Levine 1999). However, deep X–ray observations of SGR 1627-41 (Hurley et al. 2000) have so far failed to verify any X–ray periodicity in the quiescent source.
The association of SGRs with young SNRs suggests that they are young neutron stars. The long rotation periods and rapid spindown rates, in the absence of any evidence for binary companions, can be accounted for if the spindown is driven by an ultra-strong magnetic field, e.g., Gauss, as invoked in the magnetar model (Duncan & Thompson 1992, “DT92”; Paczyński 1992; Thompson & Duncan 1995, “TD95”). Magnetars, or “magnetically-powered neutron stars,” could form via an - dynamo action in hot, nascent neutron stars if they are born spinning rapidly enough (DT92; Thompson & Duncan 1993, “TD93”). Magnetism may be strong enough within these stars to evolve diffusively over SGR lifetimes of years, driving internal heat dissipation that would keep the neutron stars hot and X-ray bright (Thompson & Duncan 1996; Heyl & Kulkarni 1998). Above a flux density of G, the evolving field inevitably induces stresses in the solid crust that cause it to yield or fracture (TD95). Such magnetically-driven starquakes may account for the “ordinary” SGR bursts, which have many statistical properties in common with earthquakes (Cheng et al. 1996; Palmer 1999; Gogus et al. 1999; Gogus et al. 2000). Less common and more catastrophic magnetic instabilities, perhaps involving large propagating fractures, are thought to produce giant flares (TD95). The non-thermal persistent emission of the SGRs has also been proposed to be a consequence of magnetic activity: either through persistent fracturing of the crust driven by the Hall electric field (Thompson & Duncan 1996) or through persistent magnetospheric currents that are excited by twisting motions of the crust during outbursts (Thompson et al. 1999).
We note that the observed spindown histories of SGRs are not well-fit by the idealization of vacuum magnetic dipole radiation [MDR] (Kouveliotou et al. 1998a, 1999; Marsden et al. 1999; Woods et al. 1999b, 2000). Indeed, spindown torques in active magnetars can be enhanced by persistent outflows of relativistic particles and Alfvén waves, channeled by a strong magnetic field (Thompson & Blaes 1998; Harding, Contopoulos & Kazanas 1999; Thompson et al. 1999) and also strongly modulated by material ejected during bursting activity (Woods et al. 2000). It remains possible that the smooth spindown in some inactive candidate magnetars (such as 1E 1841-045) is well fit by MDR (Vasisht & Gotthelf 1997; Gotthelf, Vasisht & Dotani 1999). The observed spindown in SGRs is consistent with dipole fields weaker than the QED strength ( G), but only if a persistent outflow of particles carries away substantially more energy than is observed in X-rays (Harding, Contopoulos & Kazanas 1999; Marsden et al. 1999).
Accretion-powered alternatives to the magnetar model have also been considered (e.g., Van Paradijs, Taam & Van den Heuvel 1995; Li 1999; Chatterjee, Hernquist & Narayan 2000; Alpar 2000). Such models make reasonable fits to the continuous X-ray emissions and spindown histories of SGRs and Anomalous X-ray Pulsars (AXPs), but they offer no good explanation for the hyper-Eddington burst and flare emissions that are the defining property of SGRs (cf. §7.3 in TD95; §5.2 in Thompson et al. 1999).
This paper will focus on SGR 1900+14. Of the four known SGRs, this object is the only one without an identified SNR surrounding it. However, the recently-verified source position (Vasisht et al. 1994; Hurley et al. 1999a; Murakami et al. 1999; Frail, Kulkarni & Bloom 1999) lies just outside the edge of G42.8+0.6, a -year-old galactic SNR. A parallel can be drawn with the other giant flare source, SGR 0526-66, which lies near the edge of, but just inside, the young SNR N49 in the LMC (Cline et al. 1982). Note that several mechanisms could plausibly impart a recoil velocity km s-1 to a magnetar at birth, sufficient to propel it outside its remnant in years (DT92).
SGR 1900+14 was first detected in 1979, when it emitted three bursts of soft gamma-rays of moderate intensity (Mazets et al. 1979a). The source again became burst active for a short while in 1992 when a handful of events were recorded (Kouveliotou 1993). In 1998 May, SGR 1900+14 entered an unprecedented level of burst activity in both frequency and intensity (Kouveliotou et al. 1998b, Hurley et al. 1999a). Purely by chance, an ASCA (2–10 keV) observation less than one month prior to the source reactivation in 1998 led to the discovery of 5.16 pulsations from the quiescent counterpart to the SGR (Hurley et al. 1999c). Subsequent RXTE PCA (2–20 keV) observations following the reactivation of the SGR allowed for a measurement of the period derivative (Kouveliotou et al. 1999; Woods et al. 1999b). This spindown rate is consistent with a magnetar-strength field (Kouvelioutou et al. 1999; Thompson et al. 1999 and references therein).
On 1998 August 27 a giant flare from SGR1900+14, lasting more than five minutes, was detected by Konus-Wind, Ulysses and BeppoSAX (Cline et al. 1998; Hurley et al. 1999b; Feroci et al. 1999; Mazets et al. 1999). Gamma rays during the first second were extraordinarily intense, overwhelming detectors on several other spacecrafts as well, such as the Near Earth Astreroid Rendevous mission (which went into a protective shut-down mode) and the Proportional Counter Array on the Rossi X-ray Timing Explorer. The Compton Gamma-Ray Observatory was Earth-occulted for this flare.
The 5.16 s neutron star rotation period was clearly detected during the giant flare. Indeed, the periodic signal was intense enough to produce a marked 5.16-second modulation in the height of the Earth’s ionosphere, which affected long-wavelength radio transmissions (Inan et al. 1999), a remarkable effect for a star light years away. About 40 seconds after the onset of the flare,a 1.03 s repetitive pattern (4th harmonic of 5.16 s fundamental) was observed to set in gradually (Feroci et al. 1999; Mazets et al. 1999), unlike any emission previously detected from any source. A radio afterglow was soon found with the Very Large Array (Frail, Kulkarni & Bloom 1999). This source, the only radio point source unambiguously associated with an SGR, was apparent in the error box of SGR1900+14 on 1998 September 3, but it faded away in less than one week, giving evidence for an abrupt outflow of relativistic particles during the flare.
In this paper we carry out a comparative analysis of BeppoSAX and Ulysses observations of the August 27th event. Our main goal is a thorough description of the data that may be cogent to understanding SGR giant flares, including some novel comparisons with the 1979 March 5th event. The observed properties are then qualitatively interpreted in the context of the magnetar hypothesis, deriving insights and constraints on the magnetic field structure and mechanisms for large flares in SGRs. A companion paper (Thompson et al. 2000, hereafter Paper II) derives a more quantitative and rigorous treatment of the physics and magnetic field structure in this and similar objects.
2 Observations
2.1 Instrumentation
2.1.1 BeppoSAX Gamma Ray Burst Monitor
The GRBM consists of the anticoincidence detectors of the Phoswich Detection System (PDS, Frontera et al. 1997), comprised of four optically independent CsI(Na) shields forming a square box, surrounding the main PDS detectors. Each shield is 1 cm thick and has a geometric area of about 1136 cm2. The maximum effective area for a burst with a typical power law spectrum arriving at normal incidence is about 420 cm2 for unit 1 or 3 (the optimum units), when shadowing by spacecraft and experiment structures and the detector response are taken into account.
The GRBM electronics records data from each shield in both real-time (low time resolution) and triggered (high time resolution) modes. The real-time data consist of 1 s resolution count rates in the 40-700 and 100 keV energy ranges. The triggered data consist of: (a) 7.8125 ms data for 8 s prior to the trigger time, (b) 0.48828 ms data for 10 s starting at the trigger time, and (c) 7.8125 ms data for 88 s starting at 10 s after the trigger time. These count rates are all recorded in the 40-700 keV energy range.
Independent of the trigger, 256-channel energy spectra are taken every 128 s, for each of the four shields. These are integrated over fixed time intervals, and are therefore mainly useful for calibration purposes. In fact, given the typical time scales of cosmic GRBs, the housekeeping spectral data can only be used for obtaining the average energy spectra of bright GRBs, when they can be detected over 128 s of background.
The 1 s real-time data in the two energy channels, 40-700 keV and 700 keV, allow for some spectral reconstruction. The two count rates overlap in the nominal energy range from 100 to 700 keV. From these, the 40-100 keV and 100-700 keV rates may be derived, with assumptions about the number of counts above 700 keV111 We have no definite way of knowing what the counts are above 700 keV. However, in this specific case, we know from the time-averaged spectra what the spectrum is below 700 keV and can extrapolate above this energy. In addition, the GRBM effective area above 700 keV decreases continuously, starting at 25% of its maximum value at 700 keV (the maximum is reached at 200 keV) (Amati (1999)). This fact, combined with a photon spectrum decreasing with energy (in our case the spectrum is very hard only in the first seconds, when we don’t make any use of the realtime ratemeters), results in an estimated number of counts that is negligible with respect to the count rates in 40-100 and 100-700 keV. For this reason we simply preferred not to make any correction, which would be almost entirely arbitrary, and leave the results that we present subject to this assumption. (Amati et al. (1997)). Therefore, these ratemeters can be used to extract a 2-channel spectrum, with a time resolution of 1 s. Note that the events that are recorded in these two ratemeters are exactly the same in their overlapping energy range, and are therefore completely covariant, significantly lowering the statistical error in their difference.
The energy resolution of a shield ranges from 15% to 30%, depending on the energy and position of interaction of the photon. Additional details on the GRBM instrument and its in-flight performance can be found in Feroci et al. (1997).
2.1.2 Ulysses Gamma Burst Detector
The Ulysses GRB detector (Hurley et al. 1992) consists of two 3 mm thick hemispherical CsI(Na) scintillators with a projected area of about 20 cm2 in any direction. The detector is mounted on a magnetometer boom far from the body of the spacecraft, and therefore has a practically unobstructed view of the full sky. Because the Ulysses mission is in interplanetary space, the instrument benefits from an exceptionally stable background. The energy range is 25-150 keV. The lower energy threshold is set by a discriminator, and is in practice an approximate one; photons with energies keV can penetrate the housing and be counted either because of the rather poor energy resolution at low energies, or, in the case of very intense events, due to pulse pile-up. For the 1998 August 27 event, an intense flux of low energy photons was present, and both of these effects operated to some extent. The upper energy threshold is set by a discriminator, and also by the decreasing detector efficiency. The instrument took time history data of the August 27 event in both triggered and real-time modes. The triggered data had time resolution 0.03125 s, but it lasted for only 64 s; the real-time data had resolution 0.5 s, and was transmitted thoughtout the event. The first 7.3 s of the triggered data recorded the burst prehistory. The instrument also generally records 16 channel energy spectra for a total duration of 500 s after any trigger, with progressively longer time resolutions, starting at 1 s and ending at 16 s. The energy resolution is 27 % at 60 keV.
2.2 The August 27 event
The giant outburst from SGR 1900+14 triggered the BeppoSAX Gamma Ray Burst Monitor and the Ulysses Gamma Ray Burst detector on August 27 1998, 10:22:15.7 UT (Feroci et al. 1999, Hurley et al 1999b). At the time of this event, SGR 1900+14 was located at an elevation angle of 48∘ with respect to the GRBM equatorial plane, and at an azimuthal angle of 29∘ with respect to the GRBM unit 1, whose data will be used in the analysis presented in the following sections. The effective area of the GRBM unit 1 at this incidence angle varies from 56 cm2 at 60 keV to 365 cm2 at 280 keV. The GRBM unit 1 recorded 106 counts in the 40–700 keV range and 3105 above 100 keV. The peak count rate in 40–700 keV was estimated to be 1.5105 counts s-1 but it was probably affected by saturation problems (Feroci et al. 1999). The Ulysses GRB detector recorded 1.8106 counts in the energy range 25-150 keV, with a peak count rate of 2105 counts s-1, also possibly affected by pulse pile-up and dead-time effects.
A reliable estimate of the energetics of the event is made difficult by pile-up and dead-time problems. Mazets et al. (1999) made a signficant effort to derive tight lower bounds using the Konus experiment. For the energy range 15 keV, they found a lower bound on the peak flux of erg cm-2 s-1, and a fluence erg cm-2 in the hard spike (first 0.45 s). At a distance of kpc, and assuming isotropic emission, this corresponds to a peak luminosity greater than erg s-1 and a total hard spike energy erg. The fluence subsequent to the hard spike was erg cm-2 in keV photons (Mazets et al. 1999). A substantial fluence in lower-energy photons (Inan et al. 1999) and in neutrinos (§5 in TD95; Paper II) is also likely. Thus a lower bound on the total event energy is erg.
2.3 Available Data
The available real-time data from Ulysses and BeppoSAX Gamma Ray Burst detectors consist of count rates over 0.5 s in the 25–150 keV band (Ulysses), and count rates over 1 s in the 40–700, 40–100 and 100–700 keV bands (BeppoSAX). In both instruments these rates are accumulated onboard over fixed time intervals. Taking into account the location of SGR 1900+14 and the two spacecraft positions, we find that the onboard integration times of the two experiments are such that the first time bin containing photons from the giant flare starts for Ulysses at 37335.168 SOD (seconds of day August 27th, 1998) and for GRBM at 37335.05653 SOD. Therefore, purely by chance, the two low-resolution light curves are synchronized to within approximately 100 ms ( 0.02 cycles of the neutron star rotation), and they can be used for time-resolved spectral analysis. The light curves of the event in these energy ranges are shown in Fig. 1. The effective area of the GRBM for this event was only at 60 keV (Feroci et al. (1999)); because of this and the falling energy spectrum, the numbers of counts detected by GRBM and Ulysses are comparable.
High time-resolution data were recorded only during the first portion of the event. In particular, the BeppoSAX/GRBM provided 7.8125 ms data for the first 98 s of the event in the 40-700 keV range, while the Ulysses GRB detector recorded the first 57 s of the event with a time resolution of 31.25 ms in the nominal energy range 25-150 keV (with a likely contribution from photons of energies 10 keV.
3 Timing Analysis
3.1 Envelope of the Light Curve
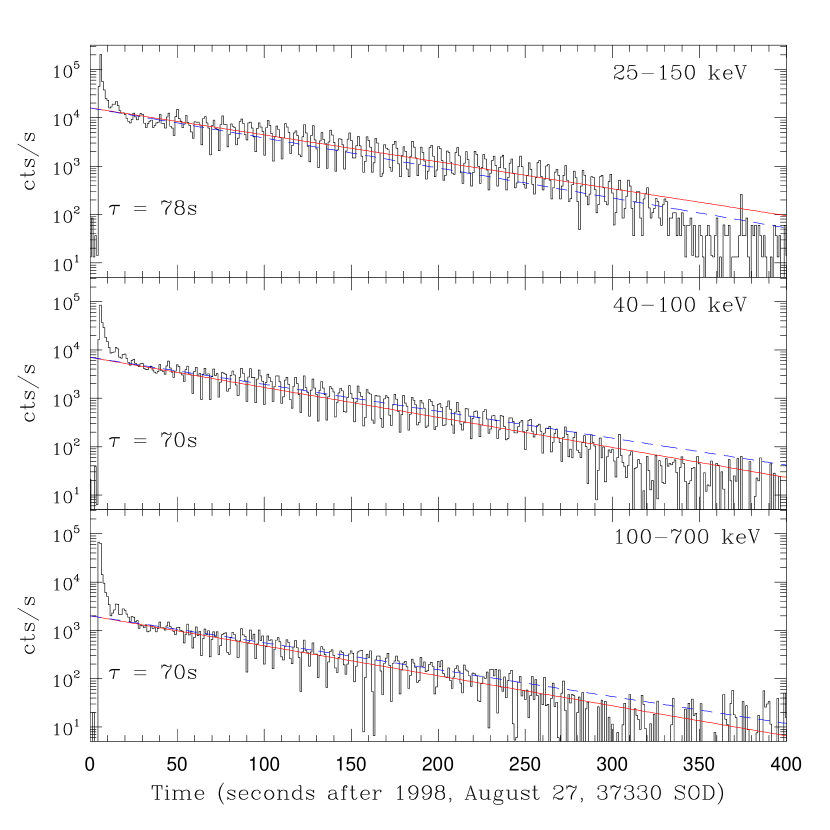
The envelope of the light curve decays smoothly, and provides an important clue to the radiative mechanism. The simplest choice of an exponential function adequately describes the intermediate portion of the decay (Fig. 1). The best fit time constant varies slightly from s in the Ulysses energy range to 70 s in both the 40–100 and 100–700 keV GRBM energy ranges. An even longer decay constant of 90 s was fit by Mazets et al. (1999) in the Konus energy range (15 keV), which is softer than Ulysses . This decrease in the decay constant with increasing photon energy suggests a slight overall softening in the spectrum on a timescale of s.
Note, however, that the data drops sharply below the exponential fit at 300 s after the event onset. This leads us to consider a second parameterization motivated by a cooling fireball which is trapped on the closed magnetic field lines of a neutron star (Paper II):
| (1) |
In this expression, the cooling luminosity is assumed to vary as a power of the remaining fireball energy, , and is the time at which the fireball boundary propagates to its center and the fireball evaporates. The fireball index accounts for the geometry and the temperature distribution of the trapped fireball, being for a spherical trapped fireball of uniform temperature. Giant outbursts such as the August 27 event correspond to fireball interior temperatures of MeV if essentially all the burst energy is released during the initial spike, and a sizeable fraction of this energy is trapped (TD95). In this situation, the scattering depth across the fireball is so large, , that the fastest mode of radiative loss involves the inward propagation of the cool boundary of the fireball. Neutrino pair cooling causes significant deviations from eq. (1) above MeV, as we discuss in Paper II.
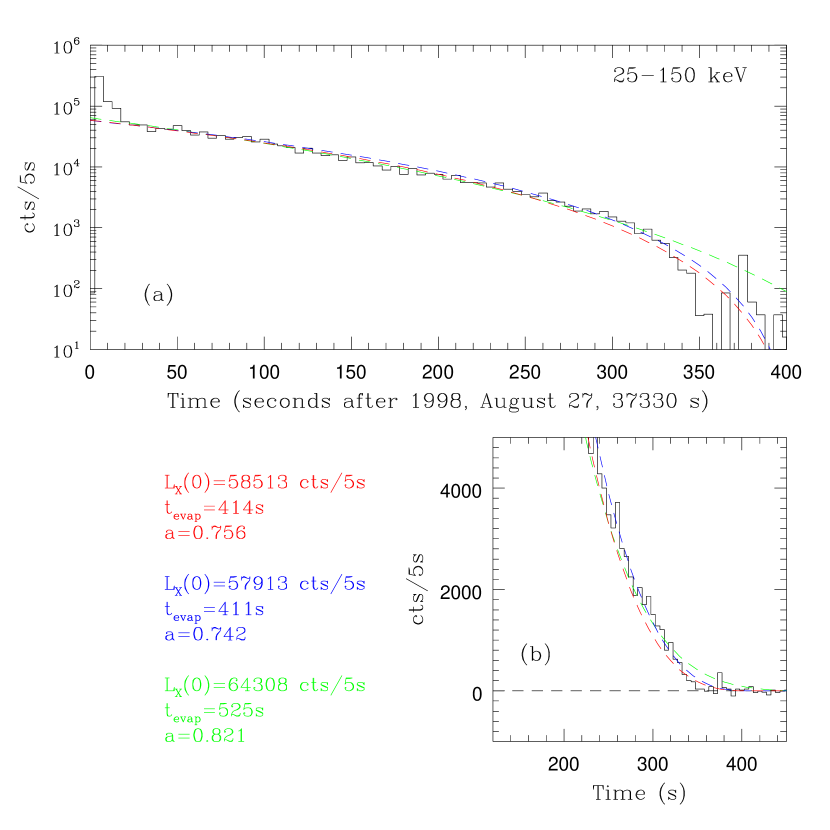
The function (1) is fit to the Ulysses data in Figs. 2 (rebinned at 5-s intervals, the closest available approximation to the 5.16-s period, in order to reduce the scatter caused by the oscillations) and 3a. In order to fit the 5-s Ulysses lightcurve we selected the time interval going from 50 to 450 s after the event onset, that is from when the large amplitude oscillations set in up to when the event is finished. A fit to the whole light curve with all the three parameters of the cooling fireball model free to vary brings to the following set of values: [=(64,308279) counts/5s, =(5255) s and ], with a =5132 (78 degrees of freedom). (All errors are given at 1- significance level). Since the physical meaning of in the cooling trapped fireball model is the time at which the fireball itself evaporates (corresponding to the time at which the light curve goes to the baseline), we evaluate =525 s unacceptable. Most likely, the reason for this result is that the best statistics (which drives the minimization) for the lightcurve is available in the first portion of the curve, whereas is mostly characterized by the tail of the curve itself. Therefore, we used the final portion of the curve, from t=250 s to t=450 s, where there is not a large variation in the statistical quality of the data, to derive a more reliable value for . In fact, fitting this final portion of the curve we derive: [=(57,9133644) counts/5s, =(4113) s and ], with =251 (38 d.o.f.). Then, we go back and consider again the curve starting at t 50 s, and fit the model to the data, allowing to vary only within the 1-sigma range provided by the fit to the t50 s curve. With this procedure we derive the following best-fit parameters: [=(58,513165) counts/5s, =414 s (at the limit) and ], with a =6086 (79 d.o.f.). The excellence of the fit is demostrated by the dashed, coloured curves in Fig. 2, showing how the trapped fireball model follows the decay trend of the curve, and in particular accurately matches the sudden final drop in flux (except for the green curve, where appears clearly overestimated). For indices not far from the value corresponding to a spherical fireball of uniform temperature (), it tracks the envelope of the light curve over the entire phase of large-amplitude pulsations (Fig. 2 and 3a). We note, however, that fixing during the fitting procedure provides a large increase in the value of (more than a factor of 4). In the following we will assume the last set of trapped-fireball parameters as best-fit parameters, however a word of caution is needed due to the large values obtained for the , indicating that the light curve has intrinsic variability, much larger than the statistical errors.
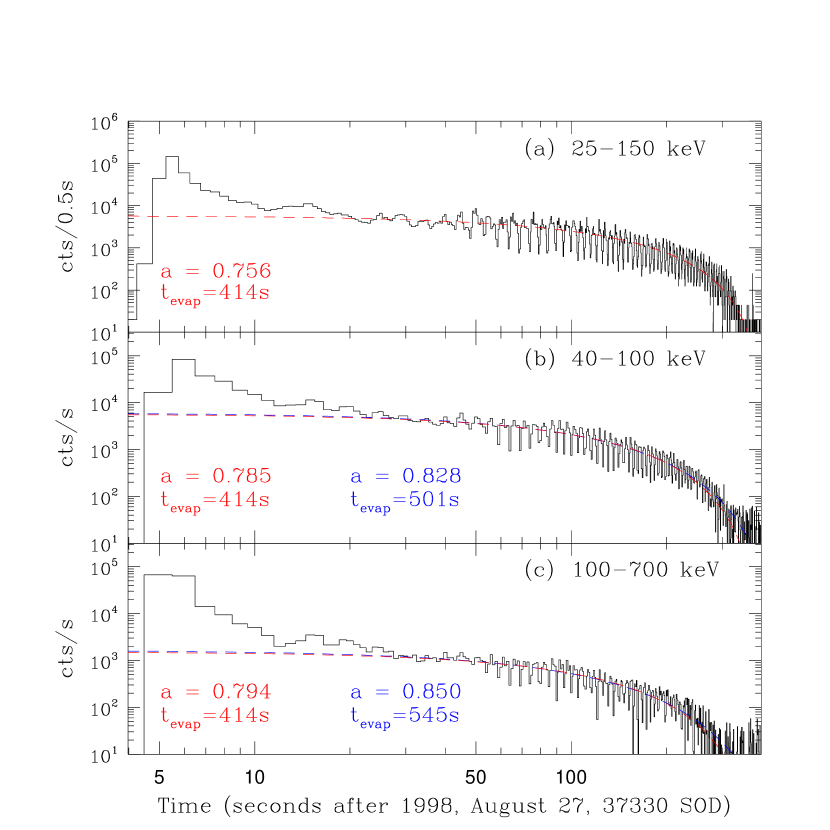
An indirect confirmation of the goodness of our choice is obtained when we compare the derived fireball model to the high energy (GRBM) data in the two energy intervals. In Fig. 3b-c we show the results of the fit to the 40-100 and 100-700 keV lightcurves (for 50 s t 450 s). The blue curves correspond to fits done with the three parameters of the trapped-fireball model free to vary. The resulting values are: [=(6,03652) counts/s, =(50113) s and ] for 40-100 keV (=867, 77 d.o.f.) and [=(1,64653) counts/s, =(54562) s and ] for 100-700 keV (=123, 77 d.o.f.). Instead, the red curves correspond to fits done fixing within the 1- range provided by the analysis of the 25-150 keV data and leaving and free to vary. The best-fit parameters for these fits are: [=(5,72031) counts/s, =414 s and ] for 40-100 keV (=938, 78 d.o.f.) and [=(1,54230) counts/s, =414 s and ] for 100-700 keV (=129, 78 d.o.f.). We see that the GRBM energy ranges require a fireball index larger than that obtained in 25-150 keV. This behavior is consistent with a mild softening of the spectrum during the phase of large-amplitude pulsations, already suggested by the exponential-decay fits, which causes the light curve to drop more rapidly at higher energies.
We note that all our favored fireball indices differ slightly, but significantly, from that expected in case of spherical geometry (). We will comment on the physical significance of the parameter values in Paper II. In addition, both exponential and trapped fireball fitting functions significantly underestimate the measured flux during the first stages of the August 27 outburst – the initial hard pulse and the ensuing smooth s decay. This excess flux disappears just as the large-amplitude pulsations begin to emerge.
In Figure 4 we present the first 100 s of the event, as derived from the high resolution GRBM lightcurve rebinned with 5.16 s resolution, i.e. one spin period. The decay appears to be quite smooth and monotonic, apart from a small feature around 37370 SOD, or s after burst onset, which is coincident with the first appearance of the subpulses (see Figs. 6 and 7). This indicates that the onset of the four-peaked structure in the light curve does not correspond to an additive contribution to the emission – with the possible exception of a short, modest, transient enhancement around 37370 SOD – but rather to a redistribution of the same emission over the spin phase. This is consistent with the idea that a rapid release of energy occurred at the event’s onset, and that the subsequent, generally declining X-ray emissions are due largely to the loss of this energy from the star and its vicinity.
3.2 Power Spectra
The real-time data can be used to characterize the energy and time dependence of the 5.16-s period pulse shape. In Fig. 5 we show the power spectral density (PSD) of the Ulysses and GRBM real-time data over four consecutive time intervals covering the entire event (from 3-50 s, 50-150 s, 150-250 s, 250-350 s after the event onset, except for 100-700 keV where we limited the last Fourier transform to the interval 250-300 s, due to the low statistics). In order to subtract the low frequency noise introduced by the slow decay, for each of the three energy ranges the best-fit trapped fireball model was subtracted from the data. In the interval 3-50 s the excess of the data with respect to the trapped fireball model motivated an additional detrending with a second-order polynomial form.
The many peaks apparent in the PSD are all but one related to the fundamental frequency (0.2 Hz) of the star’s rotation, being either high order harmonics (up to n=5 for Ulysses and n=2 for GRBM) or the aliases of the higher order harmonics, due to the coarse sampling of the data. In particular, we expect contributions in our spectra from the following aliases in the Ulysses data (n indicates the harmonics that are aliased at the given frequency - we only mention up to n=10): 0.837 Hz (n=6), 0.643 Hz (n=7), 0.449 Hz (n=8), 0.255 Hz (n=9), of which the first one is clearly detected and the other three are possibly detected, but marginally. For the GRBM data we expect aliases at frequencies: 0.418 Hz (n=3), 0.225 Hz (n=4), 0.449 Hz (n=8), 0.255 Hz (n=9), of which the first one is clearly detected.
The only peak that cannot be attributed to the source is visible at 0.08 Hz in the PSD of the Ulysses data. This is an instrumental effect, related to the spin period of the Ulysses spacecraft (5 rpm = 0.0833 Hz), which causes a periodic absorption of the source flux by the carbon fiber magnetometer boom. The PSD obtained from BeppoSAX data do not suffer similar problems, because the satellite is three-axis stabilized. Other spurious modulations are possible due to background geomagnetic variations and Earth occultation over the BeppoSAX orbit, but only at frequencies 0.2 mHz that are too low to be probed by this transient flare data.
The results of the Fourier transforms contain information about how the pulse shape varies with time and photon energy. The fundamental pulsation is only marginally detected during the first time interval in any of the three energy ranges. This indicates that the light-curve is not strongly modulated on the rotation period, as evident in the first s of the high time resolution data (see Fig. 7). The absence of large-amplitude modulations suggests that an optically thick plasma filled a larger volume of the magnetosphere; and the relative lack of phase coherence points to large fluctuations in the position of the scattering photosphere, well outside the volume containing most of the burst energy. As the event progresses, the rotational modulation becomes more pronounced, and the soft X-ray power in high-order harmonics varies significantly relative to the fundamental. It decreases near the end of the event, indicating that the pulse shape evolves toward a smoother profile. Interestingly, the 0.837 Hz peak (alias of n=6) in the 25-150 keV PSD increases its power with time, relative to the fundamental frequency. In the last time interval (starting 250 s after the event onset) the PSD of the Ulysses data shows that most of power at frequencies above the fundamental is contained in the 1 Hz peak. This peak is strong likely due to a four-peaked structure of the light curve which is quasi-repetitive on a 1-s period, as it is observed in the early phases of the same curve. In the same time interval, the fundamental pulsation has almost disappeared in the high energy range (100-700 keV), while it is still evident at medium and low energies.
4 Spectral Analysis
4.1 Phase-resolved Spectroscopy
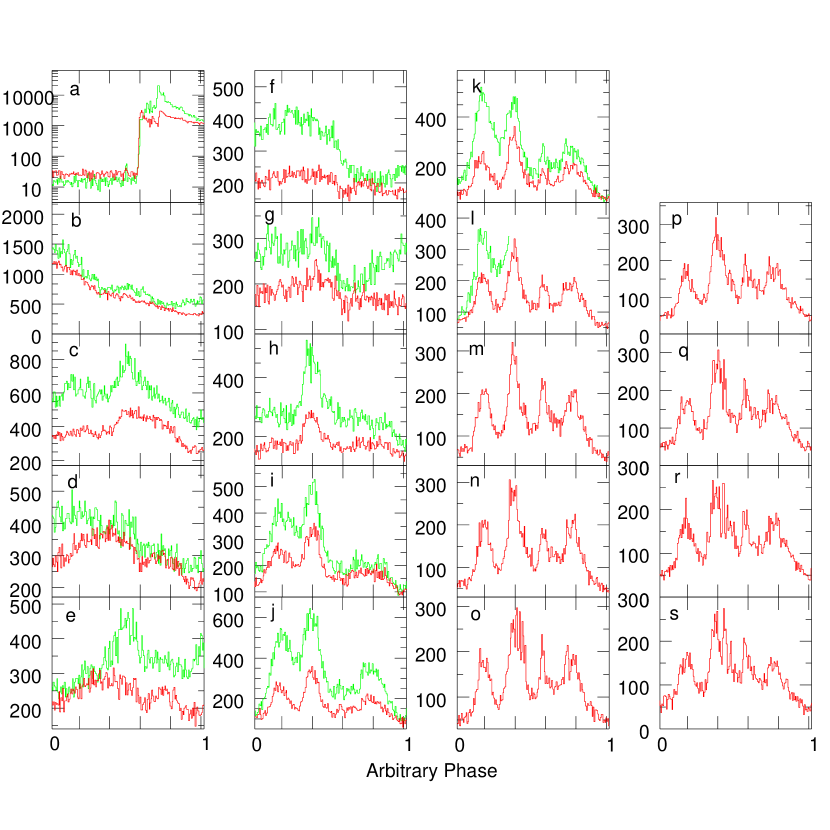
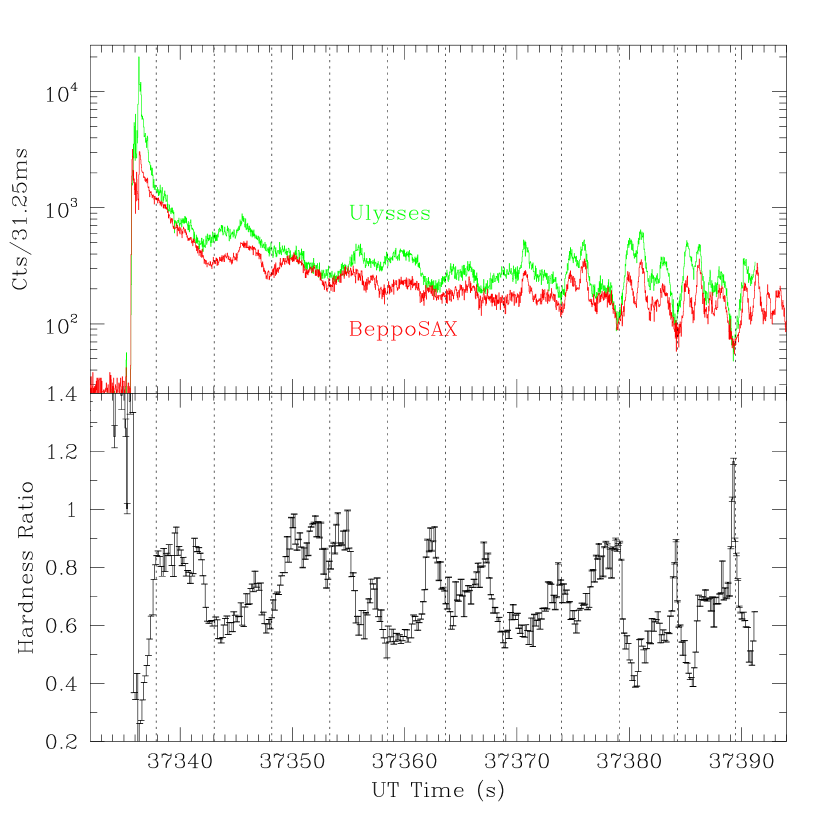
Figure 6 shows the high time resolution data from the two experiments in a series of panels, each displaying one stellar rotation cycle. Figure 7 shows the high resolution light curves in the top panel, while the lower panel shows the ratio between the curves (GRBM counts divided by Ulysses counts). The vertical dotted lines are separated by one spin period. The BeppoSAX data declines rather smoothly during the first seconds, but even at early times, the modest dips are correlated with the phase of the profound minimum which emerges after s. The softer-spectrum Ulysses data shows no such correlation. Indeed, the hardness ratio between the BeppoSAX and Ulysses counts (that is, between the flux in hard and soft X–rays; bottom panel), seems to vary quite irregularly as a function of the spin phase (that is related to the region of the neutron star) before s and going towards a ‘see-saw’ behaviour (see Feroci et al. 1999) after that.
Although the subpulses clearly exhibit intrinsic variations over successive cycles, we used the GRBM data in the last 8 panels of Fig. 6 (l through s, where the subpulse structure is clearly seen) to derive an average folded pulse shape, shown in Fig. 8. We preferred not to subtract any off-pulse continuum before folding our data. In fact, as can be noted in Figure 1 of Feroci et al. (1999), the average flux during the last 8 complete cycles in our data does not change very much, and we can therefore neglect the unbalance due to the first cycles with the highest count rate. The centroids of the four sub-pulses are nearly evenly-spaced by 1/5th of the spin phase, with a “missing subpulse” at the phase of the deep minimum.
We then used the real-time data to test for possible correlations between hardness and intensity within rotational cycles. In Figure 9 (bottom panel) we show the (100–700 keV)/(25–150 keV) ratio folded on the 5.16-s rotation period for the portion of the light curve between and 265 s (37385 to 37600 SOD), beginning shortly after the emergence of the four-peaked pattern. In the top panel of the same Figure we plot the folded Ulysses light curve, over the same period of time. There is a clear anti-correlation between the two curves, showing that the detected radiation is hardest at the intensity minima. We obtain similar results using the two BeppoSAX energy ranges (40–100 and 100–700 keV) and the same data as Fig. 9 in shorter time intervals. Furthermore, using the high energy data in the time period – 100 s, when the four-peaked emission pattern is most prominent, Feroci et al. (1999) found a ‘sawtooth’ pattern in the hardness ratio between the two energy ranges available from the BeppoSAX GRBM [(100–700)/(40–100 keV)], featuring steep hard-to-soft evolution across the deep minima in the light curve.
Note that BeppoSAX and Ulysses measurements are not able to constrain spectral variations across individual peaks of the four-peaked pattern, because of limited span of the high time resolution data set. In contrast, the Konus experiment recorded the hardness ratio [(50–250)/(15–50 keV)] with 256 ms time-resolution out to s (Mazets et al. 1999). These data show a mild positive correlation of hardness with the intensity of the individual subpulses when the four-peaked pattern is most prominent ( to 100 s). After s, the Konus light curves evolve toward a flat-top/two-peaks pattern, with the initial four peaks “merging” earliest in the soft photon band (15 – 50 keV). Although a general hard-to-soft trend is visible within the pulse since , the Konus hardness ratio becomes smoothly sawtooth-like for – 180 s, with rapid hard-to-soft evolution across the minimum. Between s and 230 s, Konus data show a clear hardness-intensity anti-correlation, resembling our Figure 9.
4.2 Time-resolved Spectroscopy
The real-time data available from BeppoSAX and Ulysses and their serendipitous synchronization allow us to study the long-term spectral evolution with a 1-s time resolution. In Figure 10 we show the hardness ratio between the GRBM (100–700 keV) and the Ulysses (25–150 keV, with a non negligible contribution from energies between 10 and 25 keV) data. These data were time-averaged over 5-s intervals in order to show the general spectral trend, averaging over the spectral evolution within each rotational cycle. Interestingly, the spectrum gradually softens during the first 40 s and then flattens when the large-amplitude pulsations set in. Finer details of the spectral variation in the early phase of the event may be found in Hurley et al. (1999b), Feroci et al. (1999) and Mazets et al. (1999).
As discussed above, both the GRBM and the Ulysses GRB detectors also provide energy spectra integrated over fixed time intervals, with Ulysses having shorter integration times than GRBM. In Table 1 we show the three shortest integration times which could be used to construct joint spectra. Interval A covers roughly the first s of the burst; Interval B, the next s; and Interval C, the s after that, which lasts until the end of flare emissions. The Ulysses spectra were co-added to obtain energy spectra integrated over approximately the same time intervals as the three GRBM energy spectra. As specified in Feroci et al. (1999), a 10% systematic uncertainty was added to the GRBM energy spectra, to account for the uncertainty in the response matrix at such a large off-axis angle, where the detector energy-dependent projected area is known with the above uncertainty. Similarly, a 10% systematic error was added to Ulysses spectra to account for differential non-linearity in the multichannel analyzer.
This procedure allows us to extend the energy spectra presented in Feroci et al. (1999) down to about 20 keV, and to fit spectral models over this extended energy range. Interval A includes the initial hard spike. During this short event our detectors were affected from pulse pile-up and deadtime effects, that are likely affecting the spectral form as well, and that cannot be accounted by the systematic error added to the data. In addition, we know from the time-resolved spectral analysis (see Fig. 10) that a large spectral evolution is comprised in this interval. For these reasons we don’t present here spectral results for interval A. From a technical point of view, attempts to make a joint fit to the data of Interval A were unsuccessful, whereas a reasonably good fit to the GRBM data alone was presented in Feroci et al. (1999) who employed optically-thin thermal bremmstrahlung (OTTB) plus power-law spectral functions, with a power-law photon index 1.5.
For interval B222 We note that for this interval we don’t expect the data to be affected by pile-up effects. In fact, the GRBM electronics can easily handle a count rate larger than 4104 counts s-1, whereas in this interval the maximum 40-700 keV count rate is of the order of 7103 counts s-1. In Ulysses the microprocessor can only handle about 3103 counts s-1 (the number actually depends strongly on the spectrum) so the electronics was definitely saturated as far as dead time is concerned, and this was corrected for. However, pulse pile-up effects only seem to come in at much higher rates, as verified with solar flares, so no correction for pile-up was required for interval B. , we know that the spectral temperature probably varies between only slightly different values during each rotation cycle (Fig. 10; Feroci et al. (1999); Mazets et al. (1999)). We tested several spectral functions, and the fit parameters that we obtain are presented in Table 2. From those values it appears that a very satisfactory spectral fit cannot be obtained for the models tested: the minimum value for the reduced is about 1.6 for 81 degrees of freedom. The minimum spectral model is composed of two blackbody (BB) laws, with temperatures of 9.3 and 20.3 keV, plus a power law (PL) with photon index of 2.8. This model gives a significantly better fit to the thermal component of the spectra than does the traditional OTTB fitting function. In both models (two BB plus PL; and OTTB with keV plus PL) the power–law accounts for approximately 10% of the total energy above 25 keV. In the case of two blackbodies, the low-temperature component accounts for about 85% of the total energy above 25 keV.
Many fewer photons were detected during Interval C, thus the spectral fits in this interval are not as strongly constrained. The models we tested and their best-fit parameters are shown in Table 3. The OTTB model cannot be reasonably excluded: according to an F-test, the OTTB fit is an improvement over a cut-off power law, with 98% confidence.
Note that the relative normalization between Ulysses and GRBM was taken as a fitting parameter in intervals B and C. This factor turned out to be rather insensitive to spectral models, and it had a very similar value in the two time intervals.
5 Re-analysis of the SIGNE and ISEE-3 data on the March 5th event
The 1979 March 5 event and the 1998 August 27 event had many similar properties, although they originated from different SGRs (e.g., Hurley et al. 1999a ; Mazets et al. (1999)). In order to compare these two flares, we now reanalyze SIGNE data on the March 5 event, following some of the same procedures that we applied to the August 27 event.
The SIGNE gamma-ray experiments aboard the Prognoz and Venera spacecrafts (Barat et al. (1981)) consisted of 64 cm2 NaI(Tl) detectors operating in various energy ranges between 50 keV and 1 MeV. For our purposes, the best SIGNE spectral data for the March 5 event consist of Venera 130–205 and 205–353 keV count rates for the first 32 s from the event onset. In Fig. 12 the light curve in two energy ranges (130–205 and 130–353 keV) is presented with 250 ms time resolution. In Fig. 13 we show a 1 s resolution SIGNE light curve and hardness ratio (203–353 keV counts divided by 130–203 keV counts) folded with the 8.0 s (Barat et al. (1979)) period. Due to onboard compression of the number of counts, errors were derived for these lightcurves by means of Monte Carlo simulations.
If we compare Fig. 13 for the March 5 event and Fig. 9 for the August 27 event, we note the same type of spectral evolution, namely harder spectra during the interpulse than during the pulse. This result may be contrasted with that of Mazets et al. (1982), who fitted an OTTB function to the energy spectra of the pulsating component of the March 5 burst. They found the interpulse spectra to be slightly softer, by 4 keV, than the pulse spectra. However, Mazets et al. (1982) fit their energy spectra over the 30–300 keV range, and had only 4 s resolution.
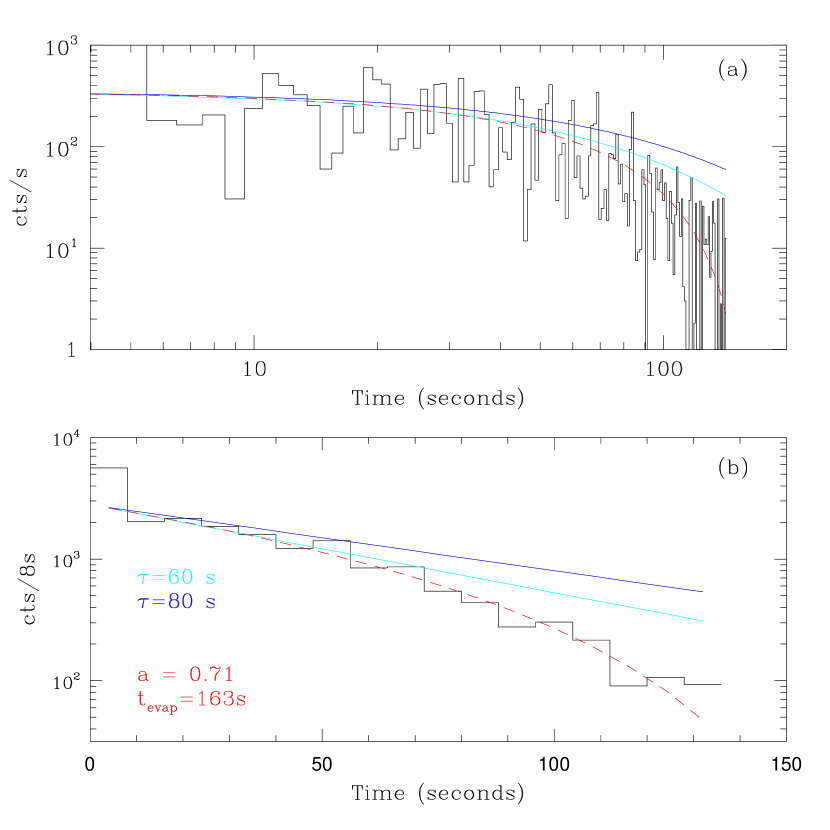
Given the excellent fit of a trapped fireball to the August 27 lightcurve (§3.1) let us compare this model, and a simple exponential decay model, with the March 5 lightcurve. In order to do this we need a longer March 5 lightcurve. At this scope we used the ISEE-3 lightcurve (for energies above 50 keV) published by Cline et al. (1982). Figure 14 shows the ISEE-3 data (Fig. 14b shows a lightcurve with binsize close to the 8-s oscillation period on a linear timescale), with superposed two exponential (=60 and 80 s) and the best-fit trapped fireball parameterization: [=(3506) counts/s, =(1635) s and ]. In doing this fit we started soon after the initial spike, that is as soon as the high amplitude oscillations set in, consistently with what we did for the giant flare from SGR 1900+14. Although the decay can be followed only over a factor in flux, the light curve does appear to break more sharply than can be fit with a simple exponential. Note also that an intermediate smooth tail (lacking large-amplitude oscillations) is much briefer in the March 5 event than it is in the August 27 event.
6 Discussion
The August 27 giant outburst exhibited three phases: a short and very intense initial spike lasting s; a softer-spectrum, smoothly declining tail lasting s; and a phase of large-amplitude oscillations at the 5.16 spin period of the source. We now briefly outline how these phases can be interpreted in the context of the magnetar model. The initial spike appears to have involved the free expansion of relativistic pair plasma – a miniature version of the gamma-ray fireballs that are observed at cosmological distances. After s, the envelope of the light curve asymptotes to a form that is consistent with a cooling fireball, trapped by the closed magnetic field lines of the neutron star. The excellent fit to the light curve gives strong evidence that most of the burst energy was either blown away from the star or deposited in the magnetosphere during the initial second. However, the intermediate 40-s tail is suggestive of an extended pair atmosphere, which requires continuing energy output from the star. Finally, we ascribe the emergence of the striking four-peaked pattern to a transition from a pair-dominated to an ion-dominated photosphere. Collimation of the X-ray jets is a direct consequence of the cooling of a trapped fireball in a superstrong magnetic field (§6 in TD95). The repetition of the four-peaked pattern over the star’s 5.16-s rotation period points to a strong multipolar component in the magnetic field of SGR 1900+14. We now discuss each phase in more detail, leaving a more extensive treatment of the theoretical issues to Paper II.
6.1 The precursor
Panel a of Fig. 6 shows the short precursor observed 0.4 s before the event by the Ulysses detector. The precursor is barely detected in the BeppoSAX data, which implies a soft spectrum, probably resembling the much more common short bursts from this source. It was conceivably the SGR analog of the “foreshocks” which often precede large earthquakes [e.g., §7.2 in Sholz 1990]. Just three months prior to the giant flare, the source emerged from a quiescent period lasting several years, and started to emit short, recurrent soft bursts. If the origin of this activity is localized crustal adjustments, compensating for magnetic stresses, the precursor could have been the last (failed) attempt to compensate for the extensive stress which caused the giant flare, a few hundred milliseconds later.
6.2 The initial hard pulse
The hard spike of the August 27 flare had a full width at half maximum duration of s, as measured by the Ulysses lightcurve (Fig. 6 and 7; see also Hurley et al. 1999b ; Mazets et al. (1999)). Its peak luminosity exceeded erg s-1 at a distance of 10 kpc (Mazets et al. 1999). This luminosity is intermediate between an Eddington-limited thermonuclear X-ray flash on an accreting neutron star, and a bright gamma-ray burst observed at high redshift.
The short duration, high luminosity and hard spectrum of the initial spike indicate that a relativistic outflow was driven from the star. To see this, consider an expanding plasma that contains comparable energy in radiation and in the rest energy of (baryonic) matter: . When the fireball expands to radius , it has Compton optical thickness . The observable duration of the photon emission is , where is the radius at which :
| (2) |
This is a several times longer than the observed duration of the August 27 event hard spike. Moreover, eqn. (2) underestimates , because it neglects the opacity of pairs that may be present, and because adiabatic expansion converts photon energy into baryon kinetic energy, reducing the radiative efficiency , and thus increasing by a factor . We conclude that this kind of marginally-relativistic fireball cannot match observations: the initial spike of the August 27 flare must have been powered by a very clean energy source: . Independent evidence for relativistic particle ejection comes from the observed synchrotron afterglow (Frail, Kulkarni & Bloom 1999).
Rapid, high-amplitude modulations in the flux of very hard photons ( keV) were observed from 0.2 to 0.6 sec after the burst trigger (Mazets et al. 1999), with peaks narrower than s. This fine time-structure constrains the baryon loading even more severely. When taken together with the hard spectra, this suggests that the light curve may directly trace the release of energy by the neutron star, with discrete 0.01-s ejections of -dominated plasma. Similar rapid variability was observed near the peak of the March 5 event (Barat et al. 1983).
Giant SGR flares are thought to occur when the evolving stellar magnetic field reaches a point of instability and catastrophically shifts to a lower-energy state. A magnetic field G can induce a shear deformation along equipotential surfaces up to the critical strain angle at which the crustal lattice fractures (TD95). However, such a field is far too weak to induce energetically significant compressional or vertical displacements in the deep crust. The time structure of the initial spike indicates that the release of energy is limited by frictional and inertial forces: a fireball resulting from a sudden readjustment of the external field such as an exterior reconnection would last only s or slightly longer (TD95). In other words, the giant outbursts are probably driven by internal (rather than external) magnetic stresses. A G magnetic field can move the core material at a speed (TD95), and so the total duration of the spike is greater than
| (3) |
Here, we scale to a stellar radius 10 km, an interior density gm cm-3 and an interior field Gauss. This implies a lower bound G to the internal magnetic field in SGR 1900+14.
6.3 The Smooth Decay
The August 27 lightcurve, averaged over the pulse period, decreased nearly monotonically after the initial spike (Fig. 4). The measured flux significantly exceeds the backward extrapolation of the trapped fireball lightcurve during the first s (Fig. 3).
The fraction of the post-spike fluence carried by this excess component can be calculated as follows. A good fireball fit in the waveband 40–100 keV is given by s, , and erg cm-2 s-1. This implies a total fireball fluence in this waveband of erg cm-2. The fireball energy for isotropic emission is then erg, assuming that SGR 1900+14 is kpc from Earth. (Substantial energy is also emitted outside this waveband.) In comparison, the excess emission from 3–40 seconds post-trigger carries a fluence erg cm-2, constituting % of the net output of 40–100 keV photons after 3 s.
The light curve shows only a mild rotational modulation during this 40-s smooth tail (Figs. 5, 6 and 7). The onset of large amplitude pulsations coincides with the decay of the excess emission (Fig. 3). The spectrum was significantly harder during the first s than during the remainder of the burst, when the temperature declined more slowly (Fig. 10 and Mazets et al. 1999). These observations suggest that the smooth excess was powered by ongoing Alfvén heating-in a pair-dominated corona surrounding the trapped fireball. The emergence of the pulsations points to a contraction from an extended, pair-loaded photosphere to one dominated by electrons and ions. The radiative flux out of the trapped fireball is collimated along open bundles of magnetic flux (§6.3.1). During this final cooling phase, the temperature of the emergent radiation becomes strongly regulated, for two reasons: the trapped fireball cools at a rate proportional to its surface area; and photon splitting becomes ineffective below a critical temperature of keV (TD95).
Given a strong enough outflux of Alfvén waves, a non-thermal pair atmosphere beyond the trapped fireball is inevitable. Interacting Alfvén modes undergo a turbulent cascade, which forces the current density slightly above the value that can be supported by the available pairs, driving electromotive heating of pairs (Thompson & Blaes 1998). The pairs also cool via Compton scattering off photons emerging from the trapped fireball below, and equilibrate to a temperature only slightly higher. The Compton parameter is determined self-consistently by balancing these heating and cooling rates. The pair temperature must exceed keV in so that the Comptonized spectrum self-consistently generates an optical depth exceeding unity in pairs, via photon collisions, (cf. Fig. 4 in TD95; Paper II). After the cascade power drops below the luminosity of the cooling fireball, this pair atmosphere evaporates and the scattering photosphere contracts to the outer boundary of the trapped fireball, where the opacity is dominated by ion-electron plasma (TD95).
We conclude that the decreasing excess flux during the 40-s smooth tail provides evidence for a late (post-spike, s) seismic excitation of the neutron star. Such active internal modes can couple strongly to exterior Alfvén waves (Blaes et al. 1989). Magnetospheric Alfvén excitation at a characteristic radius exceeding implies an internal mode period larger than msec. A variety of non-radial neutron star modes have such low frequencies (e.g., McDermott, Van Horn & Hansen 1988; Reisenegger & Goldreich 1992) including trapped Alfvén modes in the liquid interior of a magnetar (cf. eq. [3]). Toroidal modes in the crust are especially likely to be excited by the large propagating fractures of giant flares; and since they are confined to the thin crust, they can readily Alfvén-damp (Duncan 1998). This seismic energy could have been deposited at the initial outburst (during the hard spike); or, alternatively, it involved a continuing crustal motion at the fracture site (with the rate of dissipation of Alfvén energy in the magnetosphere being smoothed over the collision time between waves).
6.3.1 The Four-Peaked Repetitive Pattern
The clearing away of the wide-ranging, optically-thick magnetospheric plasma, and the opening of the first optically-thin channels extending down to near the star’s surface is dramatically shown by both Ulysses and BeppoSAX data at 35 to 50 seconds after the burst onset (Figs. 6 and 7). The subsequent X-ray light curve shows a strong, four-peaked modulation on the 5.16-s rotation period. The peaks are almost evenly-spaced at 1.0 s intervals (Figs. 6 and 8), giving rise to an strong fifth harmonic near 1.0 Hz in the power spectrum (Fig. 5 and Feroci et al. (1999)).
As can be seen in panels h through k of Fig. 6, the strongest peak, peak 2, emerges first; then peaks 1, 4 and 3 appear successively during each of the following three rotation cycles. Some evidence for the broad trough that separates peaks 1 and 4 appears much earlier, (see panels b–e of Fig. 6 and Mazets et al. (1999)). This suggests that the magnetosphere has a gross dipole imbalance, with more entrained energy on the side which faces away from Earth during the trough.
The narrow peaks and dips extend significantly above and below the extrapolation of the earlier, less modulated light curve (Fig. 7 and Fig. 1 in Feroci et al. 1999). In some places, the flux varies by almost an order of magnitude peak to dip. These features can accurately be described as collimated X-ray jets, which are swept past the line of sight as the neutron star rotates. The rotationally-averaged X-ray flux shows no dramatic change during the emergence of the pulsations (Fig. 4), which implies that the the pulsations result from a redistribution of a (nearly) conserved X-ray luminosity. This behavior is consistent with our inference that the thermal X-rays escaping from the trapped fireball are reprocessed through an extended pair-dominated halo during the first 40 s.
What causes these X-ray jets to form? Their phase stability suggests that they are tied to surface features on the neutron star. We now argue that the burst light curve provides a template of the neutron star’s surface magnetic field, and indicates that it has a complicated, multipolar structure.
This time structure is almost certainly not driven by a 1-second oscillation of the neutron star. The pattern repeats coherently with the 5.16-s rotation period of the source: four peaks per cycle, with the second one strongest, and a “missing peak” during the main trough. Furthermore Fig. 8 shows that the peaks may be not precisely spaced at even intervals; and the fourth peak is “split” by about 0.3 s. The striking 1-to-5 relationship between the peak spacing and the 5.16-s spin period might suggest some relation between the two. However, we are not aware of any mechanism that could produce such an effect, and we are led to the conclusion that it is probably a coincidence. This conclusion is supported by the Konus observation of the late time evolution of the four-peaked structure (Mazets et al. (1999)), in which there is a convergence to a double-peaked structure. Plausible internal modes of the neutron star have periods much shorter than 1.0 s. The longest-period mode in the crust is the fundamental toroidal oscillation with s (Duncan 1998); and the lowest-frequency Alfvén modes in the liquid interior are also probably too fast [eq. (3)] (Note that interior fields much stronger than the exterior dipole field are expected to result from post-collapse – dynamos; DT92, TD93.).
Independent evidence for a multipolar field structure at the surface of SGR 1900+14 comes from its quiescent X-ray light curve. Woods et al. (1999b) found a four-peaked light curve in 1997 May that resembles Fig. 8, except that the strongest peak is peak 1 (just after the minimum) rather than peak 2. A magnetar’s light curve during active periods could be dominated by persistent magnetospheric currents, driven by twisting motions of the crust (§5 in Thompson et al. 1999). This mechanism potentially explains the X-ray brightening and dramatic light-curve change in the aftermath of the August 27th flare (Woods et al. 1999b; Murakami et al. 1999). Because the crust is nearly incompressible and stably-stratified, with degeneracy pressure in hydrostatic balance with gravity that is much stronger than any lattice shear or magnetic stresses, a large-scale propagating fracture of the neutron star crust must involve a predominantly rotational motion.
Collimation of the X-ray flux from a trapped fireball is discussed in Paper II. We summarize the relevant physics here. The two photon eigenmodes are linearly polarized when vacuum polarization dominates the dielectric properties of the medium. The Compton scattering cross section of the extraordinary mode (or E-mode: ) is strongly suppressed: (e.g. Herold 1979). This suppression greatly increases the radiative transport rate both from the surface of the neutron star (Paczyński 1992) and across a confining magnetic field (TD95). However, the scattering opacity of the E-mode rises rapidly with radius (e.g., in a dipole geometry). As a result, most of the radiative transport occurs close to the surface of the star. The rapid growth of the E-mode opacity then provides a mechanism for self-collimation: the E-radiation can escape only by pushing the suspended matter to the side. A second effect involves the conversion of the E-mode to the ordinary (or O-mode; ), which occurs effectively via both photon splitting and Compton scattering near the E-mode photosphere (TD95; Miller 1995). Because O-mode scattering is not magnetically-suppressed, the energy flux converted into the O-mode is tremendously super-Eddington, and it must drive a diffuse hydrodynamical jet, outward along channels of magnetic flux that are optically-thin to the E-mode. An estimate of is given by the condition that the relativistic, O-mode driven wind has Thomson optical depth near unity across a height . This implies , where is the outflow or jet solid angle (cf. §6.4 of TD95).
The jet sub-structure is more pronounced, and more quickly emergent, in the light curves at higher energies (e.g. around 37370-37390 SOD in Fig. 7 and at s in Fig. 7 of Mazets et al. 1999). This is consistent with advection of thermal X-ray photons from hotter regions, closer to the surface of the neutron star.
6.4 Origin of the Hard Spectral Component
The combined Ulysses and GRBM lightcurves provide clear evidence for a hard component in the spectrum of the August 27 event. The early appearance of modest dips, at a phase coincident with the late deep minima, only in the GRBM data (hard X-rays) points to a site closer to the star for the early hard emission than for the soft one. In addition, the best fits to the time averaged spectra (see §4.2) confirm the persistence of a non-thermal component at times 70 s after the event onset. This hard emission, which occurs well after the initial spike, may be related to the persistent Alfvén wave dissipation that (we have argued) powers the excess emission during the smooth 40-s tail (§6.3). However, the persistence of the hard component is more consistent with particle acceleration driven by the hyper-Eddington photon flux: for example, at the boundaries of the X-ray jets, far out in the magnetosphere where the photon pressure begins to exceed the magnetic dipole pressure. Further evidence for radially extended hard emission is provided by the time-resolved hardness ratio: the spectrum is hardest during the broad troughs that occur at 5.16-s intervals (Fig. 9).
A hard spectral component (photon index ) was previously reported in the first part of the outburst (Feroci et al. 1999). This hard spectral index is consistent with passive cooling of very energetic charges. Outside a radius , the energy density in the escaping X-ray photons exceeds the energy density of the dipole magnetic field. This far from the neutron star, energetic charges cool primarily by inverse Compton scattering. Closer to the star, synchrotron emission can contribute significantly to cooling. Observations of future outbursts at energies will be sensitive to the compactness of the non-thermal emission region, and thus will be able to distinguish between these two regimes.
6.5 Comparisons with the 5 March 1979 Event
There are strikingly similarities between the giant SGR outbursts observed on 1979 March 5 and 1998 August 27. Both events radiated erg in X-rays and gamma rays, which exceeds the measured fluences of all other SGR outbursts by orders of magnitude.333The second longest of the repeat bursts from SGR 0526-66 (duration 1.5 s) occured the day after the March 5 event (Golenetskii et al. 1987). This burst could have been an aftershock on the same fault responsible for the giant outburst. Both events began with a brief and very intense gamma-ray spike, which was followed by a softer tail more than a thousand times longer in duration than ordinary SGR bursts. Also, in both events, the bursting flux was modulated by a large amplitude at the rotation period of the star (with two prominent sub-pulses in the March 5 event as compared with four in August 27), with similar intensity-hardness anticorrelation in the main pulses. Considering the many other characteristics shared by these two sources, there is compelling evidence that the two SGRs are physically similar stars which evolved through similar stages to reach similar catastrophic instabilities. Moreover, the discontinuous distribution of outburst energies/durations suggests that the giant flare instability is qualitatively distinct from the instability of ordinary SGR outbursts; i.e., different in kind, not just in degree. It is not known how this sort of bimodal behavior could be driven by an external trigger like accretion; but promising mechanisms are provided in the magnetar model (Paper II).
The most striking difference between the August 27 and March 5 events can be seen by comparing the light curves of Figure 7 with the 50–150 keV March 5th light curves recorded by the Konus experiment, onboard the Venera 11 and Venera 12 spacecraft (Figure 2 in Mazets et al. 1979, hereafter “M79”, and our Fig. 12). Almost immediately after the hard spike, the March 5th light curve is deeply modulated on the rotation period of the star, with a smooth, hump-like pattern of pulse and interpulse. The interpulse is in phase with the initial hard spike, or nearly so. Over eight succeeding rotation cycles, the peak of the main pulse diminishes more steeply with time than does the peak of the interpulse. This contrasts with the smooth, only slightly rotation-modulated, quasi-monotonic flux decline seen during the first s of the August 27th event, followed by emergence of the four, strongly-peaked X-ray “jets”.
If strong, jet-like modulations on s time scales emerged in the March 5th light curve after s, as they did in August 27, then they would not have been detected: the time resolution of the M79 light curve is not good enough. At earlier times, the M79 data argue against any such fine substructure. But there is a suggestion of 1-s X-ray jet emergence as early as s in the higher-energy (130 - 205 keV) data acquired by the French SIGNE experiment, also aboard Venera 12 (Fig. 12 and Barat et al. 1979, hereafter “B79”). According to B79, “four main peaks exist [for the first four rotation cycles], each of which appears to have a substructure of double or triple peaks of about equal intensity, spaced s apart.” Figure 2 of B79, which is a smoothed version of the lower panel of Fig. 12, suggests that the main pulse splits into three jets, and the interpulse into two.
A very strong hardness-intensity correlation within the jets would be necessary for the suggested 1-s jets of B79 to be reconciled with the smooth light curves of M79 at lower energies. Thus jetlike substructure, if real, may be more profound in data sets including higher-energy photons. We searched for this effect. The top panel of Fig. 12 shows the SIGNE light curve for photon energies ranging up to 353 keV, based upon unpublished, archival data. We folded this light curve on the 8.0 s rotation period of the star, including just the last three rotation cycles, since there is a suggestion that the substructure emerges only s after the event’s onset; cf. B79 Fig. 2. (When folded over all four observed cycles, the pattern is even smoother.) We conclude that a standard folding procedure applied to the SIGNE data provides no compelling evidence for 1-s substructures in the March 5 event.
All the observations concur that any smoothly-declining, unmodulated component in the March 5 tail lasted for s (as opposed to s for August 27) and involved a portion of the post-spike emissions that is much smaller than the fraction 0.2 estimated for the August 27 event.
One final note on the rates of giant flares. The observed number of events (2 giant flares out of 4-5 known SGRs) is consistent with the hypothesis that flares occur in all known SGRs at a rate per 20 yrs, per source. But we cannot rule out the possibility that there exists a sub-population of SGRs (or of non-SGR magnetars) which never experience such outbursts.
7 Summary and conclusions
In this paper we present an analysis of the data on the giant flare from SGR 1900+14 available from the BeppoSAX Gamma Ray Burst Monitor and from the Ulysses Gamma Ray Burst detector. We observe three clearly distinct stages in the August 27 event. During the first 0.5 seconds the star emitted an intense spike of hard gamma-rays which saturated all detectors. The fluence in this hard spike was at least half the total photon fluence of the event at energies above 15 keV (Mazets et al. 1999). Its duration and fast ( ms) rise time are consistent with a magnetically-driven instability in an ultramagnetized ( Gauss) neutron star, involving a large propagating fracture in the crust. After the hard spike, the flare’s light curve shows two distinct phases: a smooth, soft tail that lasted s, followed by the emergence of a striking pattern of four large-amplitude peaks that repeat coherently on the 5.16-s rotation period of the neutron star. During both these phases, the rotation-averaged emissions declined nearly monotonically, and released a total energy not much larger than the initial spike (cf. Mazets et al. 1999). Taken together, these observations suggest that most of the burst energy was released during this initial half-second. Half or more of the energy escaped promptly in a relativistic outflow of electron-positron pairs and hard gamma rays, and the remainder was trapped in the star or its vicinity (TD95). Independent evidence for a particle outflow comes from the detection of a radio afterglow which faded in the days following the event (Frail, Kulkarni & Bloom 1999).
The rapid drop in X-ray flux at the end of the burst gives strong evidence for an emitting resevoir of energy that evaporates completely in a finite time. The envelope of the light curve, from 40 s to the termination of the burst, is well fit by the contracting surface of a thermal photon-pair plasma, confined by the strong magnetic field and anchored to the rotating surface of the star (eqn. (1); cf. TD95). About 80% of the post-spike fluence is associated with this phase of large amplitude pulsations.
The smooth, soft tail has a harder spectrum than the subsequent emissions, and the measured X-ray flux lies well above the trapped fireball light curve that fits so well after 40 s. The flattening of the light curve, and the decay of this excess emission, occurs simultaneously with the emergence of the four large-amplitude sub-peaks. Given these facts, we associate the excess emission (representing % of the post-spike fluence) with Compton heating by an extended corona of hot pair plasma (Paper II). This heating must occur outside the trapped fireball, and is plausibly driven by a persistent output of Alfvén waves from the neutron star. In this model, the appearance of the large-amplitude pulsations coincides with the evaporation of the pair plasma and a contraction of the scattering photosphere to the surface of the trapped fireball, which sits congruent with the confining magnetic field. The persistent Alfvénic heating could be driven by crustal shear waves, excited at the initial instability (Blaes et al 1989; Duncan 1998); or by persistent but declining seismic activity in an active fault zone.
The large-amplitude pulsations require narrow collimation of the X-ray flux, which is provided by the rapid increase in the E-mode scattering cross section with distance from the neutron star. In addition, the O-mode has a much stronger coupling to matter than the E-mode and will flow hydrodynamically, at mildly relativistic speed, along open channels of magnetic flux. Both modes are emitted through X-ray fan jets, which are fed from below by rapid radiative diffusion of E-mode photons out of the trapped reservoir of hot plasma (followed by conversion to the O-mode through scattering or splitting). Collimated X-ray emission is a natural consequence of super-Eddington radiative transfer in magnetic fields stronger than Gauss (§6.4 in TD95; §6.3.1; Paper II).
The light curve of the August 27 flare provides valuable information about the magnetic geometry in SGR 1900+14. The four sub-pulses require the presence of higher magnetic multipoles – perhaps the most tangible evidence yet for a complex magnetic geometry in an isolated neutron star. In this picture, the observation of two (rather than four) sub-pulses in the March 5 event simply reflects the chance location of the outburst, and the differing structure of the magnetic field in that second source.
The joint analysis of the Ulysses and GRBM spectra shows that a hard spectral component persisted long after the initial hard spike. This conclusion is corroborated by the time-resolved hardness ratio, which shows that the burst spectrum is hardest during rotation-cycle minima. We have noted two possible mechanisms for accelerating non-thermal particles: persistent Alfvénic heating, for which there is a clear evidence at times 40 s; or magnetohydrodynamic turbulence at the boundaries of the X-ray jets responsible for the four-peaked repetitive pattern.
Finally, we re-analyzed the SIGNE data of the first 32 s of the 1979 March 5th event from SGR 0526-66, and ISEE-3 data for the first 150 s of the same event. We found more properties that are shared with the August 27 event, lending support to the hypothesis that similar physical instabilities drove both outbursts. In particular, we find that the spectral evolution across the pulse is strikingly similar to that of the giant flare from SGR 1900+14. A trapped fireball model appears to fit the March 5 light curve better than a simple exponential, just as in the case of the August 27 event, although the short duration of the available light curve and the small dynamic range () in flux do not allow a definitive conclusion. We also considered the suggestion of jetlike substructure on 1-s timescales in the SIGNE March 5th light curve (Barat et al. 1979). By a standard epoch-folding approach, we found no statistically-compelling evidence that such substructure emerged during the first 32 seconds of the event.
We conclude that the magnetar model offers a promising framework for understanding giant flares from SGRs. The basic picture of an initial relativistic outflow followed by diffusive cooling of a trapped, thermal fireball seems robust. But a detailed understanding of the radiative transport will involve mastering several complications, including: the effects of bulk hydrodynamical streaming, the large variations of the radiative transport coefficients arising from inhomogeneities in the background magnetic field, a non-dipolar magnetic geometry, and the behavior of a pair atmosphere that is simultaneously heated by Alfvén waves and irradiated with X-rays from a trapped fireball. Much work will be needed to test the physical mechanisms suggested here and in Paper II, and to make a quantitative comparison with alternative models.
References
- Alpar (2000) Alpar, M.A. 2000, preprint, astro-ph/9912228
- Amati et al. (1997) Amati, L. et al. 1997, SPIE Proceedings, 3114, 176
- Amati (1999) Amati, L. 1999, PhD Thesis, University of Rome ”La Sapienza” (http://tonno.tesre.bo.cnr.it/amati/tesi/ ).
- Band et al. (1993) Band, D. et al. 1993, ApJ, 413, 281
- Barat et al. (1979) Barat, C., Chambon, G., Hurley, K., Niel, M., Vedrenne, G., Estuline, I.V., Kurt, V.G., and Zenchenko, V.M. 1979, A&A, 79, L24
- Barat et al. (1981) Barat, C., Chambon, G., Hurley, K., Niel, M., Vedrenne, G., Estulin, I.V., Kuznetsov, A.V., and Zenchenko, V.M. 1981, Space Sci. Inst., 5, 229
- Barat et al. (1983) Barat, C., Hayles, R.I., Kurley, K., Niel, M., Vedrenne, G., Desai, U., Estulin, I.V., Kurt, V.G., & Zenchenko, V.M. 1983, A&A, 126, 400
- Blaes et al. (1989) Blaes, O., Blandford, R.D., Goldreich, P., & Madau P. 1989, ApJ, 343, 829
- Chatterjee, Hernquist, & Narayan (2000) Chatterjee, P., Hernquist, L. & Narayan, R. 2000, ApJ, 534, 373
- Cheng et al. (1996) Cheng, B., Epstein, R.I., Guyer, R.A. & Young, C. 1996, Nature, 382, 518
- Cline et al. (1998) Cline, T., Mazets, E. and Golenetskii, S.V., 1998, IAU Circular no. 7002
- Cline et al. (1982) Cline, T. et al. 1982, ApJ 255, L45
- Duncan & Thompson (1992) Duncan, R.C. & Thompson, C., 1992, ApJ, 392, L9 (DT92)
- Duncan (1998) Duncan, R.C. 1998, ApJ, 498, L45
- Feroci et al. (1997) Feroci, M. et al. 1997, SPIE Proceedings, 3114, 186
- Feroci et al. (1998) Feroci, M. et al. 1998, IAU Circular no. 6945
- Feroci et al. (1999) Feroci, M. et al. 1999, ApJ 515, L9
- Frail, Kulkarni and Bloom (1999) Frail, D., Kulkarni, S., and Bloom, J., 1999, Nature 398, 127
- Frontera et al. (1997) Frontera, F., Costa, E., Dal Fiume, D., Feroci, M., Nicastro, L., Orlandini, M., Palazzi, E., and Zavattini, G. 1997, Astr. Astrophys. Suppl. Ser., 122, 357
- Golenetskii et al. (1987) Golenetskii,S.V. et al. 1987, Sov. Astron. Lett. 13(3), 166
- Goldreich & Reisenegger (1992) Goldreich, P. & Reisenegger A. 1992, ApJ, 395, 250
- Gogus et al. (1999) Gogus, E. et al. 1999, ApJ, 526, L93
- Gogus et al. (2000) Gogus, E. et al. 2000, ApJ, 532, L121
- Gotthelf, Vasisht & Dotani (1999) Gotthelf, E.V., Vasisht, G. & Dotani, T. 1999, ApJ, 522, L33
- Harding, Contopoulous & Kazanas (1999) Harding, A.K., Contopoulous, I. & Kazanas, D. 1999, ApJ, 525, L125
- Heyl and Hernquist (1997) Heyl, J.S. & Hernquist, L. 1997, ApJ, 489, L67
- Heyl and Kulkarni (1998) Heyl, J.S. & Kulkarni, S.R. 1998, ApJ, 506, L61
- Herold (1979) Herold, H. 1979, Phys. Rev. D, 19, 2668
- Hurley et al. (1992) Hurley, K., et al. 1992, Astron. Astrophys. Suppl. Ser., 92(2), 401
- (30) Hurley, K. et al. 1999a, ApJ, 510, L107
- (31) Hurley, K. et al. 1999b, Nature 397, 41
- (32) Hurley, K. et al. 1999c, ApJ, 510, L111
- (33) Hurley, K. et al. 1999d, ApJ 523, L37
- (34) Hurley, K., Kouveliotou, C., Woods, P., Mazets, E., Golenetskii, S., Frederiks, D., Cline, T., and van Paradijs, J. 1999e, ApJ 519, L143
- Hurley et al. (2000) Hurley, K. et al. 2000, ApJ 528, L21
- Inan et al. (1999) Inan, U., Lehtinen, N., Lev-Tov, S., Johnson, M., Bell, T., and Hurley, K. 1999, Geophys. Res. Lett., 26(22), 3357
- Kouveliotou et al. (1993) Kouveliotou, C., et al. 1993, Nature, 362, 728
- (38) Kouveliotou, C., et al., 1998a, Nature 393, 235
- (39) Kouveliotou, C. et al. 1998b, IAU Circular no. 6929, June 3, 1998
- (40) Kouveliotou, C. et al. 1998c, IAU Circular no. 6944
- Kouveliotou et al. (1999) Kouveliotou et al. 1999, ApJ, 510, L115
- Li (1999) Li, X.D. 1999, ApJ, 520, 271
- Kulkarni & Frail (1993) Kulkarni, S. & Frail, D., 1993, Nature, 365, 33
- Marsden, Rothschild & Lingenfelter (1999) Marsden, D., Rothschild, R.E, & Lingenfelter, R.E. 1999, ApJ, 520, L107
- (45) Mazets, E.P., Golenetskii, S.V., and Gur’yan, Yu.A. 1979a, Soviet Astron. Lett., 5(No.6),343
- (46) Mazets, E.P., et al., 1979b, Nature, 282, 587
- Mazets et al. (1982) Mazets, E.P., Golenetskii, S.V., Gur’yan, Yu.A., Ilyinskii, V., 1982, Astrophys. Space Sci. 84, 173
- Mazets et al. (1999) Mazets, E.P., et al., 1999, Astron. Lett., 25(10), 635
- McDermott, Van Horn & Hansen (1988) McDermott, P.N., Van Horn, H.M. & Hansen, C.J. 1988, ApJ, 325, 725
- Miller (1995) Miller, C.M. 1995, ApJ, 448, L29
- Murakami et al. (1994) Murakami, T.. et al., 1994, Nature, 36, 129
- Murakami et al. (1999) Murakami, T. et al. 1999, ApJ, 510, L122
- Paczyǹski (1992) Paczyǹski, B., 1992, Acta Astron., 42, 145
- Palmer (1999) Palmer, D., 1999, ApJ, 512, L113
- Reisenegger & Goldreich (1992) Reisenegger A. & Goldreich P. 1992, ApJ, 395, 240
- Sholz (1990) Sholz, C.H. 1990, The Mechanics of Earthquakes and Faulting (Cambridge: Cambridge Univ. Press)
- Smith, Bradt & Levine (1999) Smith, D.A., Bradt, H.V. and Levine, A.M., 1999, ApJ, 519, L147
- Thompson & Blaes (1998) Thompson, C. & Blaes, O. 1998, Phys. Rev. D, 57, 3219
- Thompson & Duncan (1993) Thompson, C. & Duncan, R.C. 1993, ApJ, 408, 194 (TD93)
- Thompson & Duncan (1995) Thompson, C., & Duncan, R.C., 1995, Mon. Not. R. Astr. Soc., 275, 255 (TD95)
- Thompson & Duncan (1996) Thompson, C. & Duncan, R.C. 1996, ApJ, 473, 322 (TD96)
- Thompson et al. (1999) Thompson, C., Duncan, R.C., Woods, P.M., Kouveliotou, C., Finger, M.H., & van Paradijs, J. 1999, ApJ, in press. astro-ph/9908096
- Thompson et al. (1999) Thompson, C., et al. 2000, submitted to ApJ (Paper II)
- van Paradijs, Taam & van den Heuvel (1995) van Paradijs, J., Taam, R.E & van den Heuvel E.P.J. 1995, A& A, 299, L41
- Vasisht et al. (1994) Vasisht, G., et al., 1994, ApJ, 431, L35
- Vasisht & Gotthelf (1997) Vasisht, G. & Gotthelf, E.V. 1997, ApJ, 486, L129
- (67) Woods, P., Kouveliotou, C., van Paradijs, J., Hurley, K., Kippen, R., Finger, M.H., Briggs, M., Dieters, S., and Fishman, G. 1999a, ApJ, 519, L139
- (68) Woods, P., Kouveliotou, C., van Paradijs, J., Finger, M.H. & Thompson, C. 1999b, ApJ, 518, L103
- Woods et al. (2000) Woods, P., Kouveliotou, C., Finger, M.H., Gogus, E., Scott, D.M., Dieters, S., Thompson, C., Duncan, R.C., Hurley, K., Strohmayer, T., Swank, J. & Murakahmi, T. 2000, ApJ, 535, L55
FIGURE CAPTIONS
FIGURE 1: Background-subtracted Ulysses and BeppoSAX light curves of the decay portion of the 1998 August 27 giant flare, showing the overall patterns of decay in the three energy bands. The red continuous lines indicate exponential laws with the specified time constants, . Blue, dashed lines indicate exponential laws with exchanged time constants (70 s where is 78 s, and vice versa).
FIGURE 2: Analytical model of a cooling trapped fireball (eq. [1]) superimposed on the Ulysses light curve, background subtracted and binned to 5-s intervals, the closest available approximation to the star’s spin period. Panel (a) shows the complete light curve while Panel (b) shows a zoom-in of the final drop. The green dashed line shows the result of a simultaneous fit (see text) made to the evaporation time , the fireball index and the fireball luminosity for the time interval from 50 to 450 s after the peak (that provides a value too large for ). The blue dashed line shows the result of a similar fit but to the time interval from 250 to 450 s after the peak. The red curve shows the best fit to the curve in the time interval from 50 to 450 s, constraining in the 1- range found from the fit to the 250-450 s curve. The best-fit index (0.75) is slightly larger than the value expected for a spherical trapped fireball. The larger fireball index could result from a slight amount of neutrino cooling, or a negative temperature gradient within the fireball. By contrast, a deviation from spherical geometry would tend to decrease . A large excess flux during the first s disappears just as the large amplitude pulsations emerge. Panel (b) shows on a linear scale how well the trapped fireball model fits the final drop of the light curve, which cannot be described by an exponential decay (see Fig. 1).
FIGURE 3: Panel (a): The same analytical model as in Fig. 2 (red curve) is shown against the 0.5 s Ulysses lightcurve. Panel (b): The same trapped fireball model is fit to the 40-100 keV GRBM 1-s lightcurve. The red dashed line was obtained constraining the parameter to vary within the 1- range found for 25-150 keV, allowing only the and to vary freely. The blue dashed curve is the best-fit, without any constraint to the parameters. Panel (c): Same as panel (b), but for the GRBM 100-700 keV 1-s lightcurve. Note that here the initial excess appears significantly larger, relative to the fireball model, than it does in the 40-100 keV light curve. This indicates a softening of the spectrum during the first 40 s.
FIGURE 4: BeppoSAX GRBM 40–700 keV high time-resolution light curve, rebinned to 5.15625 s, which is our best approximation to the stellar rotation period. This shows that the cycle-averaged emission decays nearly smoothly and monotonically.
FIGURE 5: Power Spectral Densities of the August 27 light curve in four consecutive time intervals (four rows), using Ulysses data with 0.5 s time resolution (first column), and BeppoSAX data with 1 s time resolution, in two GRBM energy ranges (second and third columns). The reference time is the onset of the event: 37335.168 SOD for Ulysses and 37335.0565 SOD for GRBM. The time intervals, with respect to the reference times, chosen to perform the FFTs are indicated in the panels. In the high-energy band (100–700 keV) beyond 300 s the statistical quality of the data did not allow to perform an FFT. The data were detrended using the best-fit fireball models for each energy range. For the first 50 s an additional second-order polynomial detrending procedure was applied to the data to account for the excess in the flux. The bottom three panels for 25–150 keV have a vertical scale limited at a 15% of the maximum value (reached in two bins around 0.2 Hz and indicated with an arrow).
FIGURE 6: Pulse shape evolution from the BeppoSAX 40–700 keV (red) and Ulysses 25–150 keV (green) 32 ms resolution data. Horizontal scale gives the phase of the stellar rotation cycle, with zero phase taken at the deep minimum. Each tickmark on the horizontal scale is 1/5 cycle, or 1.032 s. Vertical scale gives counts per 32 ms.
FIGURE 7: BeppoSAX 40–700 keV (red) and Ulysses 25–150 keV (green) 31.25 ms count rates (top panel), and their ratio (bottom panel). Vertical dotted lines are spaced by one 5.16 s period.
FIGURE 8: Folded light curve of the last eight 5.16 s pulses of the August 27th event observed with the GRBM in the 40–700 keV range.
FIGURE 9: Ulysses (25-150 keV) light curve and hardness ratio (100-700 keV)/(25-150 keV) for the August 27th event from SGR 1900+14, folded at an arbitrary epoch and with a period of 5.1589715 s. This plot includes data beginning 50 s after the flare’s onset (after the four-peaked pattern was well-established) and extending to the end of the event.
FIGURE 10: Hardness ratio between GRBM (100–700 keV) and Ulysses (25-150 keV) light curves, rebinned to 5 s in order to average (approximately) over rotation cycles and show the general spectral trend. After t37510 s the average is performed over 10 s to compensate for the lower statistics.
FIGURE 11: Top : Combined Ulysses and GRBM energy spectra of the second time interval (Interval B) and the best fitting spectral model. The spectral model is composed by two blackbody models ( and 20.2 keV, respectively) and a power law (photon index 2.8). Bottom : Combined Ulysses and GRBM energy spectra of the third time interval (Interval C) and its best fit with an Optically Thin Thermal Bremmstrahlung spectral model (26.3 keV).
FIGURE 12: March 5, 1979 light curve in two energy ranges, as measured during the first 32 seconds of the event by the SIGNE experiment onboard the Venera 12 spacecraft.
FIGURE 13: March 5, 1979 light curve in the 130-353 keV nominal energy range (Top Panel) and hardness ratio of counts in 203-353 keV to counts in 130-203 keV (Bottom Panel), as measured during the first 32 seconds of the event by the SIGNE experiment onboard the Venera 11 and 12 spacecraft. Data were folded on the 8-s rotation period of the star. The characteristic pulse/interpulse pattern of the March 5th light curve is apparent in the top panel. Counts were corrected for systematics due to onboard compression. Error bars were derived by Monte Carlo simulations.
FIGURE 14: Panel (a) : The ISEE-3 data (above 50 keV, Cline et al. 1982) of the March 5, 1979 event is compared with exponential decay laws with time-constants and 80 s; and with the best-fit parameterization of a cooling, trapped fireball (eq. [1]). The event trigger is at =5 s on the horizontal scale. Panel (b) : Comparison of the ISEE-3 data, rebinned to 8-s intervals, with the same analytic models. The rapid drop in flux after s appears to be better-fit by models of emission from the contracting boundary of a trapped fireball than by exponential decay models.
| Ulysses | Ulysses | GRBM | GRBM | |
|---|---|---|---|---|
| Interval | UT Start Times, s | UT End Times, s | UT Start Times, s | UT End Times, s |
| A | 37335.268 | 37398.235 | 37335.7 | 37402.7 |
| B | 37398.235 | 37526.238 | 37402.7 | 37530.7 |
| C | 37526.238 | 37654.238 | 37530.7 | 37658.7 |
| Model | kT1 | kT2 | reduced | GRBM/Ulysses normalization | |||
|---|---|---|---|---|---|---|---|
| BB+BB+PL | 9.3 keV | 20.2 keV | 2.8 | - | - | 1.62 (81 dof) | 0.43 |
| OTTB+PL | 22.7 keV | - | 3.0 | - | - | 2.43 (82 dof) | 0.44 |
| BREMSS+PL | 27.0 keV | - | 2.7 | - | - | 2.62 (82 dof) | 0.43 |
| BB+PL | 10.8 keV | - | 3.4 | - | - | 3.40 (82 dof) | 0.45 |
| BAND | - | - | 2.3 | 5.4 | 44.9 keV | 3.95 (82 dof) | 0.38 |
| Model | kT1 | kT2 | reduced | GRBM/Ulysses normalization | |||
|---|---|---|---|---|---|---|---|
| CUTOFFPL | 33.1 keV | - | 1.6 | - | - | 1.004 (64 dof) | 0.34 |
| BREMSS | 30.7 keV | - | - | - | - | 1.005 (65 dof) | 0.33 |
| BB+PL | 12.2 keV | - | 3.6 | - | - | 1.051 (63 dof) | 0.33 |
| OTTB | 26.3 keV | - | - | - | - | 1.081 (65 dof) | 0.32 |
| BAND | - | - | 2.3 | 8.9 | 50 keV | 1.119 (63 dof) | 0.35 |
| BB | 14.0 keV | - | - | - | - | 2.108 (68 dof) | 0.31 |