BeppoSAX observations of Narrow-Line Seyfert 1 galaxies: II. Ionized iron features in Arakelian 564
Abstract
The BeppoSAX observations of the bright Narrow–Line Seyfert 1 galaxy Ark 564 are presented along with a high quality optical spectrum taken at the 1.5m telescope at La Silla. The 0.1–10 keV X–ray spectrum is characterized by a strong soft component which is best described by blackbody–like emission with a temperature of 160 eV. At higher energies a steep ( 2.4) power–law tail is present. There is evidence of an ionized reflector in the form of an iron line and edge. We do not find significant evidence of soft X–ray features if the spectrum is modelled with a two component continuum. The optical and X–ray spectral properties support the hypothesis of a high accretion rate onto a low mass black hole.
Key Words.:
X-rays: galaxies – Galaxies: Seyfert – Galaxies: individual: Ark 5641 Introduction
In recent years sensitive ROSAT and ASCA observations have revealed that a class of objects classified on the basis of their optical spectra as Narrow–Line Seyfert 1 galaxies (hereinafter NLS1) exhibits peculiar and rather extreme properties in the X–ray band. Large amplitude X-ray variability with timescales as fast as a few minutes (Boller et al. 1997) and extremely soft X–ray spectra in the ROSAT band are common among these objects (Boller et al. 1996). ASCA observations have extended the ROSAT results to higher energies. On average, NLS1 galaxies have steeper X–ray spectra (Brandt et al. 1997) and higher variability amplitude variance (Fiore et al. 1998; Leighly 1999a; Turner et al. 1999a) compared to Seyfert 1s with broad optical lines. The anti–correlation between the X–ray spectral slope and the H FWHM is now a well–established observational property tested across a wide range of X–ray luminosities (Laor et al. 1997), suggesting that NLS1 represent an extreme of Seyfert activity, possibly linked to an extreme value of a fundamental physical parameter.
The ASCA observation of REJ 1034+393 can be considered a breakthrough in the understanding of NLS1, because it was the first object of this class observed above 2 keV. The 0.5–10 keV spectrum is dominated by a strong soft component below 2 keV; a steep ( 2.6) power law tail at higher energies and an ionized iron K line at 6.7 keV (although detected only at the 2 level) are also present (Pounds et al. 1995). Ionized iron lines have been discovered in a few other objects observed by BeppoSAX (Comastri et al. 1998, paper I) and ASCA (Turner et al. 1998; Leighly 1999b), suggesting that the fundamental parameter could be a particularly high accretion rate (Pounds et al. 1995; Laor et al. 1997).
We have started an observational programme to study a sizeable sample of NLS1 with BeppoSAX with the aim of investigating the broad band X–ray spectral and variability properties of these objects. We are taking advantage of the increased effective area at high energies, especially above 5 keV, where the MECS detectors provide the best opportunity to investigate the iron line properties.
Arakelian 564 ( = 0.0247, = 14.16) is an ideal candidate for such an investigation being the brightest NLS1 in the 2–10 keV band. Previous ROSAT and ASCA observations revealed a complex X–ray spectrum with a few absorption/emission features around 1 keV (Brandt et al. 1994; Leighly 1999b; Vaughan et al. 1999a; Turner et al. 1999b, hereinafter TGN99). More recently, an RXTE/PCA observation (Vaughan et al. 1999b, hereinafter V99) provided the first spectrum of this object up to 20 keV. The most remarkable result is the presence of a deep ionized edge at 8.5 keV interpreted as reflection from an ionized disc. In the present paper we report the results of 3 BeppoSAX observations of Ark 564 together with a high–quality optical spectrum obtained at La Silla one year before the first X–ray observation.
2 The optical spectrum
2.1 Observations and reduction
Optical spectra of Ark 564 were obtained in photometric conditions at the ESO 1.52m telescope on 1996 October 1, using the Boller & Chivens spectrograph with a 127mm camera and a Loral/Lesser thinned CCD with pixels. The pixel size is , and the projected scale on the detector 0.82 arcsec pixel-1. The grating used has 600 grooves mm-1. The spectra were obtained through a 2-arcsec wide slit, at a resolution of 4.6 Å. Two integrations of 1200 seconds each were obtained, with mid-point airmasses of 2.05 and 1.97.

Standard techniques were used to reduce the spectra, using the NOAO IRAF package. The reduction included the correction of the atmospheric absorption bands of O2 and H2O, obtained by interpolating and normalizing the continuum of the spectrophotometric standards. A short exposure of Ark 564 obtained during the same night through an 8 arcsec slit was used to correct the narrow-slit spectra for light losses and differential refraction. This was achieved by fitting a low-order polynomial to the ratio between each narrow-slit spectrum and the broad-slit one, and dividing each narrow-slit spectrum by the corresponding fit. Despite this correction, the low culmination point of the target with respect to the observing site still leaves a considerable uncertainty on the spectrophotometric quality of the data, particularly at Å. The two narrow-slit spectra were averaged and yielded the final spectrum shown in Fig. 1. The calibration curves obtained during the night and the individual spectra coincide to within 5%, thus we consider the spectrophotometric quality of the red part of the spectrum to be of this order.
2.2 Properties of the optical spectrum
While the widths of the permitted lines fully justify the classification of Ark 564 as a NLS1, other characteristics of its optical spectrum are not as extreme as usually observed among NLS1. In particular, the source displays a strong and rich forbidden line spectrum, while the Fe II lines have strengths more similar to those of normal Seyfert 1 nuclei rather than the high values displayed by many NLS1: the ratio between the Fe II 6250 blend and H is 0.6, only slightly higher than the typical value for classic Seyfert 1 spectra (Joly 1988).
The optical continuum is flat and likely to include a significant stellar component. For this reason, and because of the uncertainty in the calibration of the blue part of the spectrum, no attempt was made to fit a continuum across the entire spectrum. Instead, local straight-line continua were fitted under the main lines in order to measure their fluxes.
The fluxes of H and [O III] were measured after subtraction of the strongest blending lines with suitable templates. For Fe II and Fe II we used the profile of H scaled by a factor 0.015, under the reasonable assumption that the lines in multiplet 42 are of equal intensity. To subtract [O III] we used the deblended profile of [O III] scaled by one third. The intensity of the narrow components of the Balmer lines, and the [N II] lines which contaminate H were estimated by subtracting the [O III] template, scaled in order to obtain a smooth residual profile. The fluxes, widths and equivalent widths of the individual lines and components thus obtained are listed in Table 1.
| Linea | Fluxb | FWHMc | EWd |
|---|---|---|---|
| 3727 | 2.6 | 630 | 6 |
| 3869 | 1.7 | 600 | 4 |
| He I 3889 + H | 1.1 | 1300 | 3 |
| 3968 + H | 1.4 | 900 | 4 |
| H + 4068,4076 | 2.6 | 1400 | 7 |
| H broad | 5.0 | 1030 | 14 |
| H narrow | 0.4 | 400 | 1 |
| 4363 | 0.7 | 400 | 2 |
| Fe II 4570 blend | 11.9 | … | 32 |
| He II 4686 | 4.5 | 1100 | 12 |
| H broad | 17.0 | 960 | 45 |
| H narrow | 1.3 | 400 | 3 |
| 4959 | 5.4 | 400 | 16 |
| 5007 | 18.0 | 400 | 49 |
| Fe II 5250 blend | 15.1 | … | 43 |
| 5721 | 0.5 | 630 | 2 |
| He I 5876 | 2.5 | 1040 | 7 |
| 6087 | 0.8 | 500 | 3 |
| 6300 | 1.7 | 330 | 5 |
| 6364 | 0.7 | 340 | 2 |
| 6374 | 2.6 | 700 | 8 |
| 6548 | 1.2 | 400 | 4 |
| H broad | 89.3 | 700 | 300 |
| H narrow | 3.6 | 400 | 12 |
| 6584 | 3.6 | 400 | 12 |
| He I 6678 | 1.3 | 1520 | 4 |
| 6717 | 1.3 | 300 | 4 |
| 6731 | 1.2 | 300 | 4 |
| He I 7065 | 1.1 | 790 | 4 |
| 7136 | 0.4 | 250 | 2 |
a All wavelengths are in the rest frame
b Units of erg cm-2 s-1
c km s-1
d
3 BeppoSAX Data reduction
Arakelian 564 was observed with the BeppoSAX (Boella et al. 1997a) Narrow Field Instruments: LECS (0.1–10 keV; Parmar et al. 1997), MECS (1.3–10 keV; Boella et al. 1997b), HPGSPC (4–60 keV; Manzo et al. 1997) and PDS (13–200 keV; Frontera et al. 1997). We will focus on the results obtained from the imaging gas scintillation proportional counters LECS and MECS. The source was not detected in the HPGSPC nor in the PDS (but see below). The observations were performed with 2 active MECS units (after the failure of the MECS1 unit on 1997 May 6) in 3 different periods. The exposure times and background–subtracted count rates in the 3 observations are reported in Table 2. The shorter LECS exposure is caused by the instrument being switched off over the illuminated Earth, while the useful on–source time for the PDS is about half of the MECS exposure because the PDS monitors the source and background alternately.
Standard data reduction techniques were employed following the prescriptions given by Fiore et al. (1999). LECS and MECS spectra and light curves were extracted from regions with radii of 8 arcmin and 4 arcmin respectively, in order to maximize the accumulated counts at both low and high energies. Background spectra were extracted from high Galactic latitude “blank” fields and also locally from an annular region around the target. The mean local background is consistent with that of the blank field both in the LECS and in the MECS. The PDS data were reduced using the variable rise time threshold technique to reject particle background. The source is not detected by the PDS in any of the 3 periods. After combining the observations, a weak signal is present in the first channels (13–30 keV) with a formal detection significance of 2.8. Taking into account the systematic uncertainty in the PDS background subtraction (Guainazzi and Matteuzzi 1997), the high energy flux of Ark 564 is only about 2 above the background.
The 3 LECS and MECS data sets were analyzed separately in order to investigate possible variations between the 3 observing periods and within each observation.

| Dates | Exposures (s) | Count Rate (cts/s) | ||
|---|---|---|---|---|
| LECS | MECS | LECS | MECS | |
| 14/11/97 | 12574 | 26196 | 0.2540.005 | 0.1700.003 |
| 12/06/98 | 20209 | 46765 | 0.2500.004 | 0.1690.002 |
| 22/11/98 | 11963 | 29154 | 0.2550.005 | 0.1860.003 |
Count rates are in the 0.2–2 keV and 2–10 keV bands for the LECS and MECS, respectively.
The source is clearly variable on timescales of a few thousands of seconds in all observations. In Fig. 2 the LECS and MECS light curves are shown for the longest exposure (June 1998). The light curves of June 1997 and November 1998 are similar in amplitude and timescale of variability. Significant variability up to a factor 2 is present in both energy ranges. There is some evidence of a harder spectral state at the beginning of the June 1998 observation (Fig. 2). As the hardness ratio technique would be insensitive to variations in the iron K flux, we have compared the 5–7 keV and 6–7 keV count rates for each observation. The amplitude of variations in these two narrow bands is of the order of 10–15 %, indicating the lack of significant flux variability.
Spectral variability could be present at some level, but it does not appear to be relevant since for most of the observing periods, including the November 1997 and November 1998 observations, the hardness ratio light curve is rather constant. Therefore the spectral analysis was carried out using all the available data. The resulting exposure times are 44.7 and 102.1 ks in the LECS and MECS, respectively.
4 Spectral analysis
4.1 The high–energy spectrum
Spectral analyses were performed using the XSPEC 10 software package and the latest release of the response matrices. The MECS spectrum was rebinned in order to obtain at least 30 counts per energy channel and to sample the energy resolution of the detector with 3 channels at all energies where possible using the appropriate grouping file (see Fiore et al. 1999). The residuals of a power–law fit to the 2–10 keV spectrum indicate the presence of line–like excess emission at 6–7 keV and of an edge–like structure at energies greater than 8 keV (Fig. 3).

The MECS data are best fitted (Table 3) with a rather steep power law ( 2.4) plus a narrow iron emission line at 6.8 keV and an absorption edge at 9.5 keV in the source rest–frame ( = 0.025). The addition of both features improves the fit at the 99.99 % level according to an –test. There is no further improvement in the fit if the line width is left free to vary below the BeppoSAX MECS energy resolution at 6 keV (about 500 eV FWHM). The statistic was applied to test the significance of the individual components. The results indicate that the edge and the line are required at 99.96 % and 99% confidence respectively. A contour plot of the line versus edge energies clearly suggests that they originate from highly ionized gas (Fig. 4). Indeed the ionization state implied by the best–fit edge energy is greater than Fe XXIII at the 99% confidence level. A similar constraint is obtained from the energy and equivalent width of the iron line (see Matt et al. 1993). The observed features could be due either to gas along the line of sight (a warm/hot absorber), or arise in the surface layers of a highly ionized optically thick accretion disc (a warm/hot reflector). A good quality E 10 keV spectrum or a tight upper limit on the high–energy flux would distinguish between the two possibilities. Unfortunately, the marginal detection in the PDS energy range is consistent with both the extrapolation of the best fit 2–10 keV spectrum and with a flattening due to the onset of a reflection component as long as the relative normalization between the reflected and direct flux is 3. Given that in both cases the imprints of ionized absorption/reflection would also affect the spectrum below 2 keV, we postpone the discussion of these models to the next section. The best fit 2–10 keV flux of 1.45 10-11 erg cm-2 s-1 corresponds to a luminosity of 4 1043 erg s-1.
| EW (eV) | /d.o.f. | ||||
|---|---|---|---|---|---|
| 2.400.04 | … | … | … | … | 87.4/67 |
| 2.420.04 | 6.78 | 13565 | … | … | 75.8/65 |
| 2.370.04 | … | … | 9.49 | 0.7 | 68.8/65 |
| 2.400.04 | 6.78 | 11565 | 9.52 | 0.67 | 60.5/63 |

4.2 The 0.1–10 keV spectrum
The LECS spectrum was rebinned and grouped in the 0.1–4 keV energy range following the same criteria adopted for the MECS data. The LECS and MECS spectra were fitted simultaneously leaving the relative normalization free to vary in the range 0.7–1.0 (Fiore et al. 1999) to take into account the intercalibration systematics between the two instruments. The Galactic column density towards Ark 564, cm-2 (Dickey & Lockman 1990), is obtained from 21 cm radio measurements averaged over relatively large portions of the sky (several tens of arcmin2). As a result, fluctuations on smaller scales could introduce errors of the order of 1020 cm-2 (see Elvis et al. 1994). The low–energy cold absorption column density, included in all fits, is free to vary, unless otherwise specified, to account for these uncertainties.
The origin of the absorption/emission features in the 6–10 keV energy range (Sect. 4.1) was tested against a warm absorber and an ionized reflection model (ABSORI and PEXRIV respectively in XSPEC; Magdziarz & Zdziarski 1995), including a narrow K emission line, over the entire BeppoSAX energy range (Table 4). In both fits the temperature of the warm/hot gas is fixed at 106 K. The free parameters were the power law slope , the line energy and equivalent width, the warm gas column density (or the relative normalization of the reflected component with respect to the incident continuum ) and the ionization parameter (defined as , where is the luminosity of the source, the density of the medium and the distance of the absorbing matter from the nucleus). Even though the overall shape of the BeppoSAX spectrum is relatively well reproduced with the parameters shown in Table 4, and the low energy absorption column density ( 7 1020 cm-2) is consistent with the Galactic value, neither of the models provide an acceptable fit, leaving systematic residuals in the data–to–model ratio especially at low energies, where a line–like feature around 1 keV is clearly visible (Fig. 5). At high energies the best–fit values for the energy and EW of the iron K line are consistent with those obtained by fitting the 2–10 keV spectrum alone (see Table 3). A single power law absorbed by an ionized medium can barely account for the K line intensity. Combining ionized reflection and warm absorption, the improvement in the overall fit quality is only marginal and the residuals are similar to those plotted in Fig. 5.

The data–to–model ratio of the BeppoSAX 0.1–10 keV spectrum obtained by fitting the 2–10 keV data and then extrapolating the power law down to 0.1 keV is shown in Fig. 6. A strong soft component emerging below 1–2 keV is clearly evident.

| model | (keV) | EW (eV) | (erg s-1 cm) | / | /dof | |
|---|---|---|---|---|---|---|
| ABSORI+PO+LINE | 2.680.03 | 6.81 | 18169 | 1667 | 4.3 | 305.6/260 |
| PEXRIV+PO+LINE | 2.610.03 | 6.76 | 8765 | 8776 | 0.70.1 | 363.5/260 |
Spectral fits were next performed with two component models (Table 5). The high–energy tail of a blackbody or a multicolour accretion disc spectrum plus a power law above 2 keV provide a good fit to the 0.1–10 keV X–ray continuum. The blackbody temperatures are of the order of 150–200 eV, while the power–law photon index is about 2.4. Although an acceptable statistical description of the data is obtained if the soft X-ray spectrum is modelled with an optically thin thermal plasma (the MEKAL code in XSPEC), the best fit abundances ( 0.02) and the soft X-ray variability are difficult to explain with such a model. Alternative two component models for the 0.1–10 keV continuum, such as a double power law or a broken power law, do not provide an acceptable description of the data.
The derived best–fit value for the low–energy absorption column density is always lower than the Galactic value, suggesting the presence of an additional softer component. Indeed, when the column density is kept fixed at the Galactic value, systematic positive residuals with respect to the blackbody plus power–law fit, are present below 0.25 keV (the carbon band). Not surprisingly, the addition of an extremely soft blackbody component ( 30 eV) improves the fit.
Given that the discrepancy between the column density values derived from the X–ray data and the 21 cm measurements ( 1020 cm-2) is comparable with the errors associated with the latter, the presence of an ultrasoft component should be considered with caution. Finally even though the shape of the residuals in the 0.3–0.5 keV energy range (Fig. 6) are suggestive of an absorption edge, the size of the instrumental systematic errors at these energies (Orr et al. 1998) does not permit a search for the presence of an additional, possibly ionized, absorber. The unabsorbed 0.1–2.0 keV flux of the blackbody plus power–law model is 9.4 10-11 erg cm-2 s-1, corresponding to a luminosity of 2.6 1044 erg s-1.
| model | (1020 cm-2) | (eV) | /d.o.f. | |
|---|---|---|---|---|
| BB+PO | 5.20.2 | 1597 | 2.400.03 | 272.6/262 |
| DISKBB+PO | 5.60.3 | 21012 | 2.390.04 | 279.9/262 |
| MEKAL+PO | 5.90.3 | 380 | 2.370.05 | 283/261 |
5 Comparison with ASCA results
The line–like feature around 1 keV, originally discovered by ASCA, was successfully modelled by a power law continuum plus a Gaussian emission line (TGN99) or by an ionized reflection model plus an O VIII recombination edge at 0.87 keV (V99). In order to compare the BeppoSAX data with the ASCA observations, the same models were fitted to the LECS plus MECS spectra.
The power law plus Gaussian line model returns an acceptable fit only for very high values of the line width ( 0.6 or even larger), leaving the line energy basically unconstrained. The profile of such a broad Gaussian line is equivalent to a blackbody continuum absorbed at low energy by the Galactic column density.
The addition of an O VIII recombination edge (model REDGE in XSPEC) improves the statistical quality of the power–law plus ionized reflection fit. The best–fit values for the plasma temperature ( 9 105 K which is consistent with the assumed disc temperature of 106 K) and the O VIII recombination feature EW ( 90 eV) are in agreement with the V99 results. However, systematic residuals are left below 0.8 keV, suggesting that the recombination feature is too narrow to fully account for the shape of the soft X–ray spectrum.
We conclude that a single power law modified by warm/hot absorption and reflection features does not adequately represent the broad–band spectrum, and especially the soft X–ray spectral shape, of Ark 564 as observed by BeppoSAX.
The discrepancy with the ASCA results is likely to be due to both the different energy resolutions and spectral coverages of the detectors onboard ASCA and BeppoSAX. In order to check whether the relatively weak emission line detected by ASCA could have been missed by the BeppoSAX LECS, a simulated 100 ks BeppoSAX observation of Ark 564 was produced with the best–fit ASCA parameters quoted by TGN99. We found that the simulated spectrum could be described well by a double blackbody plus power–law model, indicating that weak soft X–ray emission features can be only marginally studied with BeppoSAX. On the other hand, the lack of sensitivity of the ASCA instruments below 0.6 keV coupled with the calibration uncertainties at these energies prevents a detailed modelling of the soft X–ray continuum and of the strength of any emission/absorption feature. An emission line at 1 keV is still statistically required if the ASCA spectrum is fitted with a blackbody plus power law model; however, the derived line EW is lower than that obtained without a blackbody component (see Sect. 6).
A further discrepancy between the BeppoSAX and ASCA results concerns the best–fit energy of the iron emission line, which is consistent with a neutral origin in the ASCA data. Moreover, while TGN99 find evidence for a strong (EW 500 eV) line with a broad and asymmetric profile, in the V99 analysis the emission feature is best fitted with a much weaker (EW 100 eV) and narrow Gaussian. It is plausible that the different energy resolution and sensitivities of the detectors onboard ASCA and BeppoSAX coupled with the different prescriptions for the underlying continuum might account for part of this discrepancy.
6 Discussion
The X–ray spectral properties of Ark 564 as observed by BeppoSAX fit fairly well with the leading hypothesis of a higher accretion rate, relative to the Eddington value, and of a smaller black hole mass in NLS1 with respect to broad–line Seyfert 1 nuclei (e.g. Pounds et al. 1995; Boller et al. 1996; Laor et al. 1997). The steep soft excess, best fitted with the high–energy tail of a hot thermal component, is explained by a shift of the accretion disc spectrum in the soft X–ray band. The strong flux of soft photons could lead to a strong Compton cooling of the coronal electrons and thus to a steep hard tail. In some models the disc surface layers become strongly ionized when the accretion rate approaches the Eddington limit which fits nicely with the detection of ionized iron features.
The reprocessing features originating in a highly ionized disc have been studied by Matt et al. (1993, 1996) and, more recently, by Ross et al. (1999) and Nayakshin et al. (2000). The intensities of the iron K features as measured by BeppoSAX are in relatively good agreement with the model predictions for an ionization parameter 104 erg cm s-1 (compare Table 4). The best–fit values for the K edge energy and optical depth are also consistent, within the errors, with the ASCA plus RXTE observation (V99), lending further support to the ionized reprocessor scenario. As discussed by Ross et al. (1999), the PEXRIV model in XSPEC provides only a first approximation to the spectral shape of an ionized reflector. Unfortunately, the quality of the present data and the lack of MECS response above 10 keV does not allow testing of more detailed models.
The increased reflectivity of the ionized accretion disk at low energies cannot completely account for the strong soft excess in the BeppoSAX data. An important consequence of the need for primary soft excess emission is that the intensity and the origin of the 1 keV soft X–ray feature discovered by ASCA must probably be reconsidered. Even though there is no convincing evidence of such a feature in the BeppoSAX data, we cannot completely rule out this possibility. We argue that the soft X–ray line intensity cannot be as strong as claimed by TGN99 and V99. Indeed, when fitting the ASCA data with a blackbody plus power law model, a 1 keV line is still required. The model dependent EW (20–50 eV) is lower than the best fit value reported by TGN99 of 70 eV and more similar to the best fit value of 29 eV reported by Leighly (1999b) from an independent analysis of the same ASCA data. As discussed by TGN99, a strong soft X–ray line can be only marginally reproduced by emission from a warm/hot gas. Emission models computed for a wide range of column densities, ionization states, covering factors and iron abundances indicate that the largest EWs are of the order of 20–30 eV. These results highlight the importance of a robust measurement of the underlying continuum shape for a better understanding of the origin of soft X–ray features in NLS1. In conclusion, the soft X–ray spectrum of Ark 564 remains far from being unambiguously and convincingly explained. Better quality spectra, which will be obtained by the already scheduled Chandra and XMM–Newton observations, are needed to settle this still controversial issue.
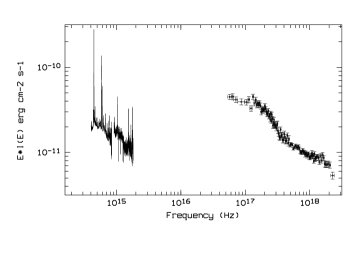
The non–simultaneous optical, UV and X–ray spectral energy distribution (SED) is shown in Fig. 7. The UV data were retrieved from the HST archive using XSTARVIEW and have been calibrated by the standard pipeline. They agree relatively well with those presented in Crenshaw et al. (1999) and with the blueward extrapolation of the optical data. A more detailed discussion of the full UV data set is beyond the scope of this paper. The flattening of the steep soft X–ray spectrum towards the lowest accessible X–ray energies suggests that the energy density peaks in the soft X–ray band with a behaviour similar to that observed in RE J1034+393 (Puchnarewicz et al. 2000). The lack of variability and the simultaneity of the RE J1034+393 optical–UV and X–ray data allowed spectral fits with accretion disc models. The preferred interpretation was a nearly edge–on accretion disc accreting at 0.3–0.7 LEdd onto a low mass black hole (M a few 106 M⊙). It is likely that a similar set of parameters for the black hole mass and accretion rate are responsible for the Ark 564 optical to X–ray spectrum. However, given the large–amplitude variability and the lack of simultaneous multifrequency observations, no attempt has been made to fit the observed SED with a disk model.
It is interesting to compare the Ark 564 and RE J1034+393 SED with that of Ton S 180 (paper I): the 3 NLS1 in the BeppoSAX core programme for which optical data are available. The Ton S 180 optical to X–ray spectrum (Fig. 5 in paper I) peaks somewhere at longer wavelengths; as a consequence, the bulk of the energy density is emitted in the optical–UV band. Indeed the shape of the soft–excess component of Ton S 180 is best fitted by a steep power law while the soft X–ray components in Ark 564 and RE J1034+393 show a low–energy downwards curvature characteristic of thermal blackbody–like spectra.
On the other hand, the 3 objects have similar high energy properties such as steep 2–10 keV spectra and ionized iron features (though in RE J 1034+393 only a marginal detection has been reported; Pounds et al. 1995) suggesting that the high–energy spectrum is independent of the peak of the overall energy output. It is worth noting that the SED peak seems to be correlated with the intensity of optical Fe ii multiplets which are particularly strong in Ton S 180. Further X–ray observations and coordinated optical–UV campaigns are needed to clarify some of these issues.
7 Conclusions
We have analysed BeppoSAX data and a high-quality optical spectrum of the bright Narrow-Line Seyfert 1 galaxy Ark 564. Our main results are the following:
The optical emission–line intensities and widths clearly confirm the NLS1 nature of Ark 564. The Fe ii multiplets are not particularly strong and are similar to those of normal Seyfert 1 galaxies.
The evidence for soft X–ray spectral features is marginal if the strong and possibly complex soft X–ray excess is modelled with a blackbody or a multicolour accretion disc spectrum.
The spectrum hardens at high energies though the power law photon index is rather steep and significantly steeper than the average value measured in broad line Seyfert 1 galaxies.
The high–energy iron K spectral features (the 6.8 keV line and the 9.5 keV edge) strongly suggest reflection from a highly ionized, optically thick accretion disc.
The optical to X–ray spectral energy distribution peaks in the soft X–ray band with a behaviour similar to that observed in RE J1034+393. A rapidly accreting, low mass black hole provides the most likely interpretation of the broad band observations.
Acknowledgements.
We thank all the people who, at all levels, have made the SAX mission possible. This research made use of SAXDAS linearized and cleaned event files (Rev.2.0) produced at the BeppoSAX Science Data Center. Partial support from the Italian Space Agency under the contract ASI–ARS–98–119, by the Italian Ministry for University and Research (MURST) under grant Cofin–98–02–32 and by the NASA Long Term Space Astrophysics grants NAG5–8107 and NAG5–7971 is acknowledged.References
- (1) Boella G., Butler R.C., Perola G.C., et al., 1997a, A&AS 122, 299
- (2) Boella G., Chiappetti L., Conti G., et al., 1997b, A&AS 122, 327
- (3) Boller T., Brandt W.N, Fink H.H., 1996, A&A 305, 53
- (4) Boller T., Brandt W.N, Fabian A.C., Fink H.H., 1997, MNRAS 289, 393
- (5) Brandt W.N., Fabian A.C., Nandra K., Reynolds C.S., Brinkmann W., 1994, MNRAS 271, 958
- (6) Brandt W.N., Mathur S., Elvis M., 1997, MNRAS 285, 25
- (7) Comastri A., Fiore F., Guainazzi M., et al. 1998, A&A 333, 31
- (8) Crenshaw D.M., Kraemer S.B., Boggess A., et al. 1999, ApJ 516, 750
- (9) Dickey J.M., Lockman F.J., 1990, ARA&A 28, 215
- (10) Elvis M., Lockman F.J., Fassnacht C., 1994, ApJS 95, 413
- (11) Fiore F., Laor A., Elvis M., Nicastro F., Giallongo E., 1998, ApJ 503, 607
-
(12)
Fiore F., Guainazzi M., Grandi P., 1999, Handbook for
BeppoSAX NFI spectral analysis
ftp://www.sdc.asi.it/pub/sax/doc/software_docs/saxabc_v1.2.ps.gz - (13) Frontera F., Costa E., Dal Fiume D., et al. 1997, A&AS 122, 357
- (14) Guainazzi M., Matteuzzi A., 1997 SAX/SDC Technical Report
- (15) Joly M., 1988, A&A 192, 87
- (16) Laor A., Fiore F., Elvis M., et al., 1997, ApJ 477, 93
- (17) Leighly K.M., 1999a, ApJS 125, 297
- (18) Leighly K.M., 1999b, ApJS 125, 317
- (19) Magdziarz P., Zdziarski A.A., 1995, MNRAS 273, 837
- (20) Manzo G., Giarrusso S., Santangelo A. et al. 1997, A&AS 122, 341
- (21) Matt G., Fabian A.C., Ross R.R., 1993, MNRAS 262, 179
- (22) Matt G., Fabian A.C., Ross R.R., 1996, MNRAS 278, 1111
- (23) Nayakshin S., Kazanas D., Kallman T.R., 2000, ApJ 537, 833
- (24) Orr A., Parmar A.N., Yaqoob T., Guainazzi M., 1998 Nuclear Physics B (Proc. Suppl.) 69/1–3, 496
- (25) Parmar, A.N., Martin D.D.E., Bavdaz M., et al. 1997, A&AS 122, 309
- (26) Pounds K.A., Done C., Osborne J.P, 1995, MNRAS 277, L5
- (27) Puchnarewicz E.M., Mason K.O., Siemiginowska A., et al. 2000, ApJ in press
- (28) Ross, R.R., Fabian A.C., Young A.J., 1999, MNRAS 306, 461
- (29) Turner T.J., George I.M., Nandra K., 1998, ApJ 508, 648
- (30) Turner T.J., George I.M., Nandra K., Turcan D., 1999a, ApJ 524, 667
- (31) Turner T.J., George I.M., Netzer H. 1999b, ApJ 526, 52 (TGN99)
- (32) Vaughan S., Reeves J., Warwick R., Edelson R. 1999a, MNRAS 309, 113
- (33) Vaughan S., Pounds K.A., Reeves J., Warwick R., Edelson R. 1999b, MNRAS 308, L34 (V99)