Chandra Observation of M84, Radio Lobe Elliptical in Virgo cluster.
Abstract
We analyzed a deep Chandra observation of M84, a bright elliptical galaxy in the core of the Virgo cluster. We find that the spatial distribution of the soft X-ray emission is defined by the radio structure of the galaxy. In particular we find two low density regions associated with the radio lobes and surrounded by higher density X-ray filaments. In addition to a central AGN and a population of galactic sources, we find a diffuse hard source filling the central 10 kpc region. Since the morphology of the hard source appears round and is different from that seen in the radio or in soft X-rays, we propose that it is hot gas heated by the central AGN. Finally, we find that the central elemental abundance in the X-ray gas is comparable to that measured optically.
Subject headings:
Galaxies: abundances — galaxies: elliptical and lenticular — galaxies individual: NGC4374 — galaxies: intragalactic medium — X-Rays: galaxies1. Introduction
M84 (NGC4374) is an E1 galaxy within the core of the Virgo cluster. Radio observations at 1.4 and 4.9 GHz show two lobes and a jet (Laing & Bridle 1987). In X-rays, the galaxy has a compact gas halo, rather low metallicity and an overabundance of alpha-process elements (e.g. Finoguenov & Jones 2000).
In this Letter we discuss primarily the comparison of the X-ray and radio morphologies. We also determine the temperature and abundance structures in the galaxy center, which allows a direct comparison with optical abundance measurements. Finally, we resolve the nature of the hard X-ray component, found by ASCA in many ellipticals (Matsumoto et al. 1997).
2. Observation and data reduction
A Chandra ACIS-S observation of M84 was made on 2000, May 19. After removing time intervals with high X-ray background, the useful exposure was 28.7 ksec. Gain corrections were made using CIAO v1.1.1 software. Response matrices were generated for the focal plane temperature of -120∘C and position averaged, according to the source location. Since the galaxy is embedded in diffuse X-ray emission from the Virgo cluster, we calculated the background from a region on the detector far from M84. We take the distance to M84 as 17 Mpc, so 1′′ corresponds to 82 pc.
3. Diffuse X-ray emission in M84
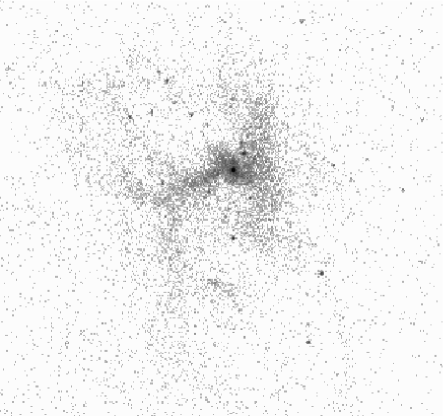
Instead of appearing round, the bright extended X-ray emission from M84, shown in Fig.1, has an -shape, characterized by a bar extending east from the center and several almost parallel filaments extending approximately perpendicular to this bar.
A clue towards understanding this peculiar X-ray morphology comes from a comparison with the radio structure. Two radio lobes extend North and South from the source’s center. X-ray emitting gas surrounds the radio lobes. As discussed in Sec.4, the temperature of the X-ray filaments is 0.6–0.7 keV, similar to that at the galaxy center and slightly colder than the more extended X-ray emission, seen on scales up to 25 kpc. Apparently, expansion of the radio lobes has caused the hot gas to have the -shaped structure. However, as will be shown in Sec.4, the temperature of the filaments surrounding the radio lobes is not very different from the temperature found for the central and outer region of the source. Thus, we conclude that the lobes are not overpressured and therefore are not capable of driving a strong shock into the ambient material. This interpretation is similar to that for Hydra-A (McNamara et al. 2000).
We can use the density () of the hot gas surrounding the radio lobes, determined from X-ray observations combined with radio measurements of the Faraday rotation () to directly determine the strength of the magnetic field () (e.g. Laing & Bridle 1987).
To determine the magnetic field strength we extracted radial profile of the X-ray surface brightness around the geometrical center of the southern radio lobe to model the 3-d density profile (see Fig.3). We model this with a -model, modified by setting the density to zero inside some radius, so the emission detected inside this radius is only due to the projection effects. Using the results of this modeling, we estimate the integrated electron density to be cm-3 kpc, which, for a Faraday rotation of 25 rad m-2, requires the line-of-sight magnetic field strength to be 0.8 , well below the equipartition value of 20 (Laing & Bridle 1987). Thus, the magnetic field associated with the X-ray plasma appears much weaker then the field in the radio lobe. This method, however, has certain limitations, since on one hand, it sets an upper limit on the magnetic field, due to the possible presence of plasma between the source and the observer, and on the other hand, there is an open question of which scale size of the magnetic field reversals is most responsible for the observed RM and whether this scale is characteristic of the strength of the magnetic field.
![[Uncaptioned image]](/html/astro-ph/0010450/assets/x3.png)
Radial X-ray surface brightness profile (in counts per pixel, pixel size is ) around the southern radio lobe. A point at 10 kpc indicates the background level. A dashed histogram shows the best fit for a spherical shell of gas.
The radio and X-ray morphologies suggest that M84 is moving in the core of the Virgo cluster. In particular the northern edge of the north radio lobe appears compressed and, as shown on the right of Fig.1, although the faint X-ray emission has a more regular shape, it is extended towards the south. Both the X-ray extension and radio structure suggest motion through the Virgo cluster towards the north-north-west in the observed plane. We also note that the radio jet, seen in the southern lobe, points to a cloudlet of X-ray emission 3.3 kpc (40′′) from the center, which could be compressed plasma swept up by the jet.
4. Temperature and Heavy Element Abundances
Spectra for different regions of M84 are presented in Fig.4. In our spectral modeling of thermal emission from M84, we use the MEKAL model (Mewe et al. 1985, Mewe and Kaastra 1995, Liedahl et al. 1995). Unless noted otherwise, we found the Galactic absorption column of cm-2 (Stark et al. 1992). Errors are given on the 68% confidence level. We determined abundances for O, Mg, Si and Fe. In deriving the abundances, we use the solar abundance table from Anders & Grevesse (1989), where elemental number abundances for O, Mg, Si, Fe relative to hydrogen are (85.1, 3.8, 3.55, 4.68). We chose the energy interval 0.6–7 keV for spectral analysis. We masked out the point sources when extracting the spectra of the extended emission and in spectral fitting allowed for the presence of the hard X-ray emission. We detect little variation in the temperature ( keV) for the different parts of the -shaped emission with the east part slightly hotter and the south-east filament hotter by 0.1 keV. In the diffuse emission, if we fit both hard and soft components, the temperature of the soft component rises from 0.6 keV at the center to 0.8 keV at 5′ radii.
We specify four zones, where we determine the abundances of heavy elements: the inner 6′′ (0.5 kpc), the eastern and western parts of -shaped diffuse emission and the faint X-ray halo, extending from 2′ to 5′. In Fig.4 we plot the results for the -shaped emission from 6′′ to 1′ (east) and from 1′ to 2′ (west). The abundance determination is sensitive to the background subtraction and is less reliable for the faint X-ray halo. Among elements, Si abundance is most strongly affected, while the Mg abundance is the most robust.
The -shaped region contributes most of the diffuse X-ray emission and thus provides the tightest constraints on measurements of the elemental abundance. The Fe abundance is highest in the -shaped diffuse emission and highest in the eastern part. The Fe abundance in -shaped region is well in excess of -0.35 dex., found in optical studies (Kobayashi & Arimoto 1999), allowing for additional gas enrichment from SN Ia. The Mg/Fe ratio shows a trend toward an overabundance of alpha-process elements at low metallicities. In the faint X-ray halo, low-metallicity inhibition of the SN Ia rate is needed to explain the low Fe abundance. Low Fe abundance in the center could be an artifact, due to the possible presence of additional emission components, e.g. X-ray scattering of AGN emission on the galactic dust. Our findings demonstrate that the previously reported disagreement between X-ray and optical abundance estimates was due to their different spatial scales of measurements.
![[Uncaptioned image]](/html/astro-ph/0010450/assets/x4.png)
Spectral characteristics for regions of M84, representing from bottom to top, combined point sources (dashed line), the central AGN (in grey), central diffuse emission, -shaped region, outer faint X-ray emission.
![[Uncaptioned image]](/html/astro-ph/0010450/assets/x5.png)
Radial distribution of temperature and heavy element abundances in M84. Among -process elements we plot Mg (in grey), Si (in solid black) and O (in dotted black).
5. Origin of the Hard Component
A hard X-ray component in elliptical galaxies has been found in many ASCA observations (e.g. Matsumoto et al. 1997) with spectral characteristics corresponding to a 6.5 keV bremsstrahlung temperature. Three origins have been proposed to explain the hard component. First – LMXB (Matsumoto et al. 1997), second – AGN (e.g. Finoguenov & Jones 2000) and third – the presence of relativistic particles, contained by a magnetic field, introduced by Fukazawa et al. (2000) to explain the hard component seen in groups of galaxies. Chandra’s subarcsecond resolution allows us to distinguish among these three possibilities, since the first is an ensemble of discrete sources, the second is a point source in the galaxy center and the third is a diffuse source.
![[Uncaptioned image]](/html/astro-ph/0010450/assets/x6.png)
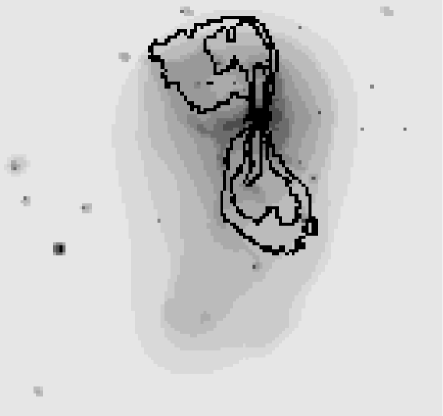
Wavelet-decomposition of M84 image at 2.5–7.0 keV energy band. In contrast to the soft image, the hard emission does not reveal the -shape, instead is spherically symmetric, extending to 3.5 kpc radius from the center. At the source center, emission exhibits a distinct bar pointed to the north-west. A 20′′ scale bar, shown on the image, corresponds to 1.6 kpc.
Fig.5 shows the 2.5–7 keV emission. In this hard band, in 28.7 ksec, the diffuse emission provides 240 counts, the central point source 100 counts, with 167 counts from detected point sources.
The central X-ray point source is coincident with the position of the radio nucleus. Its spectrum is an absorbed ( cm-2) power law () and its luminosity is ergs/sec in the 0.5–10 keV band. The integrated spectrum of the combined emission from point sources is characterized by a bremsstrahlung temperature of 13 (9–22) keV or a power law index 1.41 (1.34–1.48). Their total luminosity in the 0.5–10. keV band is ergs/s, yielding an ratio similar to M31 (Makishima et al. 1989).
To estimate the contribution of point sources below our detection limit, we study the point source distribution in the 0.4–5.0 keV band, using the central kpc2 region. A fit to the source counts distribution, excluding the first and the last bin of the histogram shown in Fig.5, gives . Assuming no break at lower source fluxes, we estimate an additional 1/3 of the point source flux in undetected sources. Thus, point sources cannot explain the hard diffuse emission in M84. We note that at our point source sensitivity limit (10 cnts detected in the 0.4–10. keV band correspond to erg cm-2 s-1 in the 0.5–2 keV band for the average slope found for bright background sources of ), using the log N–log S determination by Giacconi et al. (2000), 3 of the 50 sources we detect should be background; one identified quasar is omitted from the source list.
The diffuse hard component extends to kpc from the galaxy center. For spectral estimates, however, we take the central bright 3.1 kpc radius, where the uncertainty in the background subtraction is less important. In the spectral analysis, we also fit the soft diffuse component. The hard X-ray component can be satisfactory described by a thermal plasma of 3.9 (2–11) keV giving a luminosity of ergs/sec in the 0.5–10 keV band. A power law fit to the hard diffuse component gives of .
Fukazawa et al. (2000) suggested that hard diffuse emission is due to the Inverse Compton Scattering of CMB photons on relativistic electrons. Alternatively, they suggested a non-thermal bremsstrahlung between thermal gas and high energy particles. Both these scenarios have difficulties explaining the observed shape of the diffuse emission in M84, since the hard X-ray emission should correlate well with the radio emission in the first scenario (e.g. Sarazin 1988), and with the soft X-ray emission in the second. Both radio and soft X-ray morphologies are well defined and do not correlate with the hard X-ray component. However, as we noted earlier, the magnetic field strength outside the radio lobes is 25 times lower, which implies a reduction in the synchrotron emission by almost three orders of magnitude. Therefore, to explain a mismatch between the radio and hard X-ray diffuse emission, energetic electrons with estimated must be distributed similar to the X-ray emission. Thus, differences in X-ray and radio morphology could be due to the change in the magnetic field strength. The electrons, required for this scenario would have life-times of yr, so their supply is not a problem (Fukazawa et al. 2000).
As an alternative to an Inverse Compton origin, we suggest that the hard diffuse X-ray emission is due to AGN-inflated gas in the center of the galaxy. In order for this suggestion to hold, several requirements must be met. First, in order for the hot gas to be convectively stable (e.g. Sarazin 1988), the entropy of the hot gas should not exceed the entropy of the faint diffuse halo. The latter has an entropy of keV cm2 (ignoring constants and logarithms). For the measured density of the hard component, this requires that the temperature be less then 4.6 keV, consistent with that measured 3.9 (2–11) keV. Hotter temperatures are allowed closer than 0.8 kpc from the center, where the gas density is higher. The second requirement is that the gas be in pressure equilibrium in the gravitational field of M84. In fact, we would expect there to be a hole at the center of the soft emission, which in M84 is masked by the complex structure in the central region. The spatial distribution of the hard component is characterized by a -model with , kpc. Assuming an isothermal temperature of 3 keV, the total gravitational mass within 3.1 kpc is . Using the cooler gas component (, kpc) at larger radii, we find within 10 kpc. For a total blue luminosity of and effective radius of 5 kpc (Kobayashi & Arimoto 1999), both mass estimates correspond to a ratio of 20. This is similar to Brighenti & Mathews (1998) result of constant in ellipticals over a large range of radii. This is consistent with the assumption that the gas is in pressure equilibrium. Finally, the total energy of the hot component is ergs, which requires a heat input of ergs/s for 0.1 Gyr. Future X-ray observations can test this suggestion through a more precise temperature determination and the detection of Fe K-shell lines.
![[Uncaptioned image]](/html/astro-ph/0010450/assets/x7.png)
of the point source counts in 0.4–5.0 keV energy band, using the central kpc2 region (solid histogram). Dashed line shows the best fit. Given the duration of the observation and a source spectral shape, 1 cnt on this plot corresponds to ergs/sec luminosity in 0.4–10. keV.
In the proposed scenario, the cooler X-ray emitting filaments surrounding the radio-lobes will tend to fall toward the center, due to their lower entropy, but are repelled by the pressure in the radio-lobes, which apparently has little impact on the diffuse hot X-ray gas. Thus, for the cool component of the X-ray emission, the radio source works as a fountain, lifting up the infalling gas.
6. Conclusions
The high resolution Chandra image shows the remarkable interaction of the radio lobes and the diffuse soft X-ray emission. The expansion of the radio lobes appears to have created cavities in the soft emission that are surrounded by higher density shells. Based on the similarities in the temperature and abundance of the filaments around the radio lobes and the gas in the central region, we suggest that this gas has a common origin and circulates throughout the central region of the galaxy. Chandra’s high resolution also has led to the detection of a population of luminous ( ergs/sec) galactic X-ray sources and the discovery of a hard, diffuse source in the central 10 kpc. We suggest that the AGN at the center of M84 heats the gas in this region. Future observations of M84 and other galaxies can test this prediction. Finally, Chandra’s resolution allowed abundance measurements to be made on a spatial scale similar to those done optically, resolving the issue of low reported abundances for the X-ray gas, compared to optical studies.
The authors are thankful to Alexey Vikhlinin and Maxim Markevitch for their help in Chandra data reduction, and to Dan Harris, Yasushi Fukazawa, Brian McNamara and the referee for useful comments on the manuscript. This work was supported by NASA grants GO0-1045X and AG5-3064 and the Smithsonian Institution.
References
- (1) Anders E. and Grevesse N. 1989, Geochimica et Cosmochimica Acta, 53, 197
- (2) Brighenti F., Mathews W. G. 1998, ApJ, 495, 239
- (3) Finoguenov A. and Jones C., 2000, ApJ, 539, 603
- (4) Fukazawa Y. et al. , 2000, ApJ, subm.
- (5) Giacconi R., Rosati P., Tozzi P., Nonino M., Hasinger G. et al. , 2000, ApJ accepted, (astro-ph/0007240)
- (6) Kobayashi C., Arimoto N., 1999, ApJ, 527, 573
- (7) Laing R.A. and Bridle A.H. 1987, MNRAS, 228, 557
- (8) Liedahl D.A., Osterheld A.L. and Goldstein W.H. 1995, ApJ (Letters), 438, L115
- (9) Makishima K., Ohashi T., Hayashida K., Inoue H., Koyama K. et al. , 1989, PASJ, 41, 697
- (10) Matsumoto H., Koyama K., Awaki H., Tsuru T., Loewenstein M. and Matsushita K. 1997, ApJ, 482, 133
- (11) McNamarra B.R., Wise M., Nulsen P.E.J., David L.P., Sarazin C.L. et al. , 2000, ApJ, 534L, 135
- (12) Mewe R., Gronenschild E.H.B.M. and Oord G.H.J. 1985, A&A (Supplement Series), 62, 197
- (13) Mewe R. & Kaastra J. 1995, Internal SRON-Leiden report
- (14) Sarazin C.L., 1988, ”X-ray emission from clusters of galaxies”, Cambridge University Press
- (15) Stark A., Gammie C., Wilson R., Bally J., Linke R. et al. 1992, ApJ (Supplement Series), 79, 77