The NGC4839 group falling into the Coma cluster observed by XMM-Newton ††thanks: Based on observations obtained with XMM-Newton, an ESA science mission with instruments and contributions directly funded by ESA Member States and the USA (NASA) ,††thanks: EPIC was developed by the EPIC Consortium led by the Principal Investigator, Dr. M. J. L. Turner. The consortium comprises the following Institutes: University of Leicester, University of Birmingham, (UK); CEA/Saclay, IAS Orsay, CESR Toulouse, (France); IAAP Tuebingen, MPE Garching,(Germany); IFC Milan, ITESRE Bologna, IAUP Palermo, Italy. EPIC is funded by: PPARC, CEA, CNES, DLR and ASI
Abstract
We present here the first analysis of the XMM Newton EPIC-MOS data of the galaxy group around NGC4839, which lies at a projected distance to the Coma cluster center of 1.6 Mpc. In our analysis, which includes imaging, spectro-imaging and spectroscopy we find compelling evidence for the sub group being on its first infall onto the Coma cluster. The complex temperature structure around NGC 4839 is consistent with simulations of galaxies falling into a cluster environment. We see indications of a bow shock and of ram pressure stripping around NGC4839. Furthermore our data reveal a displacement between NGC4839 and the center of the hot gas in the group of about 300 kpc. With a simple approximation we can explain this displacement by the pressure force originating from the infall, which acts much stronger on the group gas than on the galaxies.
Key Words.:
Galaxies: clusters: general – intergalactic medium, general – Cosmology: observations – large-scale structure of the Universe – X-rays: general1 Introduction
There is now compelling evidence from studies in different wavelength bands that the Coma cluster has substructure. The search for substructure in the Coma cluster starts more than a decade ago: Fitchett & Webster (fitchett (1987)) find a double structure in the cluster center, and Mellier et al. (mellier (1988)) find a second peak in the large scale galaxy distribution around NGC4839, which was further confirmed in a study by Merritt & Tremblay (merritt (1994)). While these studies were based on optical data, Briel et al. (briel1 (1992)) using X-ray data coming from the all-sky-survey of the ROSAT satellite, found substructures coinciding with NGC4911, and again, NGC4839. Another study by White et al. (white (1993)) based on a deeper ROSAT observation revealed even more structure. In this paper we concentrate on the XMM-Newton (Jansen et al. jansen (2001)) observation of the sub group around NGC4839, which has a projected distance from the Coma cluster of 1.6 Mpc. In section 2 we review briefly the observation and data treatment of the EPIC data (see Turner et al. turner (2001)). This is followed by Sections dealing with imaging and spectro-imaging. In section 5 we perform a spectroscopic analysis in different regions which is followed by discussion and conclusion. This paper is one of three papers which present XMM-Newton data on the Coma cluster (see also Arnaud et al. 2001a ; Briel et al. briel2 (2001)).
Throughout this paper, we assume km s-1 Mpc-1 and . At a redshift of , corresponds to 38.9 kpc.
2 Observations
The subgroup associated with NGC4839 was observed for 36 ksec with XMM-Newton in full frame mode with the medium filter. Due to remaining problems with the CTI (Charge Transfer Inefficiency) calibration in the extended full frame mode of the PN camera we concentrate in this paper on the data from the EPIC-MOS1 and EPIC-MOS2 cameras. The background intensity of the instruments varies considerably with time over several orders of magnitude. In order to optimize the signal-to-noise of the observation we reject time intervals with high background count rates. For this selection we binned the counts in the energy band 10-12 keV in time intervals of 100 sec. In this energy band we hardly detect any astrophysical sources, due to the very small effective area of the mirrors. We reject time bins with more than 15 counts per 100 sec. After this selection we obtain exposure times with 30.6 ksec for EPIC-MOS1 and 30.9 ksec for EPIC-MOS2.
3 Imaging
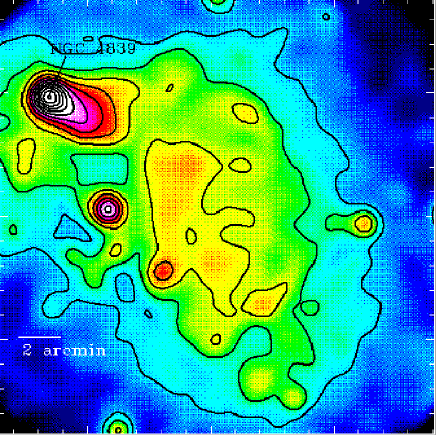
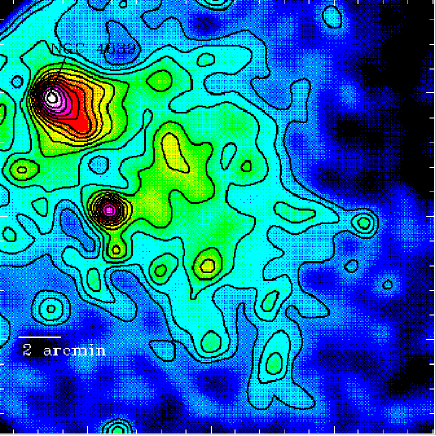
Fig.1 and Fig.2 display the images obtained in the band 0.5-2.0 keV and 2.0-5.0 keV, respectively. The band 5.0-10.0 keV is dominated by the particle background. As already observed with ROSAT (Briel et al. briel1 (1992); White et al. white (1993); Dow & White dow (1995)) we see a tail-like structure around NGC4839 pointing away from the Coma cluster. The orientation of NGC4839 in the optical coincides with the orientation of the tail. The X-ray emission of NGC4839 seems somewhat disconnected to the diffuse X-ray emission coming from the group in the center of the pointing.
4 Spectro-imaging
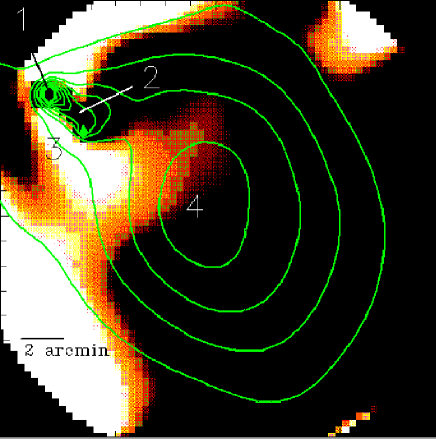
In order to look for spectral variations we calculated a hardness ratio image of the data (see Fig.3). To account for the background, especially the particle background, we used another Coma pointing with the central coordinates of RA=13h01min37sec Dec=27d19m52s (J2000), which is situated South-East of the Coma cluster at roughly the same offset angle than the sub-group. (46 arcmin in comparison to 51 arcmin for the subgroup pointing). We orientate this background pointing in such a way that it accounts for the emission of Coma itself plus stray light in the pointing for NGC4839. However, this rotation has no measurable effect on the hardness ratio image, the features with or without this rotation rest identical. This indicates that the background we measure is dominated by particles.
As we are not interested here in the emission of different point sources but only in spectral differences of the extended X-ray emission we use a wavelet algorithm (the MVM algorithm Rué & Bijaoui rue (1997)) to filter out point-like structures for the hardness ratio images. Our hardness ratio image is calculated as hr = (image(2-5 keV)-image(0.5-2.0 keV))/ (image(2-5 keV)+image(0.5-2.0 keV)).
We do not take into account any vignetting effects in the hardness ratio image since we know from calibrations that the vignetting functions are parallel to each other for energies below 5 keV.
The resulting image is shown in Fig.3. We can see that there are indeed spectral variations across the field-of-view. Around NGC4839 we see that the tail-like structure has a different colour (is softer) than the regions North or South surrounding it (the tail has a mean hardness ratio of hr). The region, which shows a harder spectrum in the South (hr) seems also to have a tail-like structure, which is parallel to the tail seen in the original image. The core of NGC4839 shows hr
The appearance of a region with hard spectrum in the South-East or North, at the border of the hardness ratio image is not statistically significant. We cannot state with certainty that these regions are hotter due to an interaction of the group with the intracluster medium (herafter ICM) of the Coma cluster. These “hot” regions are not unlikely to be an artifact which is created by low photon statistics together with remaining stray light.
5 Spectroscopy
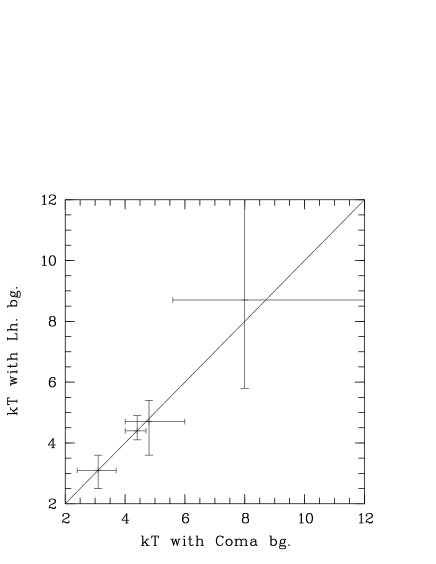
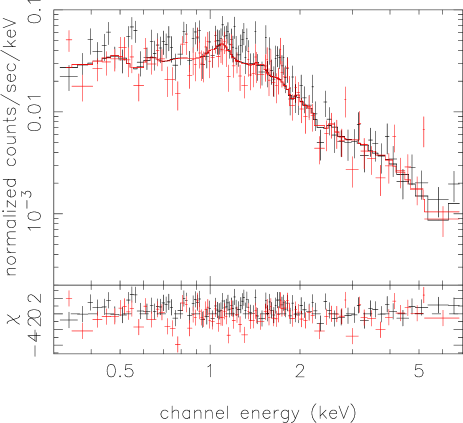
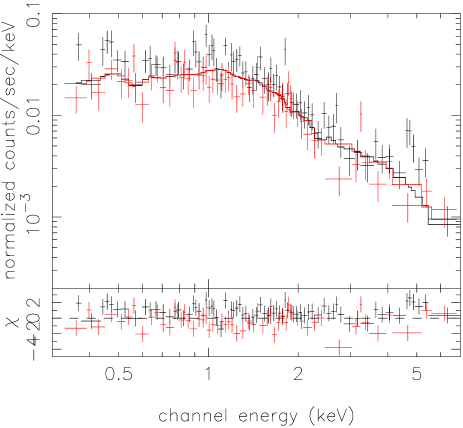
For our spectral analysis we selected different regions in the pointing, which show spectral differences in the hardness ratio image. In our spectral analysis we restrict ourselves to the energy range between 0.3–10.0 keV. The summary of the spectral fitting is given in Tab.1. The position and extraction regions are displayed in Tab.2. The spectra for some of the regions are shown in Fig.5. For the spectral fitting we used XSPEC (Arnaud arnaudk (1996)) and the MEKAL code (Mewe et al. mewe1 (1985); Mewe et al. mewe2 (1986); Kaastra kaastra (1992); Liedahl et al. liedahl (1995)). The galactic absorption was fixed to the value of the 21cm line (cm-2 – Dickey & Lockman dickey (1990)). For the background spectrum determination we used the observations performed on the Coma background pointing (see above). In order to take into account instrumental variations across the field-of-view we selected for the background the same regions on the detector than for the source spectra. As the particle contribution is somewhat detector dependent, it is better to take the same regions on the detector rather than the regions corresponding to the Coma emission (the orientated regions, like for the hardness ratio image), since our background is highly dominated by particles and not by cluster emission/stray light. In order to estimate the influence of background variations we also used the observations of the Lockman hole as background. For EPIC-MOS1 we used the Lockman hole observations with the thin filter, which is not entirely consistent, since all Coma pointings were observed with the medium filter. However, this will give us an estimate on the intrinsic variations of the background. The comparison of the best fit temperature estimates are shown in Fig.4. As one can see, the temperatures are very similar.
To account for vignetting we used the approach described in Arnaud et al. (2001b ).
 |
 |
| Region | description | metal | red. | ||
|---|---|---|---|---|---|
| Abund. | |||||
| 1 | core of | 0.82 | |||
| NGC4839 | |||||
| 2 | tail of | 0.99 | |||
| NGC 4839 | |||||
| 3 | region south | 0.69 | |||
| of tail | |||||
| 4 | main body of | 0.87 | |||
| sub group |
| region | center R. A. | center Dec. | radius |
|---|---|---|---|
| (h:min:sec) | (deg:arcmin:arcsec) | in arcsec | |
| 1 | 12:57:24 | 27:29:54 | 40 |
| 2 | 12:57:17 | 27:29:37 | 53 |
| 12:57:08 | 27:29:06 | 65 | |
| 3 | 12:57:23 | 27:27:50 | 68 |
| 12:57:15 | 27:26:49 | 63 | |
| 4 | 12:56:53 | 27:24:27 | 205 |
5.1 Region 1: core of NGC4839
The origin of this X-ray emission is somewhat unclear. It might be the AGN of NGC4839, which is known as a radio source, or the emission might be thermal. Fitting a power law with the results as shown in Tab.1 gives a reduced in the order of 1.3. Fitting a thermal plasma improves the fit with a reduced of about 0.8-0.9.
5.2 Region 2: the tail of NGC4839
This region, for which we only adopted a thermal emission model shows high temperature and metallicity. The temperature is too high for a galaxy, which ranges more about 1 keV and not around 4.5 keV, as observed. This might be explained by ram pressure stripping: the hot gas is blown out as the medium encounters the ICM of the Coma cluster. Due to the high velocity of the infall of NGC 4839 into the Coma cluster, shocks could occur, which heat the intergalactic medium. The fact that we see the tail pointing away from the center of the Coma cluster is a strong indication for this scenario (see also discussion).
5.3 Region 3: the region South of NGC4839
As can be seen in Fig.3, the region South of NGC4839 seems to have a different spectrum with respect to center or tail of NGC4839. We fit a thermal plasma and a power law to the spectrum of this region. The results, again are shown in Tab.1. Both models for the emission are acceptable. The intergalactic medium around NGC4839 could be heated by shocks caused from the infall of NGC4839 onto the Coma cluster (see also the discussion section).
A power law emission could be linked to the particles responsible for the radio emission observed in NGC4839. NGC 4839 is a radio source showing two opposite jets and a complex radio tail. This radio tail is extended in S-W direction and coincides nicely with region number 3 (see Venturi et al. venturi (1990)). If the X-ray emission in this region is linked to the radio tail it could come from Inverse Compton scattering of cosmic microwave background photons as they interact with the relativistic electrons originating from the radio jet. However, in this case it is not clear whether XMM has intrinsically enough sensitivity to resolve this IC emission.
Comparing the surface brightness of region 2 and region 3 we find a difference in intensity of a factor of about 3.5 in the energy band keV. If we assume that the emission is thermal and thus the radiated energy and furthermore that region 2 and 3 are in pressure equilibrium we expect a difference in surface brightness of the order of 2.5, since region 2 has about =5 keV and region 3 has most likely a temperature of about =8 keV. The remaining difference between the surface brightness intensities might, in this case be due to differences in metallicities or extend in the line-of-sight. Region 2 has a high metallicity and is in a temperature range, where line emission is more dominant than at 8 keV.
Taking this all together (see also discussion) we think that it is more likely that the emission of region 3 is due to thermal bremsstrahlung rather than due to IC scattering.
5.4 Region 4: main body of sub group
This is the center of the extended X-ray emission of the subgroup. The fitted temperature of about =4.4 keV is consistent with ASCA results by Watanabe et al.(watanabe (1999)). The metallicity of this group seems to be typical with a best fit abundance of 0.3. The abundance seems to be significantly smaller than the one observed in the tail of NGC4839 (region 2).
6 Discussion
6.1 The structure around NGC 4839
There have been already several studies dealing with the physics of galaxies falling onto clusters, like Gaetz et al. (gaetz (1987)), Balsara et al. (balsara (1994)) or Stevens et al. (stevens (1999)) (hereafter SAP99) and references therein. SAP99 found different dynamical features for the infall depending on cluster gas temperature, galaxy mass replenishment rate and infall velocity. SAP99 performed simulations based on a 2D hydrodynamic code, which is similar to the one used in Balsara et al. (balsara (1994)). The ICM follows a beta-model distribution with and a mass distribution of the which extends up to 32.2 kpc. Similar parameters for the galaxy distribution have been used by Gaetz et al. (gaetz (1987)). The hardness ratio image Fig.3 around NGC 4839 shows morphological similarities to their model 2c. The physical properties of this model 2c are an intermediate cluster at 4 keV and an infall velocity of 1380 km/sec. These numbers are slightly different to what is observed in the case of NGC4839. Coma has a gas temperature of about 8 keV and an infall velocity of 1700 km/sec (Colless & Dunn colless (1996), hereafter CD96). Despite the differences in actual numbers we interpret the striking resemblances as a strong indication for NGC4839 being on its first infall onto the Coma cluster (see for example CD96), and not, as suggested by Burns et al. (burns (1994)) going out of the cluster after having already passed through the Coma center.
6.2 Displacement of NGC4839 and the extended X-ray emission
Another feature which is striking in our observations is the displacement of the extended X-ray emission belonging to the sub group of NGC 4839 and NGC 4839 itself of about 8 arcmin (see for example Fig.3). This corresponds to roughly 300 kpc. From the optical study by CD96 NGC 4839 seems to be right in the centroid of the galaxy distribution belonging to the sub group. It seems therefore likely that the galaxies belonging to the sub group are on average closer to the Coma center than the hot gas belonging to the sub group. Such a displacement between galaxies and gas is expected when the sub group encounters the gas of the main cluster. The ICM of the main cluster slows down the infall. As the galaxies in the sub group show larger densities and therefore a smaller surface-to-mass ratio than the gas, the galaxies are less affected by the ram pressure force than the intra group gas. In the following we make a first order calculation to see whether this effect is large enough to explain the displacement of about 300 kpc between NGC4839 and the center of the gas. For a rough calculation we estimate that the acceleration due to gravitational forces is much stronger than the counteracting ram pressure force. We furthermore assume a total mass of the Coma cluster of M⊙ (Hughes hughes (1989); Briel et al. briel1 (1992); CD96), and that the Coma cluster mass is a factor of ten higher than the mass of the infalling group (CD96). In a very rough approximation we suppose that the Coma mass distribution is to first order point-like. This gives an infall velocity of NGC4839 of 2400 km/sec, supposing a distance to the Coma cluster to Mpc (this is the projected distance see also Dow & White dow (1995), or CD96 – the most likely infall direction is close to the plane-of-sky). The approximated infall velocity is not too different to the calculated value of about km/sec by CD96. For the ram pressure we use and for the density distribution of the ICM a beta-model (). For simplicity we assume and kpc, which is in good agreement with the ROSAT measurements by Briel et al. (briel1 (1992)). For we use their calculated value of cm-3 and transform it into . For the surface of the gas encountering the ICM of Coma we suppose a circular surface with a radius of kpc (we take the radius of the outermost contour on Fig.3) and a gas mass of about M⊙. The force exerted by the ram pressure is . is the surface of the sub group gas, its mass and the deceleration. For the slowing down we calculate . We suppose , which is certainly true at distances greater 1.6 Mpc. Filling in all parameters we get km/sec, which means that the actual infall velocity is diminished by 540 km/sec for the hot gas of the sub group. Extrapolating a difference in velocity between NGC4839 and the gas of 540 km/sec (we assume that the ram pressure force is negligible for the galaxy) to the time which the group needed to go from the virial radius (about 3 Mpc) to the observed distance of 1.6 Mpc we see that we obtain a difference in location of about 400 kpc assuming a constant infall velocity of 2000 km/sec for NGC4839. This value which was determined with many approximations is of the same order of magnitude as the observed displacement between gas and galaxy. The differences in location between NGC 4839 and the group gas is thus likely to be due to the ram pressure exerced by the pressure of Coma’s ICM. In addition, more detailed modeling of this infall is certainly very interesting, since it is very likely that the displacement can be used to determine the density or temperature of the ICM at large radii.
6.3 The mass ratio NGC4839 group - Coma cluster
We obtain a temperature of the sub group of about 4.5 keV. Comparing this to the central temperature of the Coma cluster of about 8–9 keV and applying the M-T relation of we obtain a mass ratio of . This ratio is very high in comparison to the result of CD96, who find that the sub group has 5-10% the mass of the Coma cluster. This discrepancy can be either explained by superposition of the gas in the group with the hotter ICM of the Coma cluster or the fact that the ICM of the NGC4839 group is heated up above its initial virial temperature. A plausible scenario is that the subgroup is in a process of internal merging. – The somewhat disrupted morphology of the extended emission seen in Fig.1 and Fig.2 is an indication for that. Such processes of internal merging were already observed in hydrodynamic simulations (see for example Schindler & Müller schindler (1993)). If the ICM of the sub group were heated up by a factor of two, which is reasonable, and its initial virial temperature was 2 keV, we would obtain a mass ratio of , which is in good agreement with the values obtained by CD96.
7 Conclusion
We performed a first analysis of the XMM-Newton data of the NGC4839 group, which has a projected distance of the Coma cluster of 1.6 Mpc. In our analysis we resolve for the first time a complex temperature structure around NGC4839 which can be explained by a first infall of the galaxy onto the Coma cluster.
Furthermore, we measure a displacement between NGC4839, the dominant galaxy of the group and the extended X-ray emission coming from its ICM. In a simple approximation we can explain this displacement by a ram pressure force of Coma’s ICM acting on the hot gas of the sub group as it falls onto the Coma center.
Acknowledgements.
We would like to thank J. Ballet for support concerning the SAS software and J.-L. Sauvageot for providing the gain correction. We want to thank L. Feretti and A. Bykov for very useful discussions.References
- (1) Arnaud, K.A., 1996, Astronomical Data Analysis Software and Systems V, eds. Jacoby G. and Barnes J., p17, ASP Conf. Series volume 101.
- (2) Arnaud, M., Aghanim, N., Gastaud, R., et al. 2001, A&A, 365 (this issue)
- (3) Arnaud, M., Neumann D.M., Aghanim, N., Gastaud, R., Majerowicz, S., Hughes, J.P. 2001, A&A, 365 (this issue)
- (4) Balsara, D., Livio, M., O’Dea, C.P. 1994, ApJ, 83
- (5) Briel, U.G., Henry, J.P., Böhringer, H. 1992, A&A, 259, L31
- (6) Briel, U.G., Henry, J.P., Lumb, D.H. et al. 2001, A&A, 365 (this issue)
- (7) Burns, J.O., Roettiger, K., Ledlow, M., Klypin, A. 1994, ApJ, 427, L87
- (8) Colless, M., & Dunn, A.M. 1996, ApJ, 458, 435 (CD96)
- (9) Dickey, J.M., & Lockman, F.J. 1990, ARA&A, 28, 215
- (10) Dow, K.L., & White, S.D.M. 1995, ApJ, 439, 113
- (11) Fitchett, M., & Webster, R. 1987, ApJ, 317, 653
- (12) Gaetz, T.J., Salpeter, E.E., Shaviv, G. 1987, ApJ, 316, 530
- (13) Hughes, J.P. 1989, ApJ, 337, 21
- (14) Jansen, F., Lumb, D., Altieri, B. et al. 2001, A&A, 365 (this issue)
- (15) Kaastra, J.S. 1992, An X-Ray Spectral Code for Optically Thin Plasmas (Internal SRON-Leiden Report, updated version 2.0)
- (16) Liedahl, D.A., Osterheld, A.L., Goldstein, W.H. 1995, ApJL, 438, 115
- (17) Mellier, Y., Mathez, G., Mazure, A., Chauvineau, B., Proust, D. 1988, A&A, 199, 67
- (18) Merritt, D., & Tremblay, B. 1994, AJ, 108, 514
- (19) Mewe, R., Gronenschild, E.H.B.M., van den Oord, G.H.J. 1985, A&AS, 62, 197
- (20) Mewe, R., Lemen, J.R., van den Oord, G.H.J. 1986, A&AS, 65, 511
- (21) Rué, F., & Bijaoui, A. 1997, Experimental Astronomy 7, 129
- (22) Schindler, S., & Müller, E. 1993, A&A, 272, 137
- (23) Stevens, I.R., Acreman, D.M., Ponman, T.J. 1999, MNRAS, 310, 663
- (24) Turner, M.J.L., Abbey, A., Arnaud, M. et al. 2001, A&A, 365 (this issue)
- (25) Venturi, T., Giovannini, G., Feretti, L. 1990, AJ, 99, 1381
- (26) Watanabe, M., Yamashita, K., Furuzawa, A., Kunieda, H., Tawara, Y., Honda, H. 1999, ApJ, 527, 80
- (27) White, S.D.M., Briel, U.G., Henry, J.P. 1993, MNRAS, 261, L8