Truncations in stellar disks
Kapteyn Astronomical Institute, University of Groningen,
P.O. Box 800, 9700 AV Groningen, the Netherlands
email: vdkruit@astro.rug.nl
1. Background.
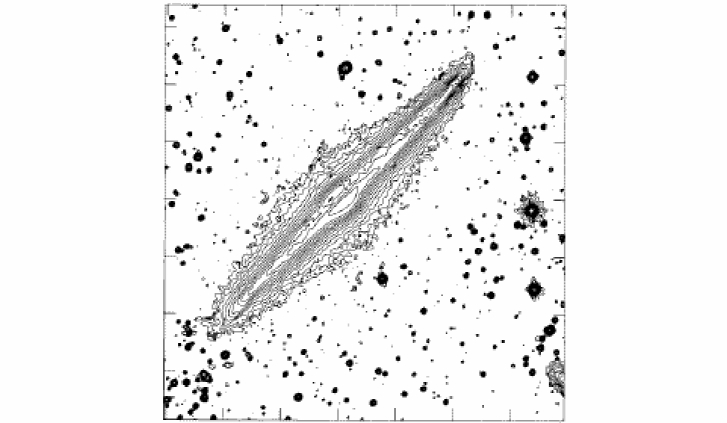
Stellar disks in edge-on spiral galaxies have been known to have –at least in some cases– rather sharp edges or truncations (van der Kruit 1979). These are obvious when examining isophote maps in which the outer isophotes in the radial direction come suddenly much closer together (see Fig. 1). The reality of the truncations can also be inferred from the fact that the fainter isophotes of bright stars and along directions perpendicular to the galaxy plane in Fig.1 do not show the decrease in spacing.
Truncations can also be inferred from the fact that often diameters of edge-on galaxies appear not to be growing between early sky surveys (using IIa-emulsions) and later, deeper surveys (IIIa-emulsions). Bosma & Freeman (1993) compared diameters of galaxies on the Palomar Observatory Sky Survey prints with those on the SRC-J Survey. About a quarter of the galaxies showed no significant increase in diameter, suggesting a cutoff in the outer disks. They calibrated their SRC limiting isophotes as about 25.5 B-mag arcsec-2, which is at about the level where often the truncations become visible in edge-on galaxies (but not in more moderately inclined ones).
Van der Kruit & Searle (1981a,b, 1982) found in a sample of 7 edge-on spirals that the truncations occured at a galactocentric distance of 4.2 0.5 exponential scalelengths of the surface brightness distribution. Many moderately inclined spiral galaxies have a (face-on) central surface brightness of about 21.7 B-mag arcsec-2 (Freeman 1970). Considering that the limiting surface brightness in many photometric studies is about 26 to 27 B-mag arcsec-2 and that the truncations occur at 4 or 5 radial scalelengths, it would be very difficult to see the cutoffs in face-on galaxies. Furthermore, it would be misleading to look for these in published radial surface brightness profiles, since these are usually produced by azimuthally averaging the observed surface brightness maps; this procedure smoothes out truncations when these are not exactly circular.
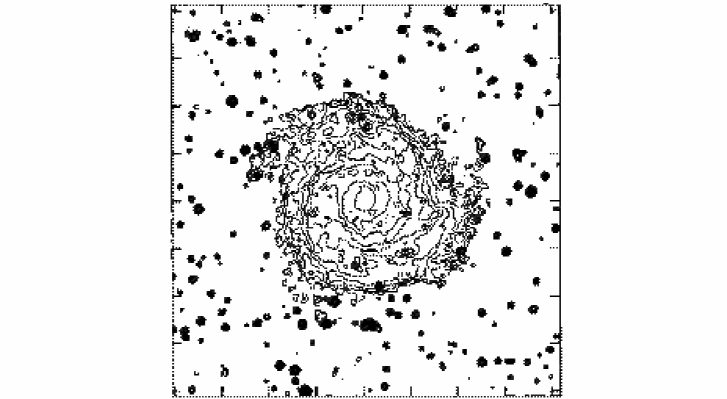
Van der Kruit (1988) examined the isophote maps of the Wevers et al. (1986) sample and found that in most systems the outer contours were more closely spaced than the inner ones, suggesting a drop in scalelength by at least a factor two (see Fig. 2). Four systems did not show this effect and the disks seemed to extend out to 6 or 7 scalelengths; interestingly, these were all of early type. The remaining 16 systems did show the effect and this suggested a truncation at . Isophote maps of Roelof de Jong’s sample (de Jong & van der Kruit 1994) show the effect also in many cases.
Evidently, the stellar material moving near these cutoffs constitutes that with the highest specific angular momentum in the disk and it is not unreasonable to expect that the distribution of specific angular momentum should have a reasonably well-defined upper limit. Mestel (1963) has shown that the distribution of specific angular momentum in disks of spiral galaxies closely resembles that of a uniformly rotating, uniform density sphere.
If is the specific angular momentum and the fraction of the mass with specific angular momentum less than or equal to , then this distribution for the uniformly rotating, uniform density “Mestel” sphere is
where is the maximum specific angular momentum at the “equator” of the surface of the sphere. If this sets in a flat disk with a flat rotation curve with rotation velocity with detailed conservation of angular momentum (Fall & Efstathiou 1980), then the resulting surface density distribution is close to an exponential (Gunn 1982) and van der Kruit (1987) showed that the scalelength of this distribution is
This implies that the maximum radius of the disk (where the specific angular momentum equals ) is and a sharp truncation occurs there. Crucial in this description is of course that the disk settles with detailed conservation of angular momentum.
2. Recent developments.
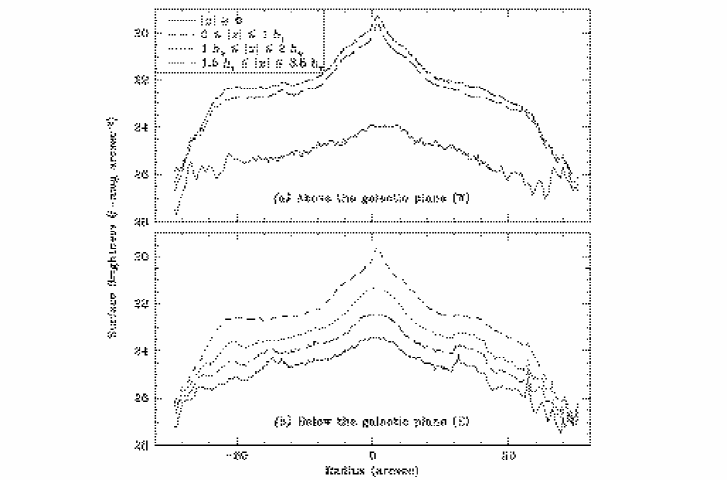
Recently, surface photometry in the optical and near-infrared for a complete sample of edge-on galaxies has become available in the thesis of Richard de Grijs (de Grijs & van der Kruit 1996; de Grijs 1998). Kregel, van der Kruit & de Grijs (in preparation; see also the poster by Kregel & van der Kruit in this volume) are in the process of re-analysing these data. At this time only the disk scale parameters have been rederived. De Grijs, Kregel & Wesson (2000) have done a first analysis looking for possible truncations in four of these systems. They find that all four have truncations in their disks and at least three are very symmetric on both sides (see Fig. 3).
The truncations are not very sharp; the scalelengths drop to about 2 to 3 kpc. The values for the truncation radii in terms of the radial scalelengths are 4.3, 3.8, 4.5 and 2.4. There is very little dependence of the truncation radius itself on color (in , and ). However, scalelengths are known to vary with wavelength (de Jong 1996a,b) and the ratio then remains color dependent.
Pohlen, Dettmar & Lütticke (2000) and Pohlen et al. (2000) have recently analysed a sample of 31 edge-on galaxies. They fitted three-dimensional one-component models to the observed surface brightness distributions. Then all have sharp truncations (their algorithm always fits a truncation to the data, although in principle its radius could become infinite). These occur at , significantly less then 4.5. They argue that dust absorption could raise this value by 0.5 at most. Although this ratio does not correlate with Hubble type, it does become on average smaller with increasing scalelength. The Kregel et al. and the Pohlen et al. samples have three galaxies in common. For two the determined scalelengths agree at a satisfactory level.
The sample of Pohlen et al. is not complete in a statistical sense; rather it is weighted heavily in favour of large scalelengths. In Table 1 I compare the distribution of in the three available samples of edge-on galaxies.
| v.d.Kruit & Searle | de Grijs et al. | Pohlen et al. | ||||
|---|---|---|---|---|---|---|
| (kpc) | ||||||
| 0 - 6 | 7 | – | – | 10 | ||
| 6 - 10 | – | – | 2 | 4.3, 2.4 | 12 | |
| 10 - 15 | – | – | 2 | 3.9, 4.5 | 7 | |
The results of de Grijs et al. and of Pohlen et al. for a large part concern galaxies with very large disk scalelengths (even larger than in our Galaxy or M31). From de Jong (1996) we can estimate that in a volume-complete sample of disk galaxies somewhat less than 1% has a scalelength larger than 6 kpc.
So we may conclude:
Truncations indeed occur in many stellar disks, are often symmetric
and seem not dependent upon color.
The ratio appears often less then
4.5. This would imply that truncations should be more easily
observable in moderately inclined systems.
Current samples may not be representative and very strongly
biased towards disks with the largest scalelengths.
The value for the scalelength is crucial (and
color-dependent) and it is important to compare the fitting techniques
that are being used.
The situation in our Galaxy is at present unclear. On the basis of the distribution of OB-stars and HII-regions, one would expect the truncation radius to be 20–25 kpc. The value for the disk scalelength in the Galaxy is still under discussion. Recent analyses of the near-IR and COBE data seem to suggest a disk scalelength of order 2.5 kpc (e.g. Freudenreich 1996, 1998), while the truncation radius of the disk would occur at about 12 kpc. The latter seems at variance with the occurence of HII-regions at much larger radii. Also note that for a galaxy with a rotation velocity of about 220 km/s, the expected value for the disk scalelength would be about 4–5 kpc. For a fuller and more detailed discussion see van der Kruit (2000).
3. Beyond the edge
Various studies (Sánchez-Saavreda et al. 1990; Florido et al. 1991, de Grijs 1997) have indicated that warps exist in most stellar disks. However, these constitute a maximum excursion from the plane of the disk of a only few percent.
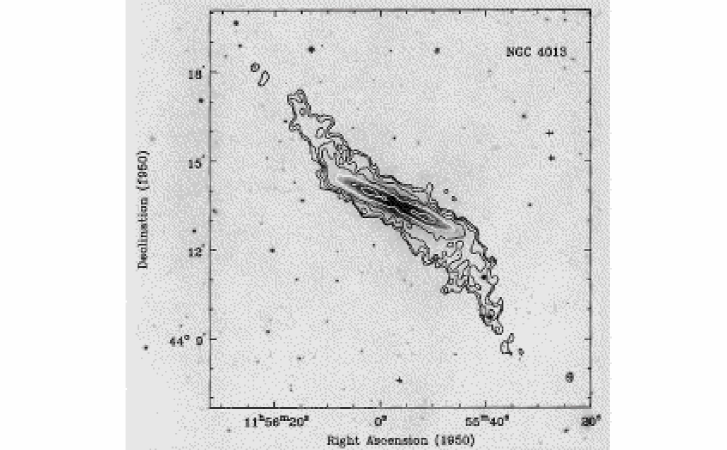
Warps in the HI layer are much larger and extend much further out. The archetypical example is NGC 4013 (Bottema, Shostak, & van der Kruit 1987; Bottema 1995,1996). The HI warp starts at about the truncation of the stellar disk and is accompanied by a significant drop in rotation velocity. The latter suggests a truncation in the disk mass distribution as well as in the light. Also the HI surface density drops at the start of the warp and abruptly flattens off.
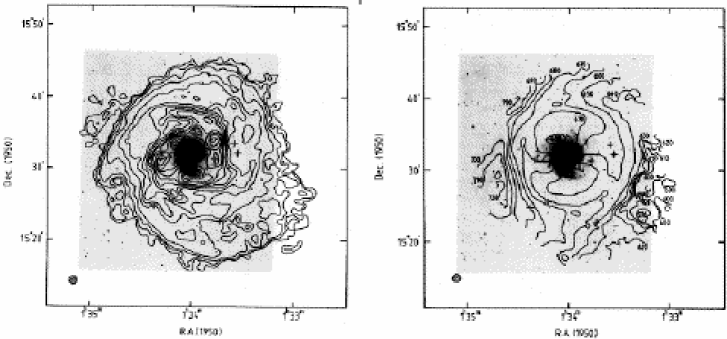
A face-on spiral with an HI-warp is NGC 628 (Shostak & van der Kruit 1984; Kamphuis & Briggs 1992). The velocity field suggest a warp in the HI, starting at the edge of the optical disk. There is no clear feature in the rotation curve there (but it might be difficult to observe at NGC 628’s small inclination), but again the HI surface density distribution suddenly flattens off. Note that also the spiral structure in the gas is continuing right through the onset of the warp. Kamphuis and Briggs argue for a recent accretion event as the cause of the warp on the basis of the motions in the gas becoming more chaotic with increasing galactocentric radius.
Ferguson et al. (1998) find evidence for faint HII-regions in the extreme outer parts of three spiral galaxies, among which NGC 628. In the latter H is observed out to twice the optical radius. So, some star formation seems to be going on there. Interestingly, also a sharp drop is seen in the azimuthally averaged H surface brightness exactly at the edge of the disk. Abundance determinations in these extreme outer regions indicate values of order 10 to 15% of solar in O/H and 20 to 25% in N/O abundance. Also, the Balmer decrements provide clear evidence that the internal extinction in these outer parts is very low ( mag), indicating dinimished dust contents. So, outer disks appear relatively unevolved compared to inner disks.
I have discussed only two clear examples here. However, many of these
features are found also in other galaxies.
I conclude:
Stellar disks are usually warped, but only moderately so.
Many spiral galaxies have HI warps and these
generally start near the truncation radius of the
stellar disk. The HI surface surface density suddenly becomes much
flatter with radius.
In some galaxies (notably NGC 4013, 891, 5907) there is a
drop in the rotation curve at the edges of the stellar disks.
Some star formation goes on in the extreme outer regions,
but the heavy element abundance and dust content are very low.
All evidence is consistent with the notion that the outer
gaseous parts of the disks constitute recently accreted material,at least
accreted after the formation of what is now the stellar thin disk.
4. The origin of the truncations
The origin of the truncations in stellar disks is still unclear. Originally Fall & Efstathiou (1980) and van der Kruit & Searle (1982) suggested, that the edges correspond to the positions where differential rotation becomes able to stabilize the gas layer (according to the Goldreich & Lynden-Bell [1965] criterion), so that star formation is prohibited beyond that radius. Kennicutt (1989) and others have argued that the truncation radius is the position where the gas density drops below a critical value for star formation. This is then regulated by the Toomre (1964) stability parameter . These two hypotheses are not made compatible easily with the sudden drop in the rotation curves at .
The notion that the truncation radius results from the maximum specific angular momentum present in the material from which the (presently stellar) disks formed is in itself straightforward. The paradigm, where the initial material resembles a Mestel sphere with uniform density and uniform rotation, and where the collapse into a disk occurs with detailed conservation of angular momentum (even if it occurs at a slow rate), provides a good explanation for the exponential nature of the disk surface brightness (and density). However, it also predicts a definite position for the truncation at , and that seems higher than is observed. This model would require therefore some redistribution of angular momentum.
Another possibility is very slow disk formation, where the truncation radius would then be the extent out to which the disk has presently formed. This and models of viscous processes regulating star formation (e.g. Lin & Pringle 1987; Yoshii & Sommer-Larsen 1989) predict no particular value for the truncation radius in terms of the disk scalelength. Tidal interactions are only a possibility in some systems; truncations exist in galaxies independent of their environment.
References
Bosma, A., & Freeman, K.C. 1993, AJ, 106, 1394
Bottema, R. 1995, A&A, 295, 605
Bottema, R. 1996, A&A, 306, 345
Bottema, R., Shostak, G.S., & van der Kruit, P.C. 1987, Nature, 328, 401
de Grijs, R. 1997, Ph.D. Thesis (University of Groningen), Ch. 9
de Grijs, R. 1998, MNRAS, 299, 595
de Grijs, R., Kregel, M., & Wesson, K.H. 2000, MNRAS, (astro-ph/0002523)
de Grijs, R., & van der Kruit, P.C. 1996, A&AS, 117, 19
de Jong, R.S. 1996a, MNRAS, 313, 45
de Jong, R.S. 1996b, MNRAS, 313, 377
de Jong, R.S., & van der Kruit, P.C. 1994, A&AS, 106, 405
Fall, S.M., & Efstathiou, G, 1980, MNRAS, 193, 189
Ferguson, A.M., Wyse, R.F.G., Gallagher, J.S., & Hunter, D. 1998, ApJ, 506, L19
Ferguson, A.M., Gallagher, J.S., & Wyse, R.F.G. 1998, AJ, 116, 673
Florido, E., Prieto, M., Battaner, E., Mediavilla, E., & Sánchez-Saavedra, M.L. 1991, A&A, 242, 301
Freeman, K.C. 1970, ApJ, 160, 811
Freudenreich, H.T. 1996, ApJ, 468, 663
Freudenreich, H.T. 1998, ApJ, 492, 495
Goldreich, R., & Lynden-Bell, D. 1965, MNRAS, 130, 125
Gunn, J.E. 1982, in Astrophysical Cosmology, eds. H.A. Brück, G.V. Coyne & M.S. Longair, 233
Kamphuis, J., & Briggs, F. 1992, A&A, 253, 335
Kennicutt, R.C. 1989, ApJ, 344, 685
Lin, D.N.C., & Pringle, J.E. 1987, ApJ,320, L87
Mestel, L. 1963, MNRAS, 126, 553
Pohlen, M., Dettmar, R.-J., & Lütticke, R. 2000, A&A, 357, 1P
Pohlen, M., Dettmar, R.-J., Lütticke, R., & Schwarzkopf, U. 2000, A&AS, 144, 405
Sánchez-Saavreda, M.L., Battaner, E., & Florido, E. 1990, MNRAS, 246, 458
Shostak, G.S., & van der Kruit, P.C. 1984, A&A, 132, 20
Toomre, A. 1964, ApJ, 139, 1217
van der Kruit, P.C. 1979, A&AS, 38, 15
van der Kruit, P.C. 1987, A&A, 173, 59
van der Kruit, P.C. 1988, A&A, 192, 117
van der Kruit, P.C. 2000, in: The Legacy of J.C. Kapteyn, ed. P.C. van der Kruit and K. van Berkel, Kluwer, Dordrecht, 299
van der Kruit, P.C. & Searle, L. 1981a, A&A, 95, 105
van der Kruit, P.C. & Searle, L. 1981b, A&A, 95, 116
van der Kruit, P.C. & Searle, L. 1982, A&A, 110, 61
Wevers, B.M.H.R., van der Kruit, P.C. & Allen, R.J. 1986, A&AS, 66, 505
Yoshii, Y., & Sommer-Larsen, J. 1989, MNRAS, 236, 779